Register for a Free Live Training
The Hot Stocks Outlook uses VantagePoint’s market forecasts that are up to 87.4% accurate, demonstrating how traders can improve their timing and direction. In this week’s video, VantagePoint Software reviews forecasts for Workday ($WDAY)., Wolverine World Wide($WWW), Microsoft ($MSFT), Franklin Resources ($BEN), Goldman Sachs($GS) and Regeneron ($REGN)
Hello again, traders and welcome back to the Hot Stocks Outlook for June 10th, 2022. I hope y’all are having a excellent week out there in the financial markets and like always, plenty to cover here in today’s outlook. A really exciting time in the market and I want to go through it with you here. So we’ve got a lot of different narratives and what I’m going to do is actually revisit a lot of these stocks that we’ve covered over the past several weeks.
Regeneron, actually going back to mid-April and walking this forward and understanding how you can take long positions, short positions and get that exposure to the market so that you benefit off of those bigger moves in the market, but not get yourself into trouble, and really find the best places to take on that exposure.
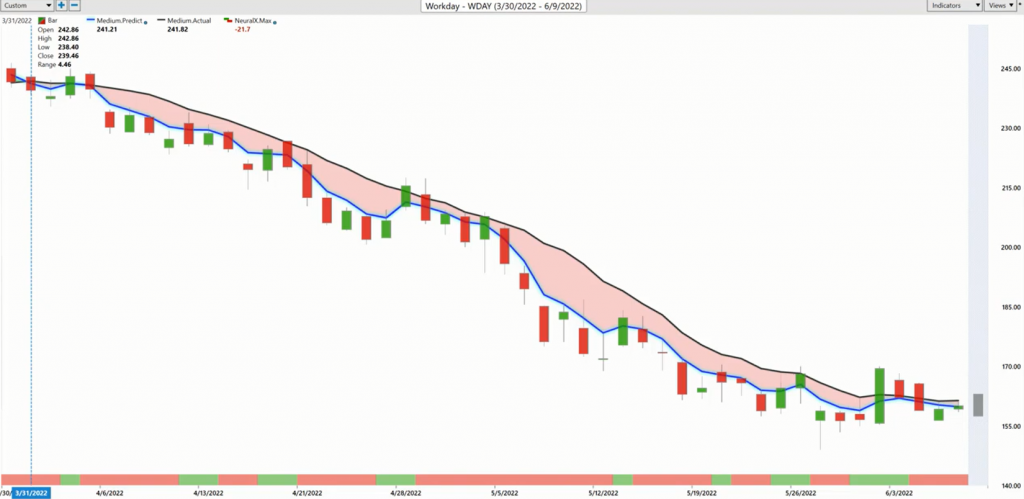
So I wanted to start out here with shares of Workday and we looked at this last week, and you see we’re having a really strong rally, but we weren’t looking at this as a blue line crossing above the black line because that had not occurred.
And so, we can go ahead and revisit this chart and really go through all these indicators, but really understand these different things going on in the market and how you can recognize the bigger narratives, and where you can get ahead of these things, and set up the portfolio to really benefit from when volatility really comes into the marketplace. So here we have shares of Workday and what we have is daily price action. So all of these candles represent a full and complete trading day.
And right up against that price data, you’ll notice that there’s a black line there and also a blue line. So the black line that you’re seeing there is a simple moving average. It’s a very common technical indicator. And in this case, it’s looking back at the previous 10 close prices, it adds those all together, divides by 10 and you get that smoothing out of the price action. And it lets us know where market price has been over a given period of time. But because all the data comes from what just occurred, it really gets dragged around and summarizes price, but doesn’t really let us know what’s likely to occur next.
And so, what we want to do is actually compare that black value on the chart, that simple moving average to this blue line. And for that number to get calculated and plotted against the chart for the trader every evening, this is where VantagePoint’s technology of artificial neural networks come into play and they’re performing what’s called intermarket analysis. So artificial intelligence is very good at taking in a huge amount of data and making very accurate predictions, but it’s very important to understand what is the data being used to generate those predictions?
And so, what we understand about Workday and stocks and if you’ve been trading recently, you’ve seen oil and the Dollar Index ripple through markets and really bleed into the big narratives that are driving things right now. But individual markets share very subtle relationships that offer extremely helpful clues that can get us ahead of price movements and help us make better trading decisions. So that can be things like the NASDAQ, individual tech shares, the Dollar Index, interest rates, crude oil prices. And we know all these things factor into our portfolio and the things that we’re trading.
And so, what the software’s able to do is take all that into account and use those neural network accurate predictions to generate predictions of future price, and where things are likely to move. And it uses those price predictions and actually builds those values into these indicators turning what were lagging tools that are just going to get dragged around by what’s already occurred in the market into forward-looking predictive tools. And so, what this allows us is to get these really leads as far as market reversals, but also have very accurate tools that can help us manage these opportunities.
So in the case of Workday, once that blue line crosses below the black line it’s suggesting average prices are going to start moving lower, and you therefore would want to look to take short positions. Now, you can have a lot of different time frames and styles of tradings where you might want to express that. But certainly as this market has moved down 34% over the last 48 trading days, you would want to be expressing those bearish expressions on the market through whatever stocks or instrument or options that you might want to use.
And conversely, I would argue that going into a period like we’re going into now where the dollar is really moving around and rippling through stocks and these relationships, well, this is an excellent thing that you may keep on the portfolio. You’ve pulled a lot out of it and it still looks like, “Hey, this thing is still moving” and maybe you’ve got some other things that you can bring into the portfolio.
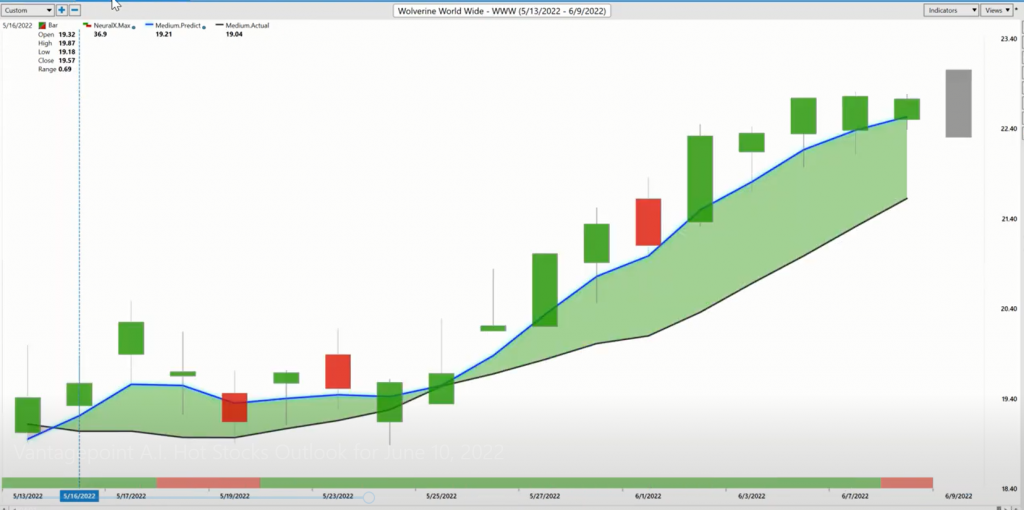
So this is where Wolverine Worldwide, this was one of the most earlier opportunities that we saw strength coming into things. And so, this is why we had a lot of separation and you’ve seen while markets have run sideways, this is actually held up.
But interestingly today, we’ve got a bearish neural index and let’s go into what those neural index readings tell us about the market. And so, the predicted moving average is very simple letting us know where average prices is likely to move. Can help us recognize those trend reversals. Down here at the bottom of the chart, you see you have this bar that goes from green to red, and this will get updated each and every trading day, but this neural index is tuned to solve a different problem and that problem is short-term strength or weakness in the market.
And as far as the time frame that relates to it, it’s a 48-hour window. So very short-term, you can think of it as a couple candles of strength or weakness within maybe this bigger narrative that you’ve identified. And so, this can make it very easy for traders to understand, “Okay, well, we may get some weakness over the next couple days, but once that neural index gets bullish, well, it’s full steam ahead and this thing’s moving higher.”
Now, I do want to bring in that even today the neural index is bearish and we’ve come up and hit that predicted high. And this is where you get that information that says, “Okay, well maybe it’s good to go ahead and manage some of the opportunity, take some off, maybe have some shorts in the portfolio that sort of balance things out.” And as volatility kicks into things and the dollar starts ripping around, well, that may really benefit you because you’ve come in and structured at your portfolio this way and made decisions effectively.
So that’s where the neural index can really help you, but every week we also look at this predicted high and low range and we have to consider again that there’s a separate neural network trying to figure out, “Okay, well, how are those inner markets affecting how high this market may trade?” And another neural network trying to figure out, “Okay, well, how are those inner market relationships going to affect how low this market may trade?” And again, these make highly accurate predictions of what’s likely to occur in the respective time frames.
And in this way, we can use these tools to say, “Okay, well, if I’m trying to get long Wolverine Worldwide, I should certainly look down towards these predictive levels on days like this are excellent” because you just get filled at the open, the market immediately moves higher. But this has been what I would consider a safer place to trade and pull some money out of the bullishness that we’ve seen throughout the S&P 500 and the broader marketplace.
So really nice opportunity here in Wolverine Worldwide, about 17% move, but multiple opportunities along the way. And it’s really the combination of these predictive forecasts across all the markets that allow you to understand, “Okay, well, Wolverine Worldwide is certainly not Workday here.” And there’s a difference in the nature of what those markets are like and what sectors they’re in. And that can make it a little bit easier to figure out, “Okay, if I’m trying to get along a market, where are the better shares to do that? And once I’ve gotten along and made money, where might I want to hedge myself and actually stay short?”
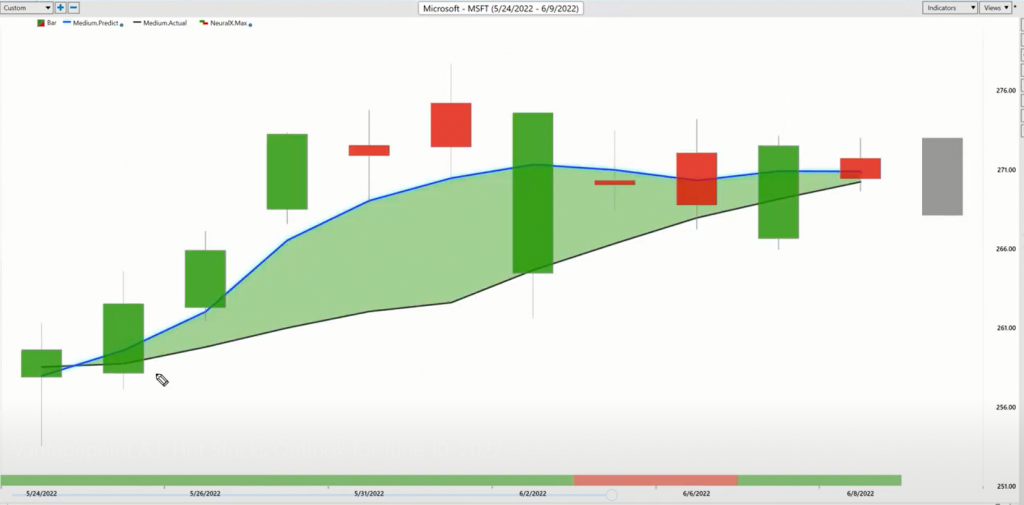
So this brings us over to shares of Microsoft here. And again, this is very similar to the S&P 500, but we get this sideways period. And a lot of this has to do, in my opinion, with dollar rallying. And that’s what you have to understand about these intermarket relationships is it’s not just the S&P 500. The S&P gets driven around by the dollar and the currencies and even things like the international exchanges, like the Nikkei and the European stock exchanges and all these things ripple through, including things like the ETFs and the individual stocks that may affect things.
And so, here we see again in Microsoft as far as the decision-making, and then also understanding that, “Hey, if there’s strength here, there’s likely to be some broad-based strength.” Well, that’s made more sense as far as taking bullish exposure to the marketplace here, but I want to bring this through because we are seeing some things shift around. So we looked at Franklin Resources a couple weeks ago as well, highlighting the strength coming in, but clearly we can see that something has drastically shifted here.
And if we still want to have that bullish exposure to the market, well, we know some places where it’s safer to do that, but it certainly seems to make some sense to hedge ourselves. And there are many stocks here that aren’t in these uptrends. There’s generally periods where we get a lot of stocks that are all in uptrends across different sectors. Here we’re seeing some very clear problems in financial, healthcare, consumer non-cyclical, a lot of these really important spots here.
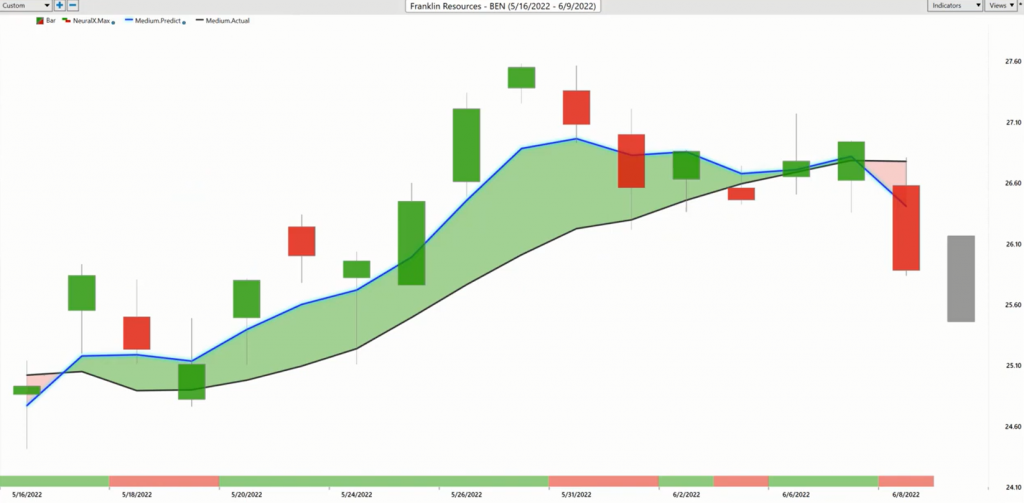
So there’s Benjamin Franklin. Again, we can just look at on the way up, you have these tools to really guide you to get those really nice entries as a trend trader, but also manage things effectively and understand, “Okay, well, we may be getting some weakness over these 48-hour periods,” so that if you are buying at cheaper levels, you can get out of the way and recognize, “Hey, something’s off here potentially.” And pull the money out of it and get out of the way or hedge and short and trade somewhere else.
So again, just kind of revisiting many of these opportunities, so you can sort of think through, “Okay, well, if I’m trying to figure out how to create a portfolio of many opportunities, how is this tool going to help me lean into the things that are likely to work like Wolverine Worldwide or Workday potentially on the downside?”
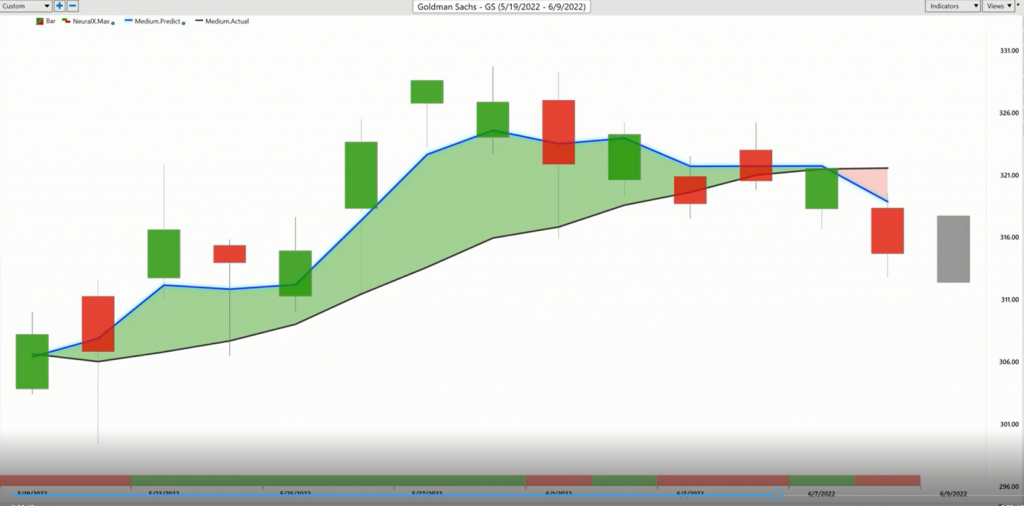
So here again, Goldman very similar in the forecast here, but we get these crossovers and we’ve had a couple weeks of some bullish trading here. And so, it makes sense buy the market, look for these moves up to the predicted high, but you see the neural index, some of these signals getting bearish and then very clearly some signals suggesting some issues, potential issues here.
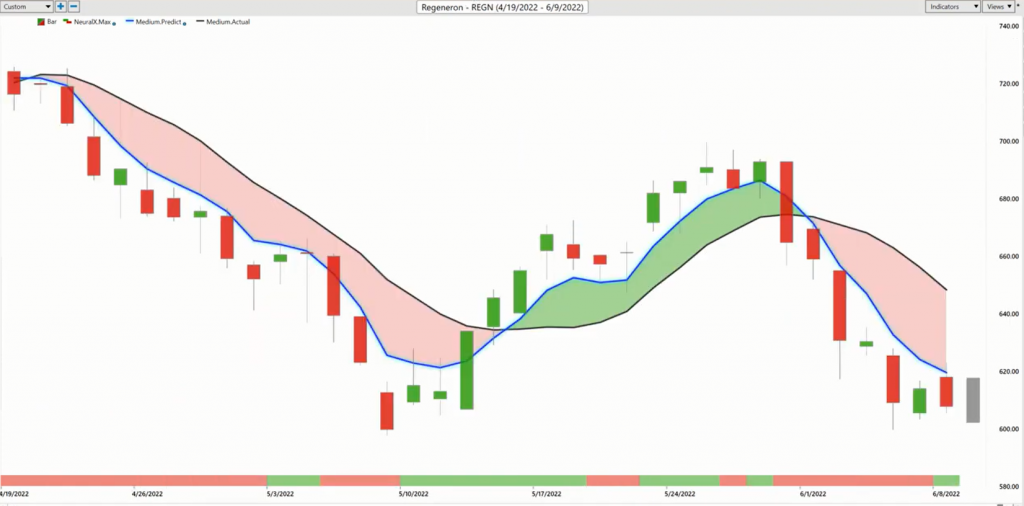
Now I want to take a look here at Regeneron and this is a market that actually, we had the forecast in on the upside coming in here. And then we highlighted that crossover to the downside here. And I just want to walk this all the way through so you can get the sense of how strength and weakness is rippling through some of these markets. So when this weakness comes in is when the broader markets are very weak and you want the portfolio net short there, and this can certainly be a part of that.
But you see as the forecasts start to straighten up here and you get this cross over the upside, well, the reality is two weeks later you are much higher in price. You want that indication that says, “Look, the forecasts are getting bullish here. If you were short, well, this may be a place to go ahead and cover over that time period about 517 or so.” Other things are happening, maybe you’re buying some Wolverine Worldwide, getting some more bullish exposure that way.
But you need to recognize that something’s shifted here in a market in a very intense way. You’ve got these financial stocks going lower and things are quite mixed out there. The tech stocks are out there. So there’s a very mixed narrative as far as the strength we’ve seen coming in the short-term with the VantagePoint forecast, but you don’t want to lose sight of some of those bigger narratives out there and how much strength and how much weakness is there when we really look across the stocks here?
So Regeneron here again, some really nice moves and you really got to consider that there’s a lot of trade management that can potentially come on when those shorts are coming on at the right time, like up here at 720 a share here, you see the market in total down about 15%. Of course, you can manage that over that time period, use these levels like the predicted highs and lows to pull more or less money out of those scenarios when they’re playing out.
So just again, I wanted to revisit a lot of these markets. We have a, like I mentioned, a very interesting marketplace here where we’ve had that strength that we’ve highlighted over the past few weeks, but it does seem like what would you expect to happen? A big rally? And then if the bigger move to the downside, a lot of that stuff fails.
And so, you want to know that’s certainly a higher probability here and get defensive, take profits and use those profits to stay with your longs if you’ve got some opportunities there as well. So I’ll leave it there. That’s been the Hot Stocks Outlook for June 10th, 2022. Thank you all for watching, best of luck out there and bye for now.