


Welcome to the Artificial Intelligence Outlook for Forex trading.
VIDEO TRANSCRIPT
U.S. Dollar Index
Hello everyone. And welcome back. My name is Greg Ferman, and this is the VantagePoint AI Market Outlook for the week of December the 27th, 2021. Now, as we move in towards year end here, one of the final outlooks for the year, we look at somewhat back in retrospect to the dollar. Now, the main indicators we’re going to be using in this week’s presentation is of course, we’re going to be looking at a 47 week look back. We’re using bars, not candles. Our predicted short, medium and long term differences. Our neural index, our neural index strength, our point in time, which is now set at the yearly opening price so we can see where we’re finishing the year to determine what’s really bullish and what’s really bearish. We’re using our predicted high and predicted low, our predicted RSI, our triple EMA cross that’s been modified for year end trading, where we’re only looking at the T cross long for the line in the sand between bullish and bearish.
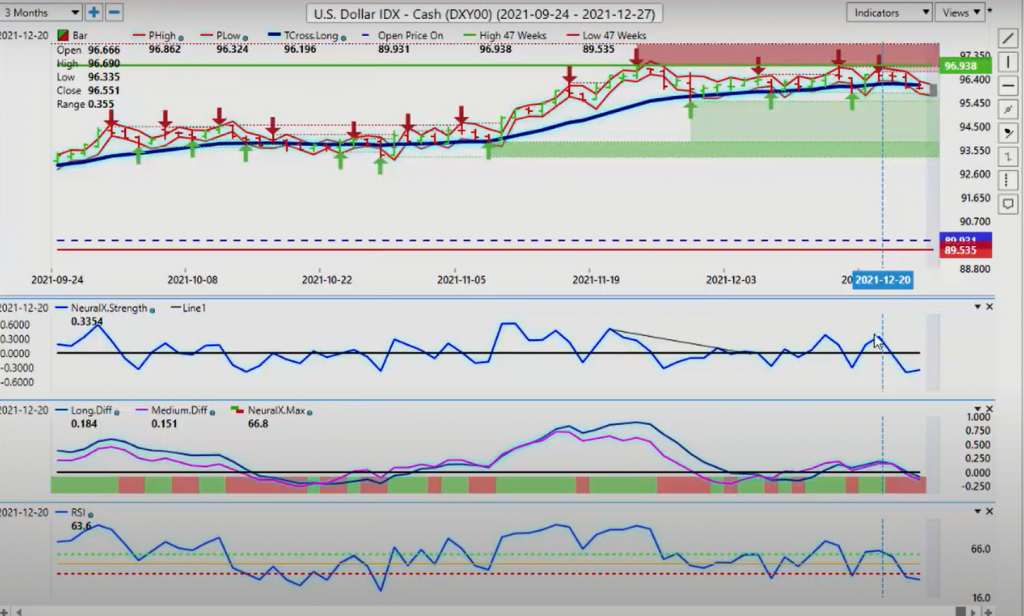
And of course, the very popular verified support and resistance zones that are one of the main indicators we use for reversals. Now, when we look at the dollar index going into this week’s coming trading, because again, this is an outlook, not a recap, we’re looking at further dollar weakness here. We’ve closed two days below the VantagePoint T cross long. This was predicted using the verified resistance high that’s coming in at approximately 9,669. We’ve got our verified zones all piled up here, a dark red ominous cloud sitting above the dollar index. We have our neural index strength dipping lower, our medium term crossing our long term predicted difference. This by definition means our medium term trend is weakening against the longer term up trend. They’re both pointing down and they’re both breaking down below the zero line as outlined in last week’s weekly outlook. Using the predicted RSI, we’re using a 60-40 split with a modified nine period predicted RSI.
When we break down below the 40 level, that tells us we have momentum building to the downside. And of course, the neural index is 100% in support. Now we do have significant verified support in this channel at 9,551. And I would respectfully submit that there is a strong possibility that at the very minimum, we will come down to the verified low at 9,605. But the dollar, usually, as I’ve stated throughout the month of December, the dollar usually is not strong in the month of December as money moves offshore. We’ve basically been running in a channel for the better part of the month since we’ve hit the high in November. That high coming in at 9,693. And the lower end of that channel is again 9,551, so I anticipate this channel will hold into the year end with a slight bearish bias towards the downside.
GOLD
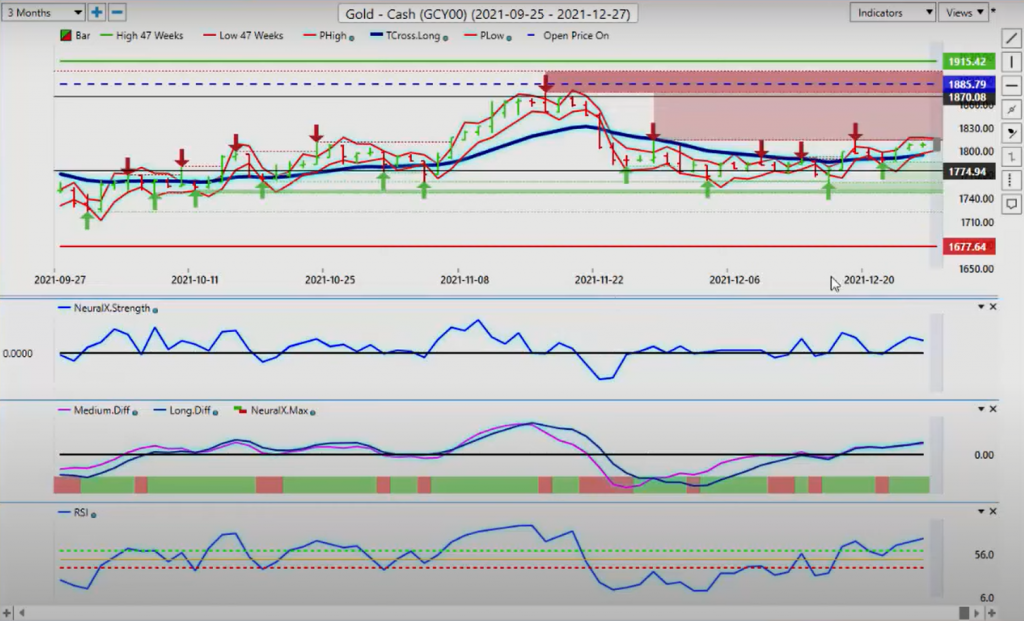
Now, when we look at gold with the dollar seeing some weaknesses anticipated, gold is starting to push a little bit higher. Now we’re moving to the top of the overall range high. 1,813, 1,815. These are big, big levels for gold. You can see that the point in time up here, this purplish blue colored line that has dashes running through it. That is the yearly opening price. That level is again, gold has been very bearish on the overall year. That point in time coming in at or about approximately the 1,885 mark. I would argue a little bit higher 1,902 is what I would use, but that’s close enough to where we want to be. So right now, gold’s still showing that it’s likely to remain somewhat bullish going into year end, but not an awful lot of momentum here. But if we see the dollar sell off, that would absolutely support gold. Our key support level into next week’s trading, our T cross long, 1,795.
That’s where we would look to buy. We’ve got our predicted low for Monday or Tuesday, I would argue Tuesday. Monday for the most part is a holiday. That’s predicted low is coming in at 1,800, so as long as we’re staying above 1,795, everything looks good for the upside on gold.
S&P 500 Index
Now, when we look at the equity markets, more specifically, the broader market looking at the S&P 500, it is important to outline what kind of month the broader market has really had and where you really want to be.
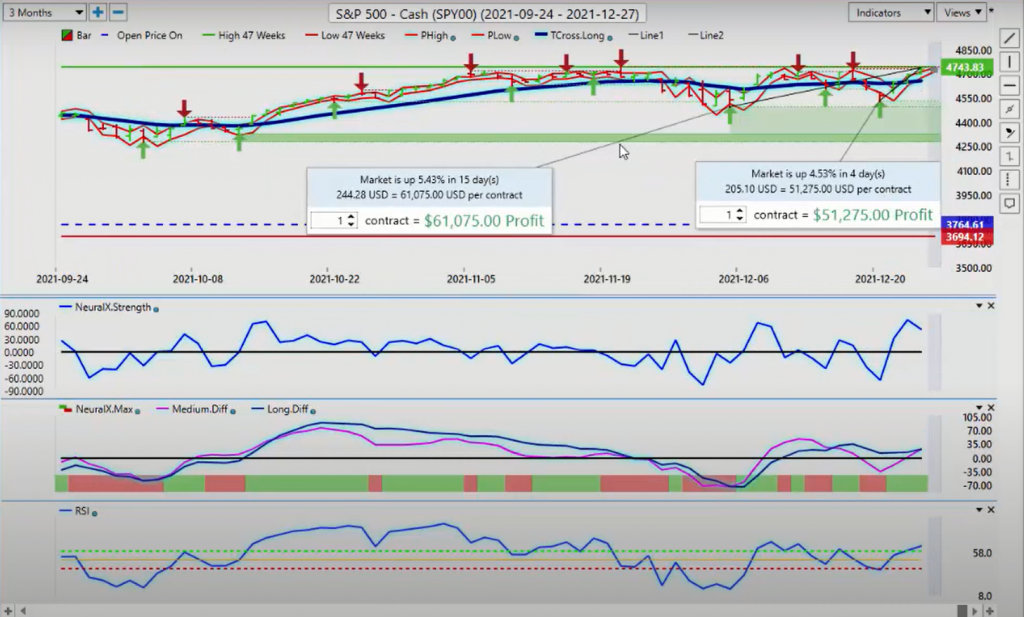
And, of course, that’s long, the S&P 500. When we look at this blue line dash down here, we can see very clearly the yearly opening price on the S&P 500. 3,713. We’re already closing the week near all time highs at 43, near the 4,340 mark. But if we’re looking at the overall S&P 500 for the month of December, we can see that if you just bought and hold at the beginning of December on a single contract, your $61,075. On this recent retracement that I’ve clearly outlined in last week’s AI weekly outlook, that we would be buyers on a dip between the 4,530 mark and the low verified zone at 4,495.
We came right into that zone and we’ve had a very significant rally of 4.5% off this. But when we look at the volatility, the volatility in the broader markets has actually been rather low. I think a maximum about 5.25% from the November high, than we bottomed out at the beginning of December, and we’ve had multiple rallies here. Now, again, this is on a full contract. So when we look at the broader market, it’s important to understand that a lot of these smaller stocks or a number of the broader stocks are dependent on the actual broader market, like the Dow Jones, the S&P 500, the NASDAQ. If they’re healthy, then your individual stocks will be healthy also, but we never want to ignore the broader market in the month of December, because these trades are somewhat of a no brainer staying long with the overall primary trend.
Now, if we look at, we don’t want to go to the main contracts. We can go to the S&P 500 minis. Those same single contracts, if you just bought in the beginning of December, and you stayed in this until where we are now, anticipating the Santa Claus rally, which is clearly in play here, you’re picking up 12,600. If you bought the dip that I suggested to buy in last week’s presentation, you’re picking up almost $11,000. Now, for the smaller trader or the average investor, then there’s enough meat on the bone here, guys, with equities in the broader markets for everybody. First of all, it’s important to understand that the markets were not overly volatile. They dropped about four and a half to 5%, but over a nine or 10 day period guys, that’s only a half a percent per day.
That’s less than the average daily trading range. So when we look closer at this, the S&P 500 micros, which is a mere $5 a point, if you traded nothing all year long and you picked it up long in the month of December, you’ve done 1,200, almost $1,300 profit. On a $10,000 account, that’s a 13% return with virtually zero risk that you can then add to that position on the dip from last week’s presentation on a single contract, you’re picking up almost $1,100. So once again, it’s important to understand that the broader markets, the smaller stocks, are dependent on the broader market being again, bullish, which so clearly they were in the month of December. And clearly, that is the place to be in the broader market. So I would anticipate some further gains going into year end on the S&P 500 and the broader markets, but they’ll be minimal likely until we get into the new year.
Now also stated in our last week’s outlook, that if the equity markets turn around, or if oil turns first, the other one will follow. So we can see the chart on the S&P 500 and the chart on the light suite crude oil is almost identical. This is the basis of inner market technical analysis, guys. So when we look at, as predicted that the equity markets would turn this coming week, oil turned on the 20th with it. If we cross reference that to the S&P 500, we can see that it’s the exact same trade here, guys.
Crude Oil
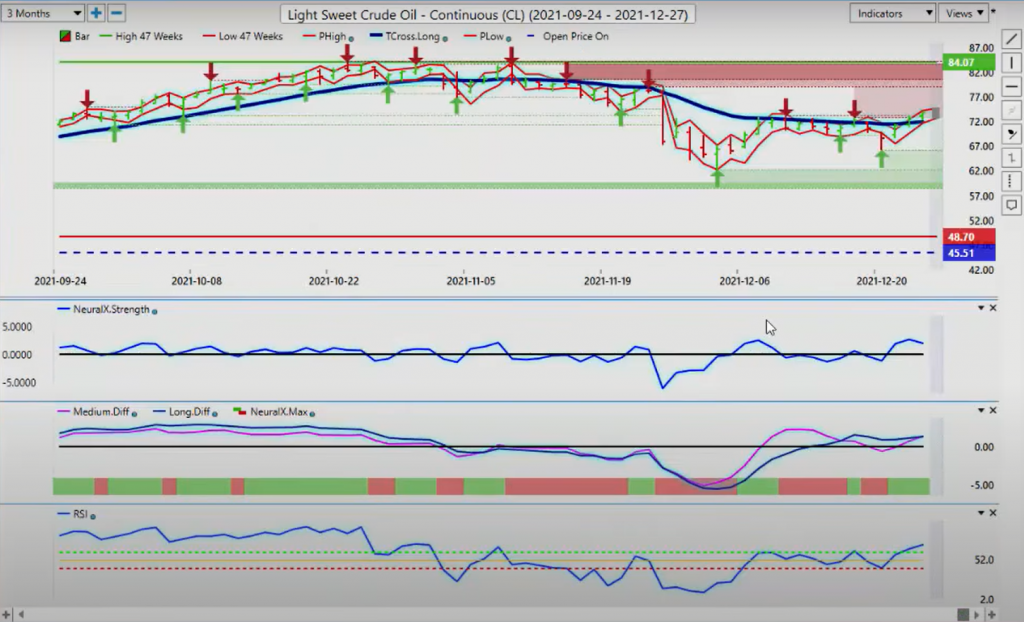
So not only can we make money on selling U.S. dollars, we can make money on buying equities, and we can make money on buying oil contracts if we know and understand these correlations. There’s zero lag in an intermarket correlation, guys. When the trading bell goes off, we can see it and we can trade it if we understand these intermarket correlations and understanding what real volatility looks like. And this is not real volatility, guys. This is minimal. Like I said, again, less than 5% over a 9, 10 day period, only for it to turn around and go up and make new highs yet again.
So oil will continue to advance as long as equities do. Now, we’ve closed above our T cross long, that level coming in at about 7,192. That represents our support level for Monday and Tuesday of next week. Our VantagePoint predicted low for the day is 7,273. So we identify our buy zone between 72 again, the low, the predicted low, which is coming in at 7,273 and our T cross long at 7,227. So all of our support is sitting right there. Now, once again, Bitcoin, when I’m doing this presentation, still hanging in there, guys. As the broader equity markets recovered, once again, on the 20th, you can see Bitcoin flattening out on these same verified zones that we leveraged to get long the S&P 500 yet again in the month of December for the second time.
Bitcoin
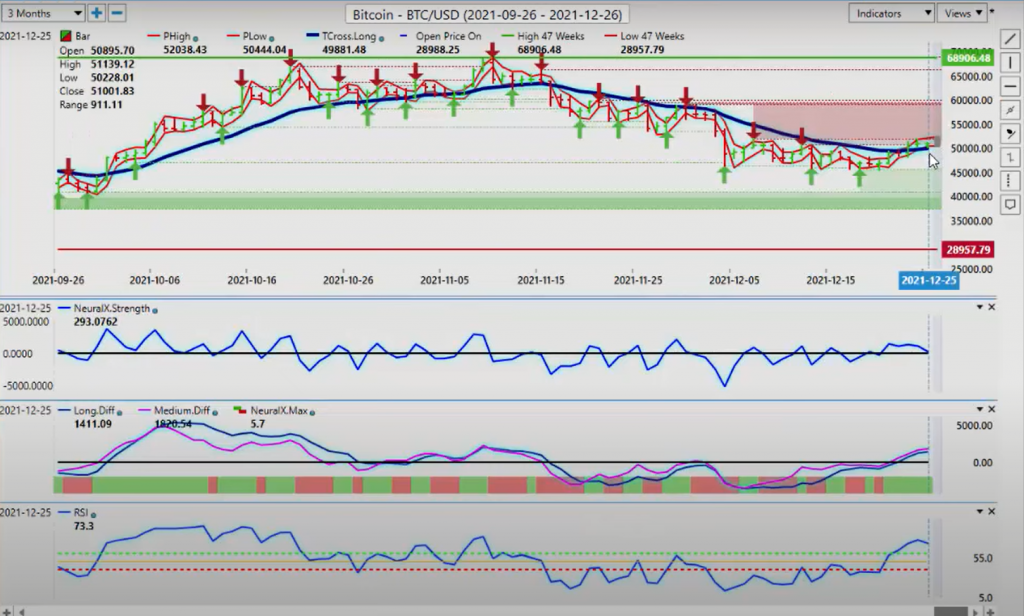
When we look at the same thing for Bitcoin, Bitcoin following that inner market correlation to the S&P 500. As we start basing out, as the S&P 500 rises, you can see that Bitcoin is doing the same thing. Our main support now for Bitcoin going into trading next week is 49,881. We have our VP predicted low. That’s coming in at 50,463. So we look for long trades in that particular area. Our indicators still look pretty good. They’re flattening out a little bit based on Friday’s trade, but again, we are going to have thinner, more liquid markets, over the Christmas holidays. In my respectful opinion only, trading is mostly done for the year, but there will still be some opportunities going into January 1st. Now, when we run through some of our main 4x payers, once again, it is important to understand that the Euro has a very high correlation to gold, and the dollar index inversely.
Euro versus U.S. Dollar
So if the dollar index is moving low and gold’s moving higher like it’s been doing this past week, that’s actually bullish for the Euro currency. Now, I don’t think we’re going to see a major breakout, but I would anticipate a retest into year end towards the 113.80 mark. Now, the key thing is we want to try and hold above this VantagePoint T cross long, that level coming in at 113.04. Our predicted low to begin the week is 112.83. So it identifies again, our key level. Now, what we also look for is momentum. If the Euro U.S. is going to sell off, then we would look for momentum. Now, that was also something mentioned in last week’s weekly outlook, that the RSI was not breaking down and closing below the 40 level. And I had suggested last week, there’s no downward momentum here.
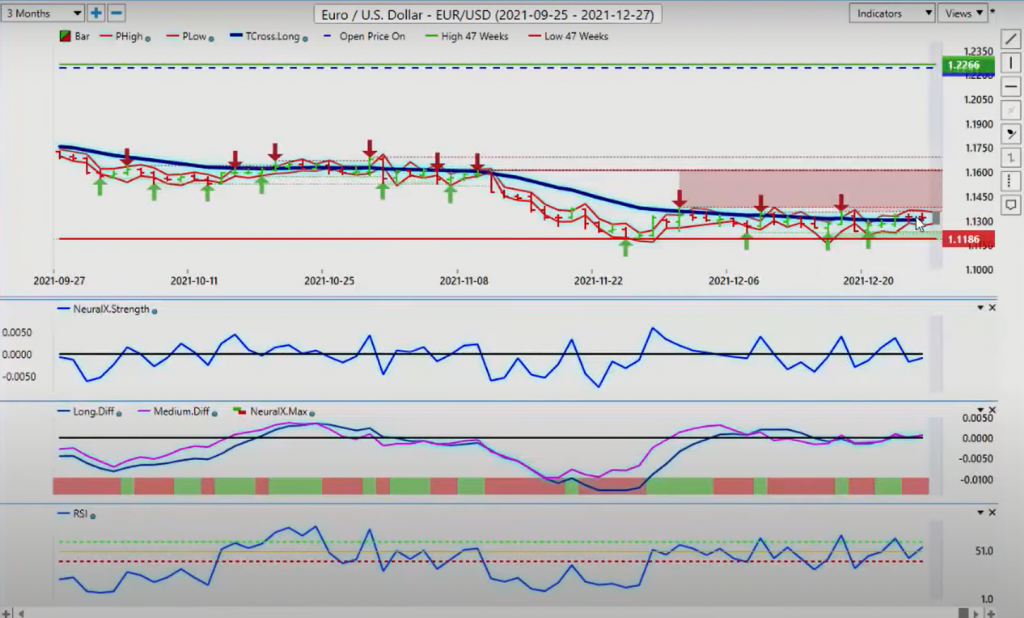
So, the same thing was present with the Euro currency. We tried to push down below this, but even if you take your predicted RSI, and I certainly would recommend doing this, you can actually draw a trend line inside your RSI. So I’m looking, if this is a true move to the downside, I would look for the predicted RSI to break down below that particular level of 32.8. But as you can see, that’s not what happened. And we started to move back up. We have a reverse check mark on the neural strength and a reverse check mark on the predicted RSI. So I would look for the Euro to potentially make some gains next week, but not a lot. When we look at the pound dollar, it’s been on the move this week. We’ve had a nice, clean break. This could be considered a leading indicator, potentially, for the Euro U.S. paired.
British Pound versus U.S. Dollar
So to trade the pound dollar next week, our T cross long 130,293. We’re holding above that level. But as you can see this line up here, our point in time is set at the yearly opening price. 136.65. The pound dollar is still bearish technically while below that level, because it’s not making any gains on the year while below 136.65. So if you bought the pound dollar on January 1st, 2021, then at the current, and you’re holding that position, you are, in technicality, you are losing money still. So again, the yearly opening price is something we always want to keep our eyes on here because, right now, what’s very ominous about this and the power of the neural index, when combining it with the neural X strength, you can see that that’s sloping down and we’re pushing below the zero line. The neural index has gone from green to red, and our indicators are starting to go sideways a bit.
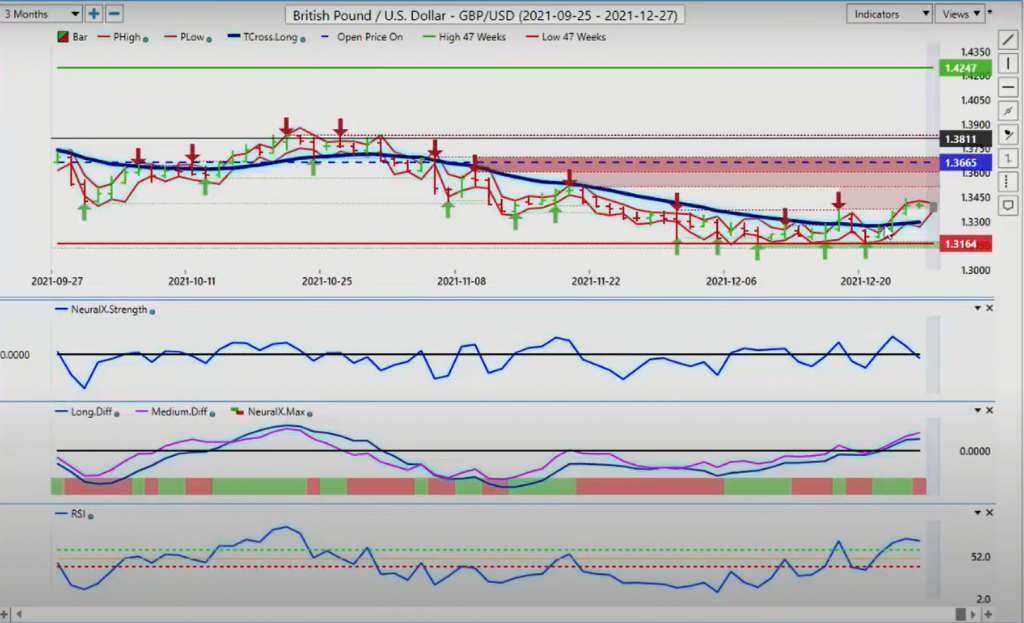
Now, we do have a significant verified resistance high. That’s coming in at 135.13. I would be very cautious around this particular area for a reversal back to the primary trend, which is clearly to the downside.
U.S. Dollar versus Japanese Yen
Now with dollar yen, I believe that this could be one of the few places where the dollar could still make gains going into year end. The dollar yen is usually bullish in the first quarter on dollar strength. And again, we are still looking with the dollar index for dollar strength going into the first quarter. That would suggest that the dollar yen can still make some upside gains. When we look at where we are near the end of the year here, the yearly opening price down here, 103.17, the dollar yen having probably one of its best years in many, many years. But it did come off to a rocky start.
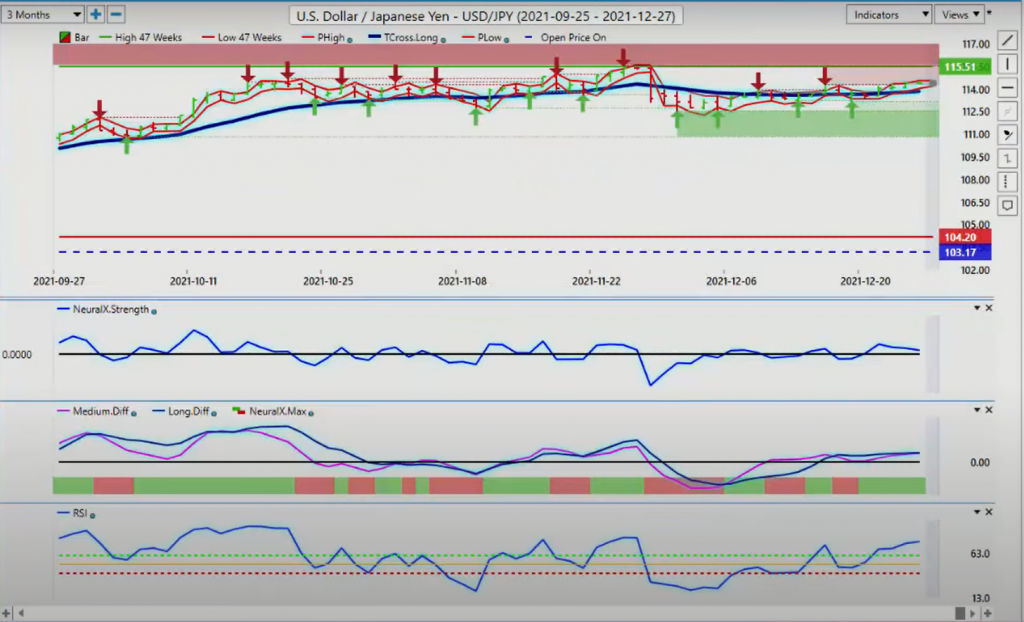
You remember the Bank of Japan talking about intervening, protecting the 100 level. They didn’t have to do that. We’ve moved up considerably from that. But right now, we’re more or less just sideways. We’re running along that verified resistance high. That’s 114.26. We need a clean break of this, guys, if we’re going to get a shot back at the high of 115.51, but we must clear this level first. Now, if we’re buyers of this, we can say, okay, well, our T cross long is 113.84. We’re going to stay long while above that key support level provided the VantagePoint indicators continue to support those long trades. Now, with the U.S. Canada, once again, we’ve done this the last two weeks in the VantagePoint live training room, and believe it or not, we’ve had the exact same short trade both times, off of the verified resistance high that was coming in at about 129.50, 129.36.
U.S. Dollar versus Canadian Dollar
But as I outlined in the VP live training room that we trade this based around the S&P 500. We were forecasting the S&P 500 to continue its up trend this past week. That means the Canadian dollar, the Aussie dollar and the New Zealand dollar will all respond very positively to a move back to the upside on the S&P 500. That absolutely came to fruition. And U.S. Canada dropped hard. But it stopped for the second week in a row at the exact same level, the T cross long, 127.91. We’ve got our ma diff cross still pointing down, but we’re starting to slope back to the upside on the neural index strength. So that’s a little bit concerning, and what’s also concerning, just like what I showed everybody last week, using that predicted RSI to gauge accumulation distribution, to gauge momentum in the market.
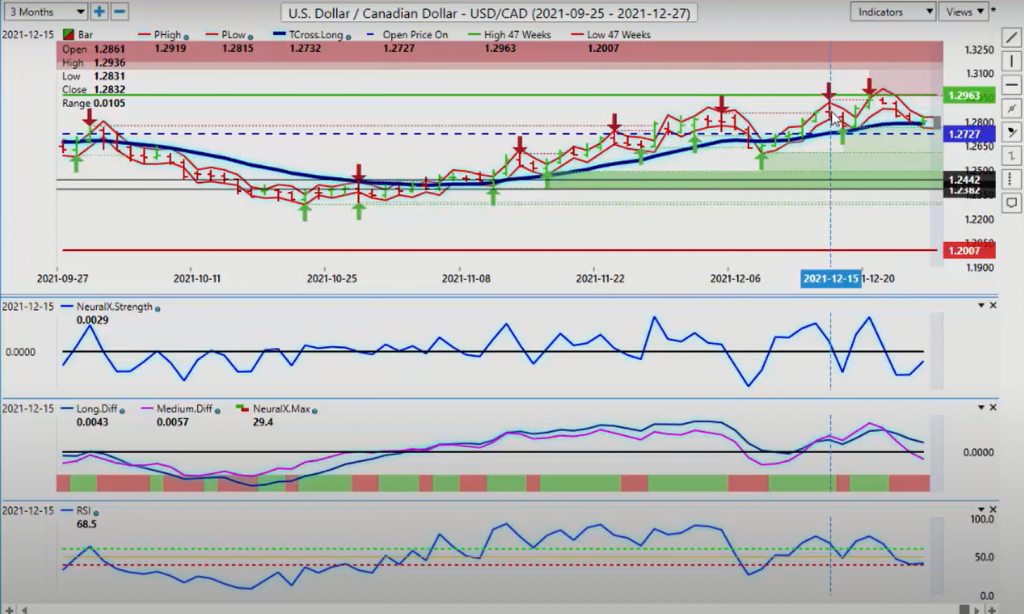
All of these different are divergence, but mostly just momentum. So right now, you can see that U.S. Canada has dropped hard from the beginning of the week, but the predicted RSI is flatlining along this 40 level. And that’s the benefit of using a 60-40 split with your VP software, because this is warning me saying, we may have a problem here. We may not be able to break down below that. And the point in time is 127.27. That is the yearly opening price. Now, what I mean by the yearly opening price for people that are not sure what I’m talking about, that’s where this 4x pair opened at the beginning of the year, and we’ve come right back to it. So whether we can hold above this is going to largely depend on whether stocks can continue higher.
But right now, I think either way, 127.27 holds as we anticipate dollar strength by the middle of January.
Australian Dollar versus U.S. Dollar
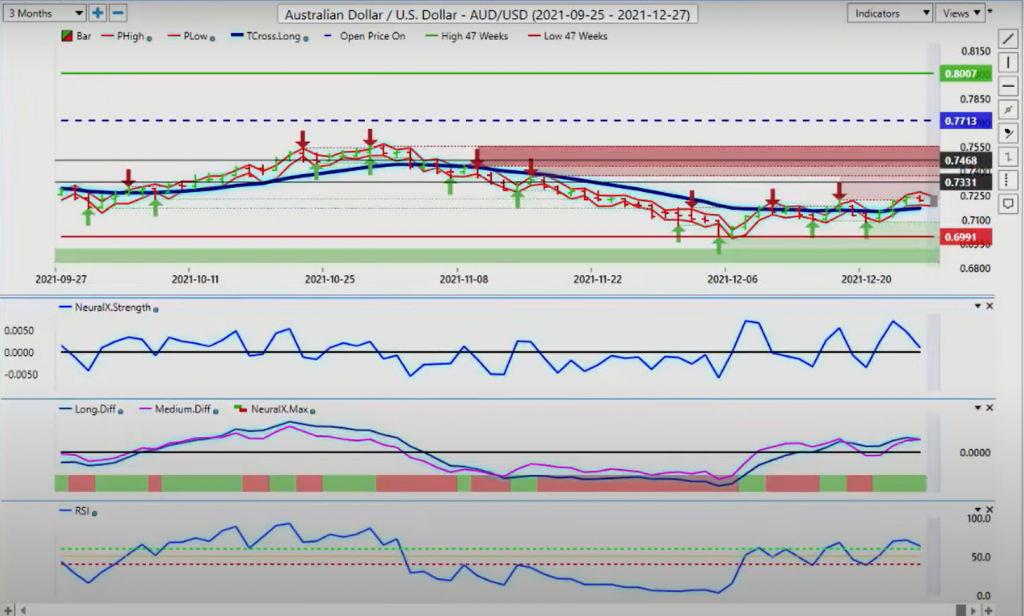
The Aussie U.S. and the New Zealand U.S. mirror the U.S. Canada, just inversely. When the equities go up, U.S. Canada goes down, Aussie U.S. and New Zealand U.S., they go up. So we’ve had a good move and you can see the exact same date that the S&P 500 turned around. So did Aussie U.S., guys. Again, you can’t script this thing. This is the benefit of looking at an outlook versus a recap of something that already happened that we can say, okay, if stocks do this, then we are prepared to buy the Aussie, despite how negative the market is on the Aussie, the New Zealand, and even the Canadian dollar for that matter. But it doesn’t matter, guys. They follow stocks. So the second the S&P 500 turned around, you can see that the Aussie did the same thing.
We again did this in the VantagePoint live training room. Our T cross long, 7,172, is now our key support going into year end. If we’re going to continue with longs, we need to hold above this level, and stocks need to remain above their key level. More specifically, I’m going to gauge the broader stock market by the S&P 500. It’s the easiest way to do it. It’s not the most volatile of the equities, like the Dow Jones, the Nikkei. These are very, very volatile indexes, where the S&P is slower. It allows me to gauge the health of stocks. So right now, stocks are fairly healthy, but we need to get moving here, guys. And we are below the yearly opening price at 7,713, but it does look like we’ve got more gains ahead for the Aussie providing stocks remain firm.
New Zealand Dollar versus U.S. Dollar
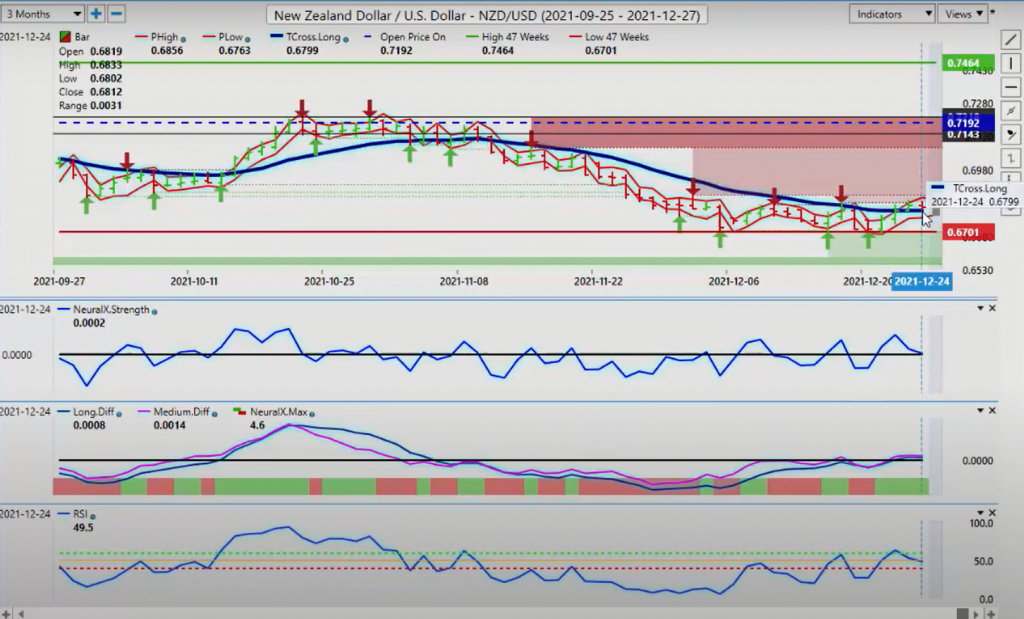
The same thing here, guys, is going to apply to the New Zealand dollar. You can see that we’re, maybe I could argue that we’ve got better value buying the Aussie, because we’re closing the week right on the T cross long. 6,799. We’re closing the week at 6,812. We in theory could have a long rate out of the gate on Sunday night, but remember, the markets are going to be thin any liquid this week. We’ve got a bank holiday on Monday, so I would not be looking at doing any real trading until Tuesday midday at the very earliest. And we want to make sure we’re not getting tangled up in big market, in gaps in the market open in the 4x in the futures, and even the stock market. So with that said, this is the VantagePoint AI Market Outlook for the week of December the 27th, 2021.

