


Welcome to the Artificial Intelligence Outlook for Forex trading.
VIDEO TRANSCRIPT
U.S. Dollar Index
Hello, everyone, welcome back. My name is Greg Firman, and this is the VantagePoint AI Market Outlook for the week of January the 10th, 2022. Now, to get started this week, we’re going to begin where we always do, with that very important US dollar index. Now, the indicators, again, we’re going to be using this week, we’re going to be using bars, not candles. Our predicted short, medium, and long term difference are a very strong, powerful indicator, our neural index. The point in time, which is very relevant at this time of year, we’re going to be setting that to our yearly opening price. The predicted RSI to gauge momentum in the market, our modified triple EMA cross, particularly effective at this time of year, as we’re really trying to weed out the fake pricing before we get into a trending move, and of course, the very popular verified support and resistance zones. So, as we look at the dollar, the dollar’s struggling after that nonfarm payroll number. Now, in my respectful opinion only, guys, an excellent number.
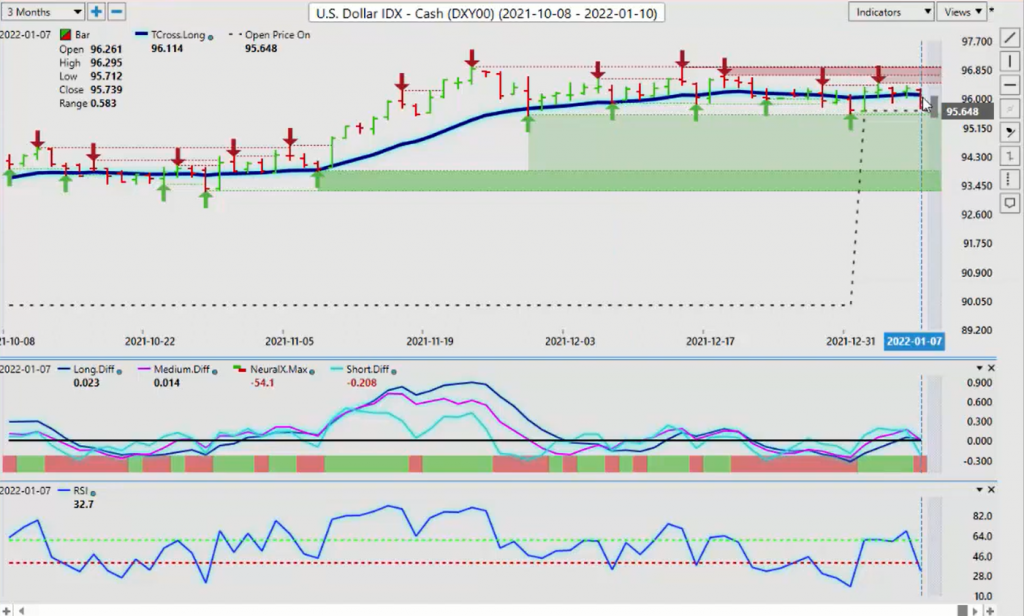
Even though it didn’t meet the U3, disappointed, the unemployment rate and the U6 numbers were rock solid. So, I believe that we’re following a normal seasonal pattern with the dollar, that it will be a little bit soft until about the third week of the month. In February, we will see a known seasonality of dollar strength. So, when we look at our yearly opening price right now, our point in time, 95.64. This is the level we want to watch very closely. I could even argue, in a number of different markets that I’m going to talk about here today, that we’re basically looking at this one bar from the end of November, that we’re really caught in this range between the high of 96.64, and the lower side of that at 95.51. In my respectful opinion, we are still in this channel, but that channel is likely going to break. What I’ve seen in years past is the initial move is lower, but that’s been a fake move, and then we have the seasonality of the dollar at the end of January, where ultimately, it goes higher either way.
Now, our neural index is down, our predicted RSI is showing we have momentum building to the downside. But once again, in thin and liquid markets on Friday trading, I honestly believe that the market is not looking at that entire labor report, it was actually very solid. So, for now, we’re caught at the bottom end of this channel, and we’re sitting below our T cross long 96.11. If and when we get back up 96.11, that will trigger further dollar strength. But again, in my opinion, we’re still a week or two away from that, but it certainly is coming. Our neural index is down, so what we’re looking for is to stay above the yearly opening price, our point in time, until such time as that dollar rally is going to begin. Now, when we do a comparative analysis to gold, this indirectly using the intermarket correlation supports what I’m saying about pending dollar strength here.
Gold
Now, we know that the Fed is talking about raising rates again sooner, maybe two hikes, three hikes. We’re not really sure, but either way, gold is obviously not responding very well to that.
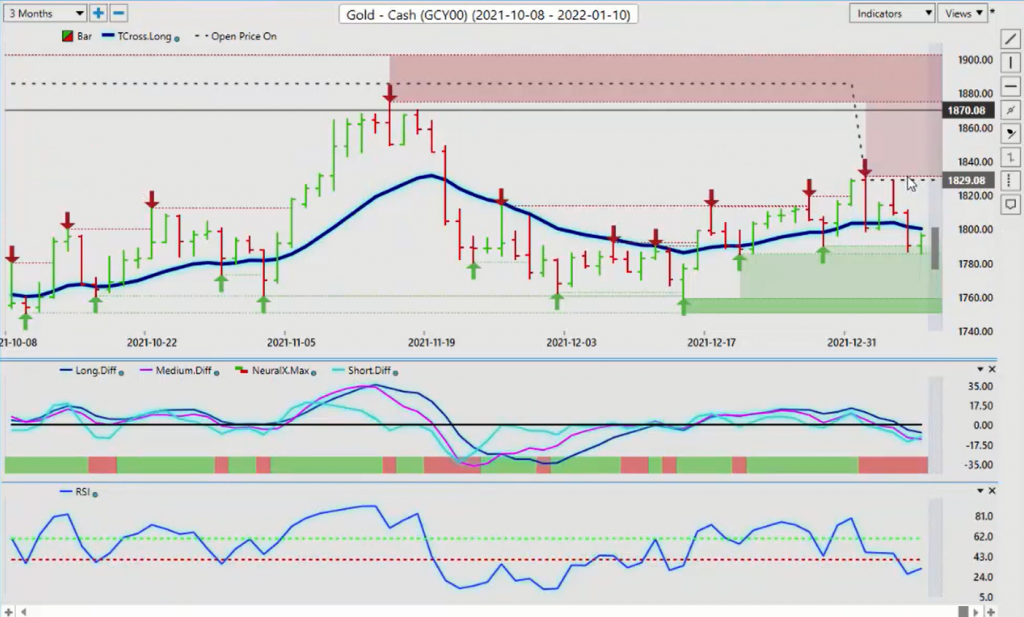
Now, I don’t view gold being down and out here, because I believe that basic metals are going to have a pretty decent year in 2022. That could help support gold, but gold really does benefit from a risk off scenario, and it’s debatable whether we’re going into that, it looks like the economy’s doing well. The unemployment numbers out of numerous countries are improving. So, for now, once again, gold remaining below that yearly opening price, the key level that we want to watch at this time of year, on that point, that open on price or yearly opening price is 18.29. So, the theory here is we’re bearish while below this level, and we are additionally bearish while below that T cross long, which is now at 18.00. So, the easy way for us to look at this is gold remains still in a down trend that’s spilling over from 2021 into 2022, we’re short while below 18.29, and more specifically, the key vantage point level at the 18.00 mark.
But, I believe that this level will be challenged, and possibly, we will get a breach of that prior to that dollar seasonality towards the end of the month.
Crude Oil
Now, when we look at light sweet crude, I’m going to do this one first instead of equities, oil remains very strong, the energy sector in general remains strong. Starting the year off, we’ve got a little bit of a seasonality there, but we’re above our yearly opening price, and we’re above our T cross long. Now, what I really like about this particular setup is that the yearly opening price is intersecting with the vantage point T cross long at 75.75. This makes this an easier trade, not that trading is ever easy, but the way we can play this is we can stay with the primary trend, which is up, buying off that 75.75 level, or we can buy it with a relatively tight stop loss, and have a sell order ready to go just below 74.27.
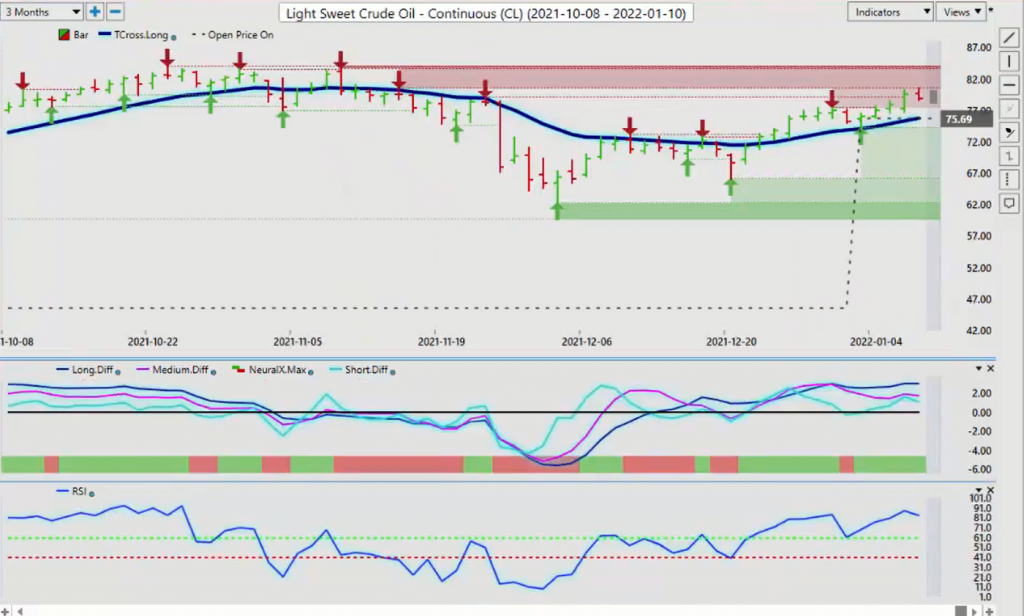
Meaning, that if we break below our T cross long at 75.75, and we break down below this verified zone, then we would look to short this market immediately. But, for now, once again, all of our support is sitting at this particular level. Now, the vantage point predicted low to start our trading week is 78.18, I believe we’re going to come lower than that on Monday, and then we’ll recover on Tuesday.
S&P 500 Index
But, when we do a comparative analysis between that and any one of your S&P 500 contracts, the major contract, the SPY, or you can use the micro or the mini, whatever suits your personal account. When we look at this right now, one of these two is wrong, either oil is going to continue to advance, and the S&P is getting ready to recover, starting as early as Tuesday of next week, or that price and oil is not a true price, and oil is going to crash down below that.
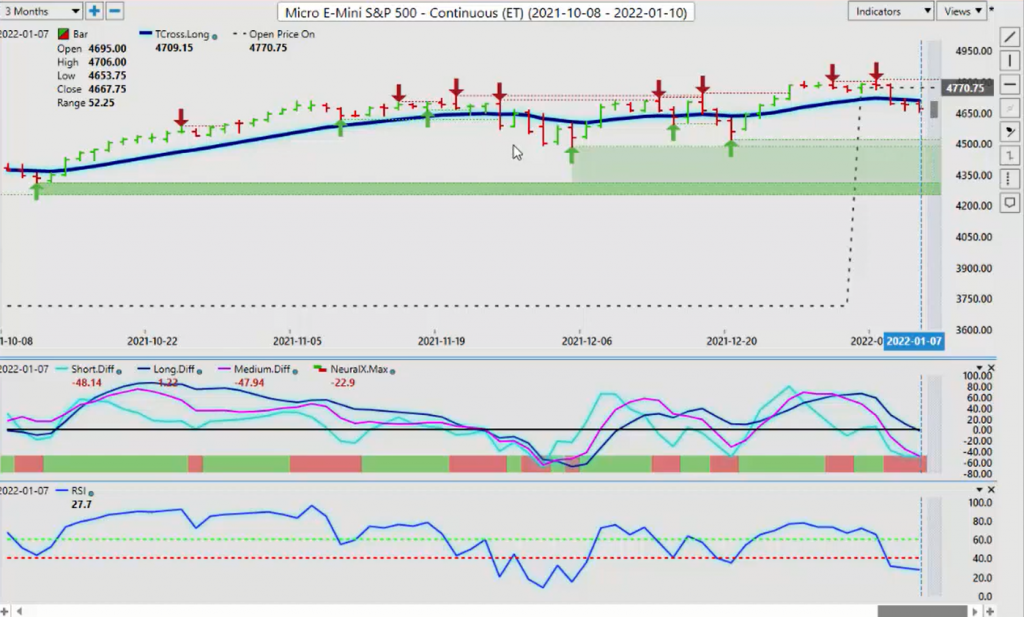
So, if you’re trading the S&P 500, keep a very close eye on those oil contracts right now, or at least for the last several months, we’ve only been able to hold below the vantage point T cross long for about five or six days here, guys. We’re three days in here now, but again, we still remain in this overall channel dating back to the end of November with that low coming in at 44.85. We were buying off this just a few weeks ago off of this low at 45.20, so I could see a push, a single push down towards this 45.20, if the S&P 500 is going to remain firm in the first quarter, then we need to hold above this particular level. Actually, not even test it at 45.20, we need a bounce before the 45.20 level. Now, again, in my respectful opinion only, the bar is being set awful high here for the S&P 500. I was actually looking for a deeper pullback at the end of 2021.
That way it would set the bar a little bit lower, but our point in open price time, or our yearly opening price is 47.70. That is a very tall order when we’re going into interest rate hikes, and but the economy is recovering. There’s a number of sectors that are going to help support the Dow, the S&P 500, the Nasdaq. So, again, we’ll continue to monitor it, but for now, 47.70 shorts carry a slight edge while we’re below that level, and we have our vantage point T cross long at 47.09. So, again, in simplified terms, our current resistance starts at 47.09, and it goes all the way up to the yearly opening price at 47.70. If we’re going to get really long this thing, I would prefer to be above 47.70, but at the very minimum, I need to be above 47.09.
Bitcoin
Now, Bitcoin, not coming out of the gate very strong, perfectly normal here, guys, keep a very close eye on Bitcoin, and the ETH, Ethereum.
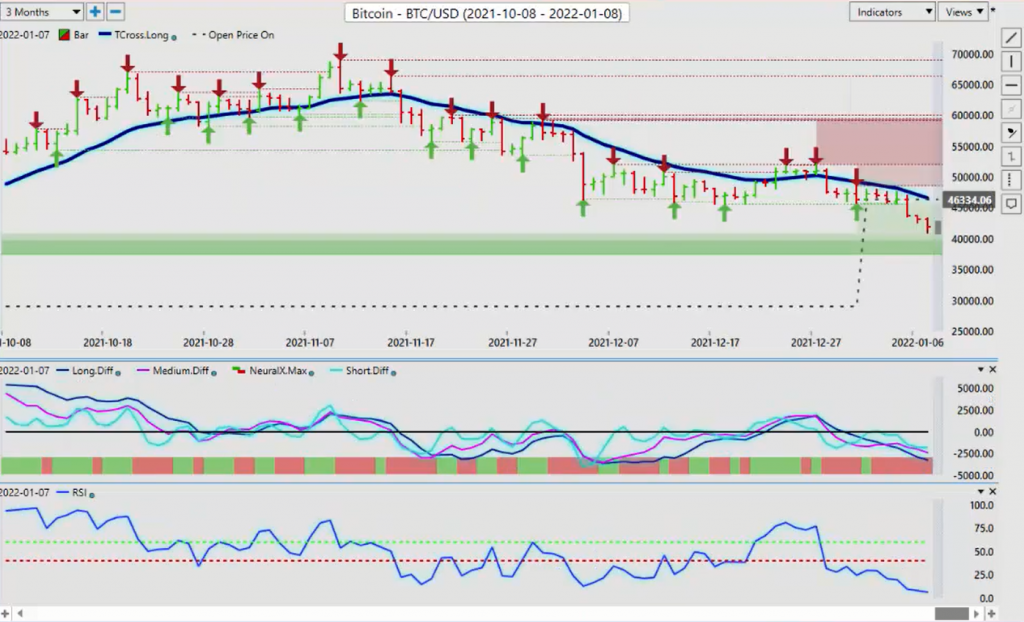
I think both of them are set for another strong year, but if we look at this from a seasonality standpoint, believe it or not, Bitcoin has at a very high inner market correlation to both the S&P 500 and the US dollar. So, that could tell me the S&P and the dollar are going to move lower until towards the end of the month, they recover. But when they recover, Bitcoin… So, there’s multiple traits spinning off of this analysis that we want to keep our eye on. We can see last year at this time, we bottomed out, again, right around the end of January, and then we had one heck of a rally off of Bitcoin. I am absolutely looking for the same thing here, guys. So, be patient, we’ll keep an eye on this, but when we bring it out over the broader market here, we can see we’ve got very good support down at this 40,000 mark, maybe even a little bit lower 39,700.
So, keep an eye on this area, very close, and we’ll be monitoring the key vantage point indicators for a turnaround and when to get long on this. But, in my respectful opinion, again, only I think we’re, again, two or three weeks away from a long position on Bitcoin.
Euro versus U.S. Dollar
Now, when we look at some of our major Forex payers going into next week’s trading, if we can get that recovery, at least for the month of January or the better part of January, in gold, that will help push the Euro higher. But the Euro, again, finished the year very sneaky once again, that it rallied all the way up to this key level. Our yearly opening price now is coming in, or our point on open price, 113.67. So, we need to get above this level, guys, and stay above it. But we have a very pesky verified zone, multiple verified zones, I might add, sitting around this 113.60, 113.80 level. So, we’ve got to breach this if we have any shot whatsoever of getting back towards this 116 area, but it seems to be a very tall order at this particular time.

However, we do the predicted RSI breaking above the 40 level, we’re holding above our T cross long at 113.15. Again, this is a weekly outlook, not a quarterly or monthly where I can already basically tell you where I think the Euro is going at the end of the month. It’s going down hard with that seasonality, but, again, we’re several weeks away from that known seasonality. So, right now, if we can break through that yearly opening price, then the Euro should be able to take a run at least towards the 114 level, but it’s on borrowed time, in my opinion, because of what I’ve seen in the first quarter, based around that US dollar strength. So, again, we’ll monitor these indicators, but still a slight bearish tone to this, but the initial move is likely to the upside.
U.S. Dollar versus Swiss Franc
Now, when we look at US, Swiss Franc, once again, when that dollar starts to recover, or this could be considered a leading indicator for the dollar US, Swiss Franc. Now, again, our verified support load 91.08, our yearly opening price is 91.09. All of our support is sitting down here.
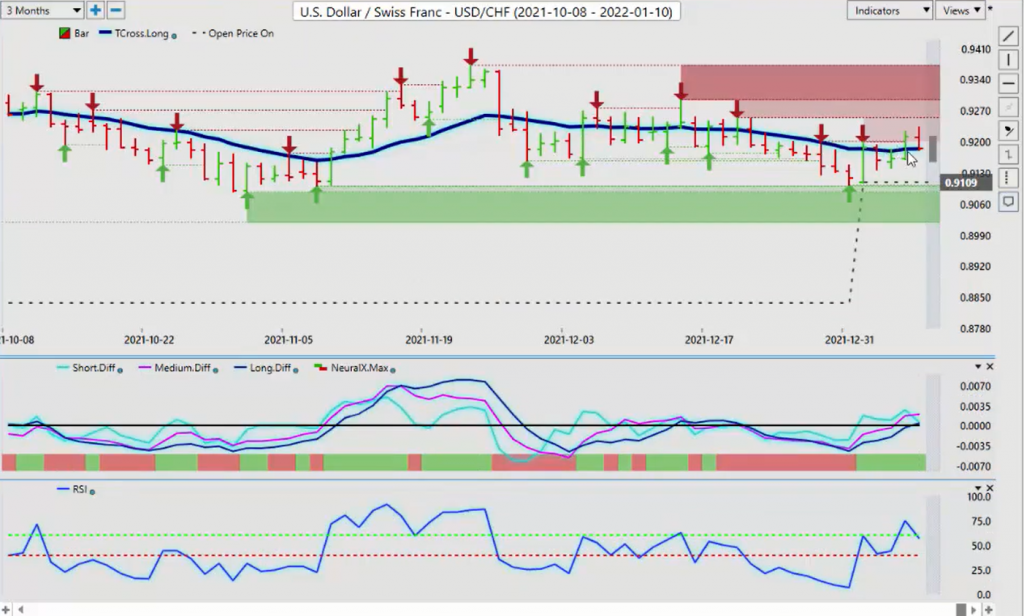
So, if we’re looking to go long, we want to wait for it to come down into this particular area, which I think could be as early as next week. So, if we’re getting that moved down, the yearly opening price is holding. We have a period of known dollar strength towards the end of the month. That’s what we would be looking for. Our immediate indicators, however, are still bullish. So, this could indirectly be warning us that the dollar is getting ready to get into that seasonal move early. The predicted differences above the zero line, but our reverse check mark and our predicted RSI, we’re losing our upward momentum.
So, our corrective move, this could be it from Friday, but I think we’re going to come down a little bit lower and we’ll monitor it once we get it down closer to this 91 level. Now, the British Pound, this move is already underway here. It was starting to make its move towards the end of December.
British Pound versus U.S. Dollar
I had shown this in the vantage point, live training room with the seasonal pattern, how it looks and basically Great Britain. The British Pound tends to follow oil. And I believe that, that’s what’s pushing the Pound. Now, our price on open here or again, the open price is the yearly opening price is the way I’ve set the VP indicator to that’s coming in at 135.31. So, this is a big level. Now, another strong methodology that I fully support is of course, mean revision.
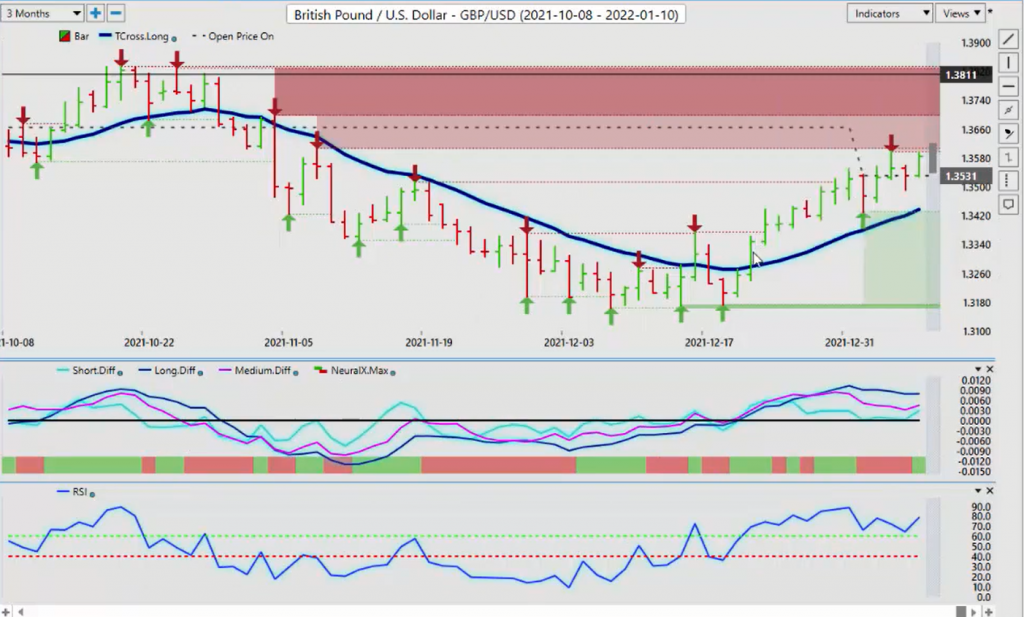
So, we’re pulling away from the vantage point T cross long. And here’s a potential scenario that I’ve seen with this British Pound, because it’s often follows the Canadian Dollar. We get a big pullback or a big drop on Monday. And again, our T cross long is 134.36, and then mysteriously on Tuesday, it goes screaming higher. This is what I have seen more often than not. And usually we’re in complete contact. Now, if I click on the F eight in our VP software, we can and fine tune this using that long predicted or our long term crossover with just the predicted moving average by itself. So, that level’s coming in at 35.21. And that is absolutely intersecting with that yearly opening price. So, 35.21, that doesn’t look like a bad area to start. Your trading are predicted low for Monday, also 135.40.
So, a lot of support sitting down here, but I’m a little cautious with that after the non-pharm payroll number that we don’t get one more bout of us dollar strength, and then the dollar goes kind of soft for a few weeks. So, why this level very closely just make sure that all stops are below 1 34.30.
U.S. Dollar versus Japanese Yen
Now, the dollar Yen, unable to really hold any gains up here. And again, this could be warning us that we’re getting ready for a deeper corrective move on the S&P, but in order for that, we need the dollar Yen to break down below the T cross long at 114.96, our yearly opening price. That’s now coming in at 115.09. So, all of our support is sitting right here. If you want to, if you’re so inclined to stay with the prime primary trend, why we’re above the yearly opening price and we’re above the T cross long, I would respectfully submit that this can again be played in two different ways.
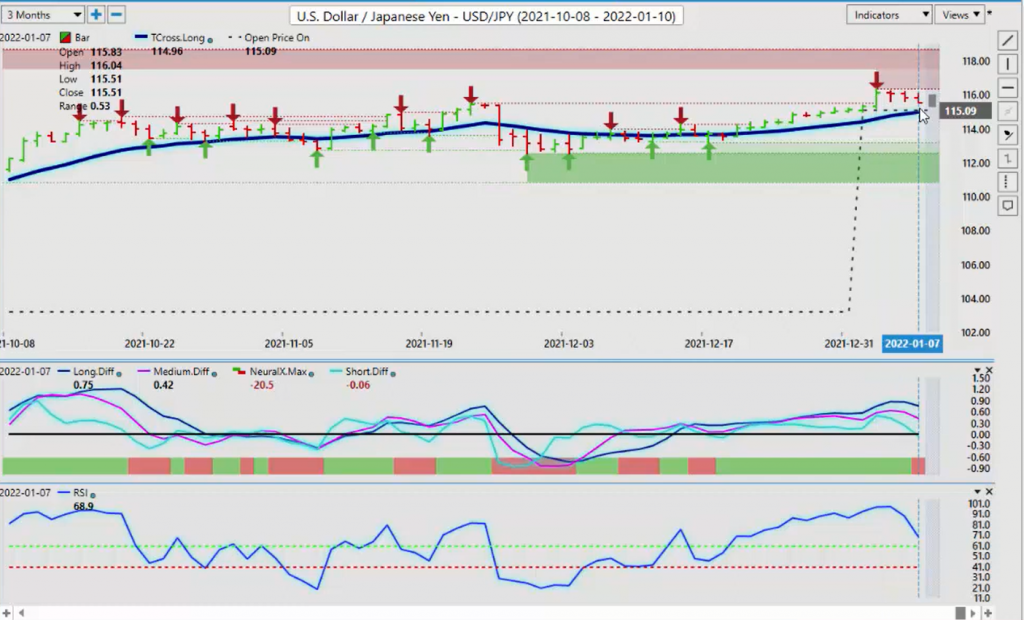
We can buy and stay with the primary trend. Then we could have a stop loss about 30 pips below the T cross long and a sell order ready to go. Because again, looking at the seasonal pattern with dollar Yen, I would argue that would be more towards the end of the month when this particular pair rallies. But again, we, this is a weekly outlook, not a quarterly or even a monthly. So, the immediate week forward, we identify these key support and resistance levels. And then we kind of straddle them to some degree where it doesn’t matter. You can take whichever side of the trade. You would like you could be a strong dollar Yen bull. I’m not going to argue with that. Absolutely. You can go with that, but you could also be a strong dollar bear, and I can give you an alternate strategy to use with that by straddling this critical level.
Now, again, the indicators are a little overdone, so a corrective move down to the T cross long at 114.6, 114.96, excuse me. I would argue that that is almost a given at this particular time. And then we can decide which way we want to go from there right now. Very concerning to me that this long period of green, which is up means up in the neural index has just turned to red. But again, I honestly believe they’re misinterpreting that payroll number. When I look at the drop in the unemployment number and the U six that’s pretty much tells the tail of the tape for me. And I believe that COVID is causing these price distortion in that labor report.
U.S. Dollar versus Canadian Dollar
Now, the Canadian Dollar here, this one’s kind of comical guys, anybody that’s in the VantagePoint live trading room. They know that we’ve done this trade on us, Canada in the same trade.
Believe it or not every Monday for the last three or four weeks, two things we’ve applied to the trade in the live training room. Number one, my all time favorite mean revision, absolutely a hundred percent endorse mean revision. Meaning the further we move away from the vantage point T cross long, the more likely it is we’re going to retrace to it. Right? The other methodology we used that we used on Monday of this past week, just simply selling into the T cross long while it holds. And very often, this is what we see a breach above it, but you’ll notice never seems to close below, above that level. So, starting next week, I would argue the same thing. We identify the T cross long 127.43, we’re saying, okay, we’re going to sell into that level because oil is very strong, but stocks are not as strong.
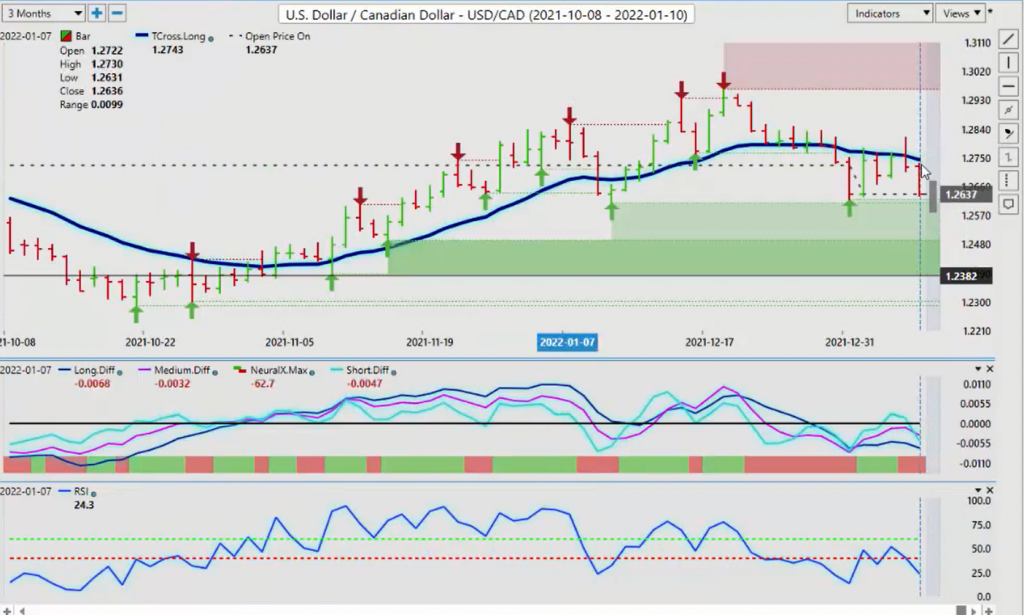
That the S&P is not as strong as what I would like. And it, the Canadian dollar is a very high correlation to that. That meaning if the S&P 500 goes down, usually US, Canada goes up, but energy prices are strong and the CAD really does respond well to that. So, we would stay with the primary trend. And in this case, I would’ve a stop reverse, ready to go just above this particular bar, that high 128.13. So, I would sell into the V stay with the primary trend, but you’ll notice this is where this analysis is very different than most, because you can see that yearly opening price, the open price on 126.37. So, we are caught right now between the vantage point T cross long and the yearly opening price. If the US Canada is going to go into a down trend for the first quarter, then it needs to get below 126.40 and stay below that.
And I believe that’s got its work cut out for it to some degree, we’ve got a verified low sitting at 126.08. So, again, this all goes back of the end of November, right? So, we’ll monitor these levels, but very cautious on a Monday selling US Canada in this lower quadrant, because I could almost guarantee you something, what US Canada often does it, whatever it does on Monday, it often does the exact opposite on Tuesday. So, if there’s a big down move on Monday, it’ll probably go up on Tuesday. But if there’s a big up move on Monday, then you can pretty much take a short to the bank on this one. Like what we’ve been doing in the live room.
Australian Dollar versus U.S. Dollar
Now, the Aussie in the New Zealand for next week. Once again, they’re struggling along here, but we’re basically still running in that same channel from the end of November here.
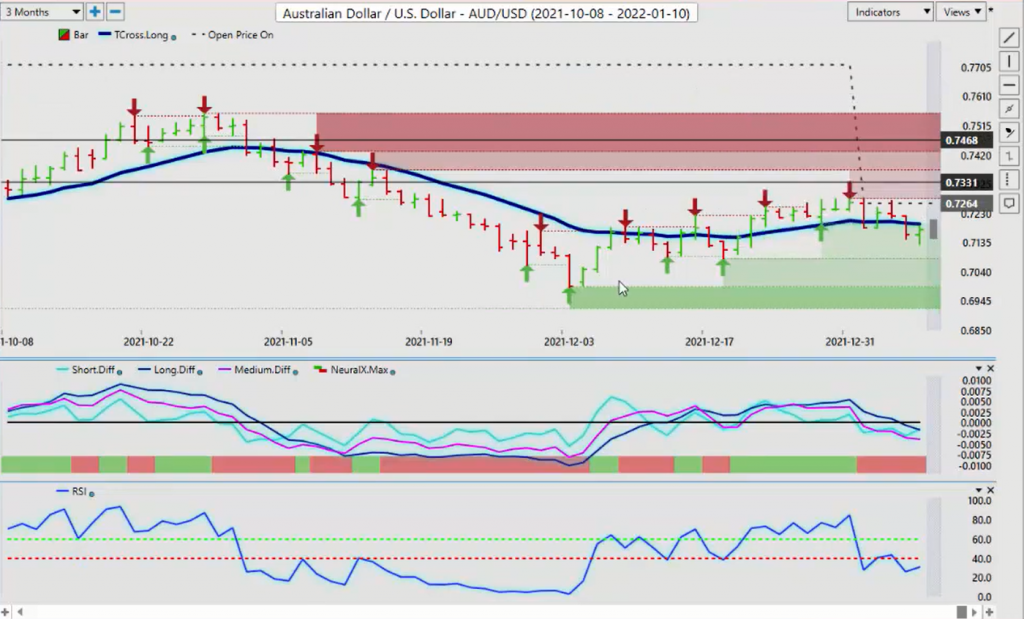
Our low end of this is 69.91 on the Ozzie Dollar. We can see that the New Zealand is virtually identical on the same date, that low coming in at 67.08. Now, we’re a bit of a mixed bag here, but that reverse check mark that you can see here on the predictive RSI, I would argue that 80% of the time, and you can see the reverse check mark on the Aussie. Also, about 80% of the time. That’s a warning sign that this is getting ready to reverse. So, this would be consistent while we wait for that period of dollar strength. But even during that seasonality of dollar strength, the Aussie and the New Zealand often buck that dollar, whether the dollar is strong or weak, is not always Aussie is doesn’t always affect the Aussie, the New Zealand and the CAD because they tend to follow metals and equities a lot closer.
So, right now we can see our key level on the Aussie. That’s coming in at a high there. We’ve got the T Cross Long, 71.95, we’re below the yearly opening price. But again, we are going to get a trending move across every market that I’ve discussed in this presentation this month and February, March, and April are very strong trading months. We just have to get through this chop to get through to the real price. So, what that said, this is the vantage point AI market outlook for the week of January, the 10th, 2022.


