


Register for a Free Live Training
The Hot Stocks Outlook uses VantagePoint’s market forecasts that are up to 87.4% accurate, demonstrating how traders can improve their timing and direction. In this week’s video, VantagePoint Software reviews forecasts for Western Digital Corporation ($WDC), Overstock ($OSTK), Texas Roadhouse ($TXRH), Williams Sonoma ($WSM), Kellogs ($K), CH Robinson Worldwide ($CHRW)
Hello again, traders and welcome back to the Hot Stocks Outlook for February 11th, 2022. I hope y’all having a great week out there in the financial markets, and as always, plenty to cover in today’s outlook. Now we’re going to start out, we have shares of Western Digital and also Overstock, which we looked at last week, the two of those. We’ll also look at Texas Roadhouse, which we looked at when it was in a downtrend a few weeks ago. We have William Sonoma here, Kellogg and we’ll end on CHRW, a transportation stock there.
Western Digital Corporation ($WDC),
So starting out here with Western Digital, I actually wanted to bring this through just to update everything. Like we looked at this last week and so what we have with Western Digital is daily price action. So each one of these candles represents a full and complete trading day. And right up against that price data, you’ll see that there is a black line and also a blue line there.
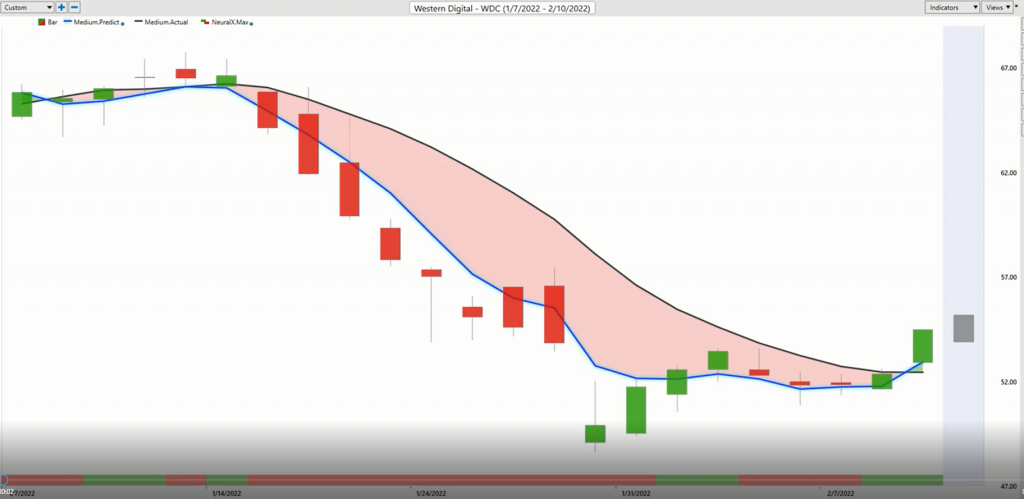
Now the black line that you’re seeing there, that is a simple moving average. So it’s a very common technical indicator in that it just looks at the previous 10 closed prices in this case, adds them all together and divides by 10. And what that does it smooths out existing price action to let traders know where has the market price been over the recent past a period of time here.
But obviously traders need to know where the market’s going ahead of time, not where it’s already been. And so what we’re able to do is actually compare that black value or that lagging moving average that we call it to this blue value and for that number to get plotted and calculated and graphed up against the chart each and every trading day, this is where VantagePoint’s technology of artificial neural networks come in and they’re performing what’s called intermarket analysis.
So specifically for Western Digital, the technology has identified up to really dozens of markets that are known to drive and influence specifically this target market. Now that can be things like the Dollar Index. That can be commodity markets like gold or oil. That can be things like the S&P 500 or the NASDAQ, but it’s also going to find very subtle market relationships in ETFs or even individual stocks. And it’s using that information to really extract some very valuable price information clues about what’s going to happen next.
And so what the technology does is it takes that information, summarizes it and actually uses it to generate true price predictions, which are then built into these indicators turning what was lagging indicators that really just summarize what’s already occurred in a market into a forward-looking predictive tool. So very simply whenever that blue line crosses, in this case, below the black line it’s suggesting average price are going to start moving lower.
Now behind all of these different indicators, that technology is solving a lot of different problems. So in this predicted moving average it’s looking for the overall trend direction and where average prices are going to move next. But at the very bottom of the chart, you’ll see you have a bar that goes from green to red, back to green and this gets updated each and every trading day and is a very short-term forecast.
So it’s utilizing that technology of artificial neural networks, but it’s only forecasting 48 hours at a time for short-term strength or weakness in the marketplace so you can use that in combination with our trend forecasts to get an overall forecast of the market direction here. Now to really round this out and we look at this every week is in addition that overall a trend direction, your neural index going bullish to bearish and letting you know about that short-term, you also have a predicted high and a predicted low range for the next trading day.
So you literally have intraday levels that you can set profit target, set, limit orders, whatever you need based on your trading style. And so we see here in Western Digital, we looked at this last week and I really brought it through as an example of a stock that was still in a downtrend. And the reason that I wanted to highlight that it was still in a downtrend is because we’d seen so many stocks that had reversed and gone into uptrend. So you see about a 21% move here and eventually we get this crossover to the upside in Western Digital. And well, now this is in an uptrend and you want to be buying at predicted lows, targeting predicted highs and really reversing that action.
But the reason that I wanted to bring this through is to highlight that there’s a lot of markets that have already reversed that should really garner your attention here. And that’s why last week we’re looking at, “Okay, well, what’s going on in some of these areas of the market?”
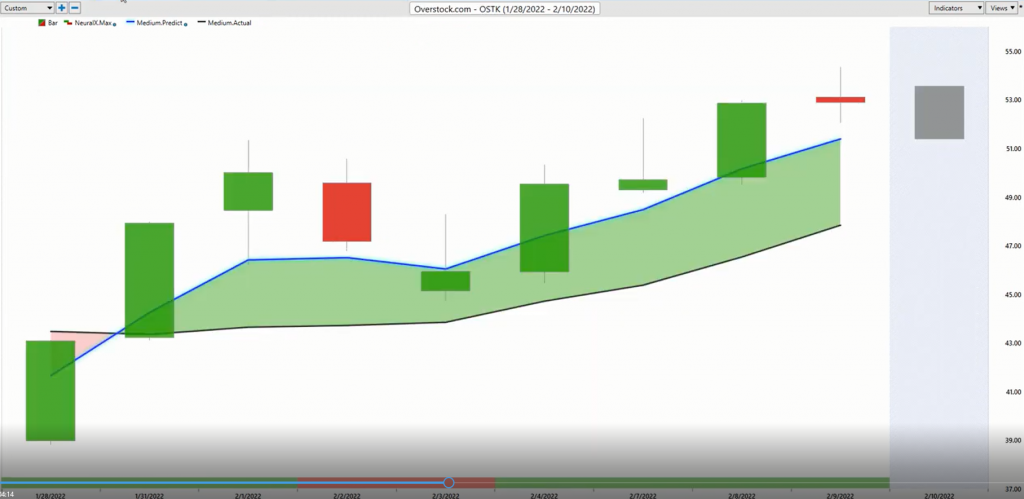
Well, we can see a crossover over a week ago here in Overstock. So you see that blue line crossing above the black line? A lot of separation. And what’s interesting about this is if you’re using the predicted lows and trying to say, “Okay, well, I want to try to get in at these levels.” If you leave any of those orders waiting, well, they’re just going to get filled when the market gaps down and then immediately trades higher and moves on with that trend.
So you have these levels to really stake out and say, “Okay, let me get that exposure.” And those things will get filled, the market moves up and you’ve got a nice little entry in a stock market that’s done fairly well over the past few days here. So different ways in how one might exactly get into the opportunity, but in this case, you’re very likely having orders waiting down here. And you see about a 17.6% rally in about five trading days.
So again, if you’ve just got a couple 100 shares there, you have about $1,500 in just about a week and a half or so.
But here’s Texas Roadhouse. And so this was a market that was also in a downtrend, but you see that much like Overstock is really coming through the IntelliScan. So these tools that we have that can actually look for these predictive indicators, creating some signals. Well, when we start to run this on literally hundreds of different stocks and we see these blue lines crossing above the black line in a lot of different areas of the market, it gives us some overall market awareness that says, “Something’s going on here. We should really be on the lookout for opportunity.”
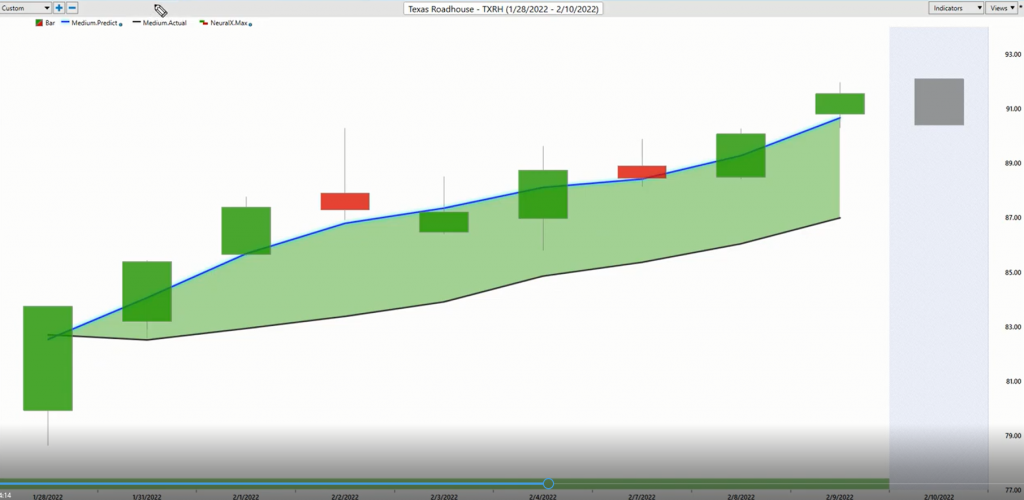
And once we identify those areas where we might want to trade, well, then we’ve got a road map that says, “Okay, well, where do we want to be scooping up some of those positions and shares and where do we potentially want to be taking profit?” But of course also sticking with that overall trend here. So we’ll see where some of this stuff goes much like Western Digital and these things. They can be in downtrends and then things shift in reverse. And that’s where the software is going to help you get ahead of it. But you see here in shares of Texas Roadhouse, about as strong as a forecast you can get with those crossovers coming through and the neural index just remaining bullish for the duration here.
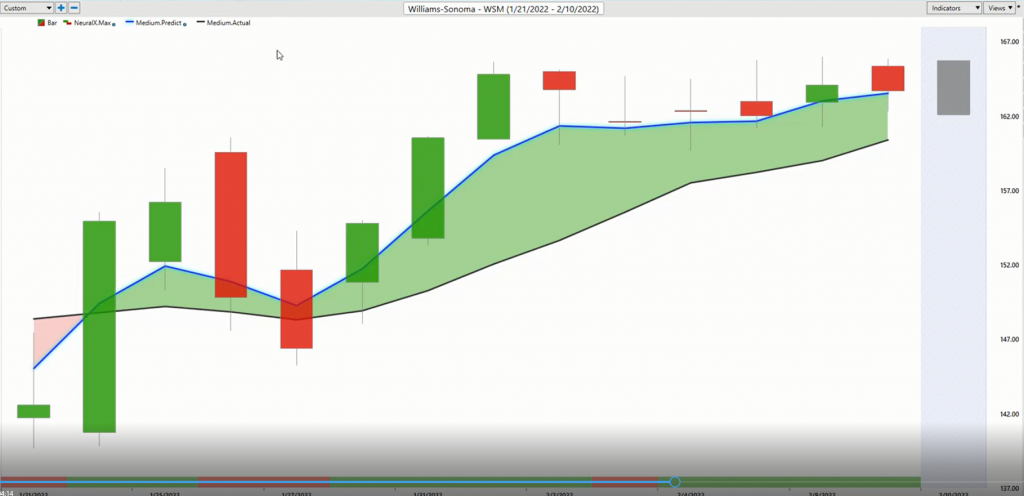
Here’s William Sonoma. And I wanted to bring this through because it came through earlier than most of the other opportunities. So it was pretty much right at the beginning of February, we see all these crossovers come through. VantagePoint saying, “Look, these markets look like they’re going to go higher.” But specifically in William Sonoma, the situation was a little bit different. And you see you get this crossover really a week early all the way back on the 24th. And you see just a huge range here. Volatility really heating up, but you have those predictive tools to guide you.
So it’s not like you’re just seeing this and getting involved in the market. You’ve got predicted high and low levels every single day that are saying, “Okay, all right, well, look to maybe buy a position here. We’ll look for the market to move lower.” And you see after this trading day where it closes lower, it says, “Okay, let’s summarize that information, look at what’s going on in these intermarket relationships and forecast future price of the predicted range.” And you see it does an excellent job of letting you know, “Look the predicted high and lower moving lower.” The range is lower, but the overall trend, well still to the upside and you would only want to be long taking profits on longs. And certainly in this same time period here you’re potentially still short some of those stocks.
We just recently in beginning of the month start to see shares turn higher, but this is where the individual forecast in this case for William Sonoma are letting you know, “No, you need to look at this a little bit earlier to get those entries so that you really benefit as much as possible as a broader market start to reverse and move higher.”
Here we got shares of Kellogg’s and I’m bringing this through because consumer non-cyclicals are doing really well. We looked at McCormick and some of these just things like Kellogg and Clorox and Johnson & Johnson, all these things. We’re doing quite well, but you see that in this present period that we’re in very clearly the consumer non-cyclical are not where you want to be.
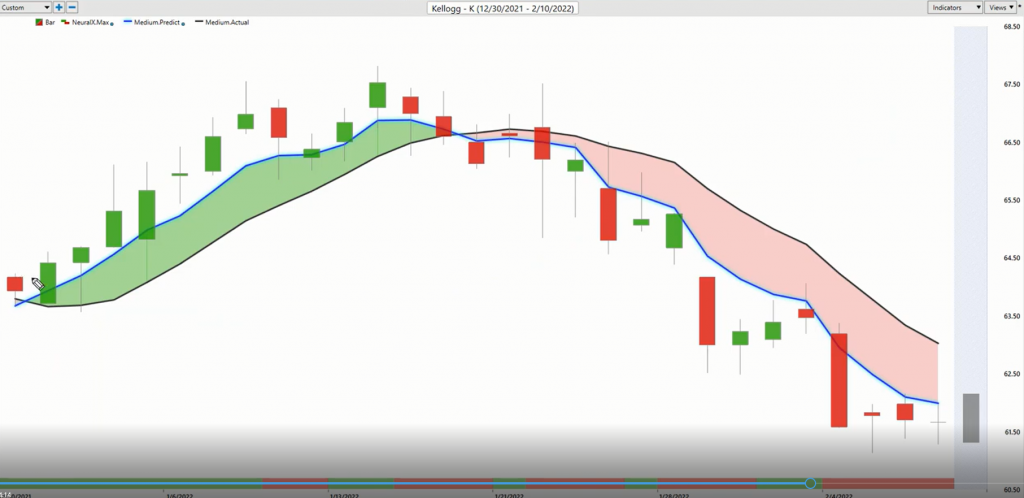
And most recently this crossover to the downside just opening up a really nice entry for some shorts. So if you have those recent longs that may have gone in the portfolio, you can also have some shorts that have excellent entries and you can keep managing those positions, of course, with the help of the predictive forecast as things walk forward. So about a 7 or 8% decline there in Kellogg’s.
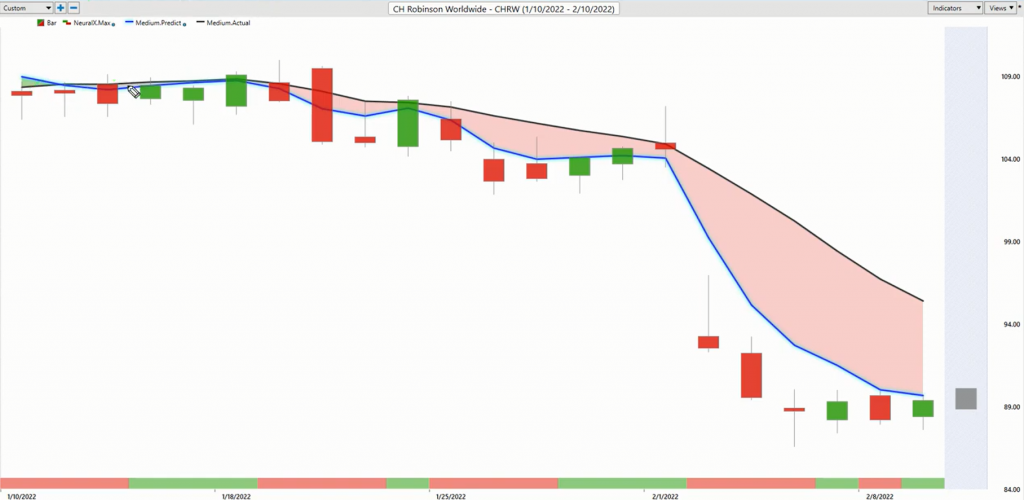
And lastly here, just transportation. Another area of the market that is not strong. Certainly, there’s been a lot of strengths spread out and all these different names, but certainly here in transportation you see CHRW crossover to the downside. You get a couple of these spurts with the neural index getting bullish, but you can just see clearly here is this a place that you want to be going into February? Maybe you want to be there, but on the short side or buying some put options.
So it is not just about those crossovers and that’s just what I really, really want to highlight in these Hot Stocks Outlooks is you recognize those situations and the scans will get these things on your radar when those sort of inflection points come into the market and these trends reverse, but it’s about the adaptability. Those daily forecasts that are utilizing this technology every single day, the technology going to work doing its analysis and spitting you out these levels that are going to make you a much more effective trader to minimize risk and maximize each opportunity that you might find yourself in.
So really again, nice move here. It would be a wonderful thing to have hedging the portfolio in some of these areas where you have some more exciting things moving to the upside. So about an 18% decline there in just 20 or so trading days. And we’ll go ahead and leave it there for this week’s Hot Stocks Outlook. Again, this being February 11th, 2022. So thank you all for watching, best of luck out there, thanks again and bye for now.


