


Welcome to the Artificial Intelligence Outlook for Forex trading.
VIDEO TRANSCRIPT
S&P 500 Index ($DXY)
Hello everyone and welcome back. My name is Greg Firman and this is the Vantage Point AI Market Outlook for the week of February the 27th, 2023. Now, to get started this week, we’re going to do things a little bit different this week. I was asked to look at some of the other global indexes, and I think it’s a good thing to always give the people what they want. So let’s have a different viewpoint here. First thing we want to see is I’m using the S and P 500 as my main anchor point for correlations with the global indexes, not just the US indexes. So as we can see, the S and P 500 is turned lower on some of the inflation data this past week.
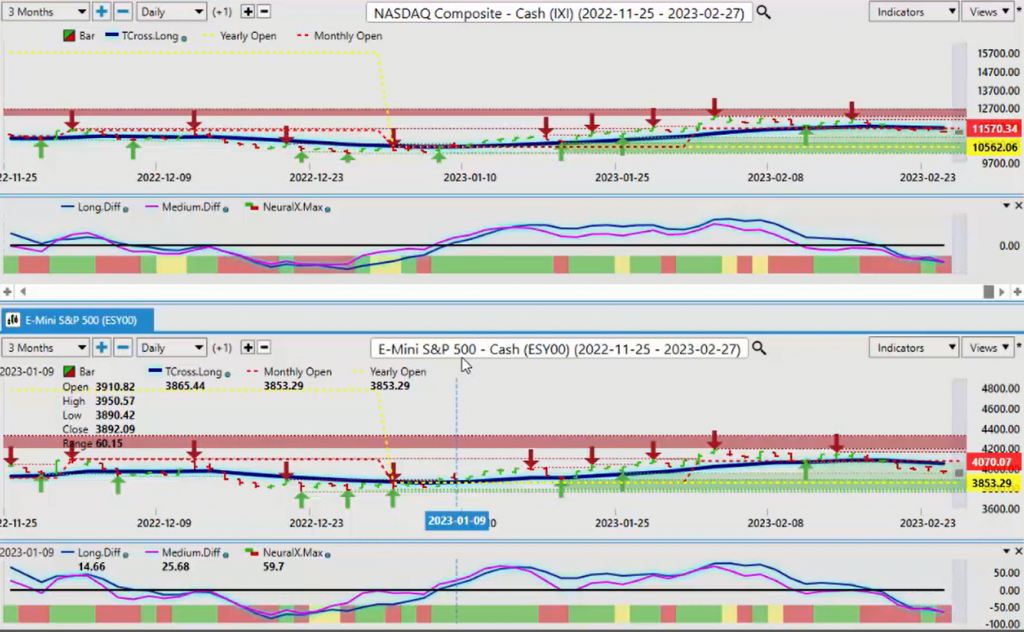
What I will point out to everyone here that the PCE deflator, the personal consumption, the CPI, these are not leading economic indicators, guys. They’re lagging indicators. So what happened in January may not necessarily happen in February. So we’ll be getting a new set of numbers in March for all of that, and I don’t know that it’s going to support excessive rate hikes. But either way, this is where we’re at right now. The S and P 500 is the main correlated market I will use for the global indexes. The S and P 500, our key level 4050, 62 is our T-cross long. We remain short while below this level. However, I will point out that the equities remain, the S and P remains up on the calendar year. Where the dollar index is only up about 1%, we’re still up 2.96% on the S and P, and we’ve hit a high of about 7% so far.
When we look at the direct intermarket correlation between the S and P 500 and the NASDAQ, we can see that the correlation is about 98% positive.
Bitcoin
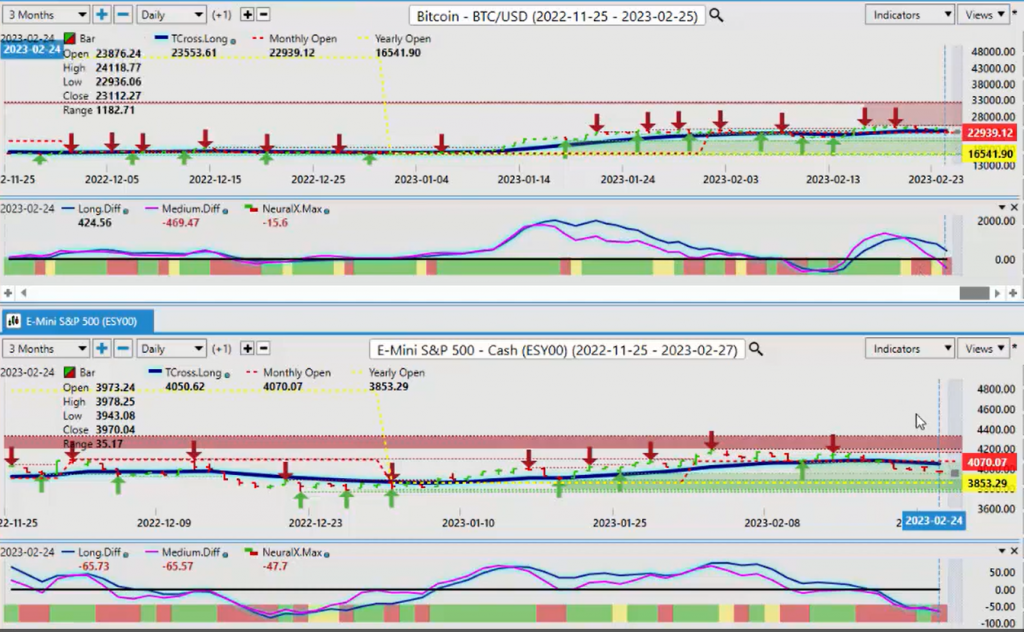
The NASDAQ losses are not quite as much as what the S and P 500, but in my respectful opinion that’s being driven by Bitcoin. Bitcoin remains firm. Bitcoin’s still holding above its monthly opening price while the S and P 500 is not. But the Bitcoin, much like the S and P 500 is also remains very positive on the year.
Now, when we look at some of the comments coming out of Charles Munger and Warren Buffett and these people, just utterly ridiculous what they’re saying. As you can see by this chart, there’s a 98% positive correlation between Bitcoin and the S and P 500. The 10-year annualized returns on Bitcoin, 230%. So if these people are so negative about Bitcoin, how could they be based around those particular numbers? It still confuses me, the comments made by some of these people. So what we don’t want to do is get involved in hearsay. We want to look at these charts and we want to look at annualized returns. And more than anything, we want to identify what is Bitcoin actually correlated to. Clearly it’s correlated to the global indexes. So right now, yes, we have a sell signal on Bitcoin and we are likely going to retrace further, but we remain firmly positive on the year again so 16451, our key VP level for next week, 23553.
Dow Jones Industrials Average
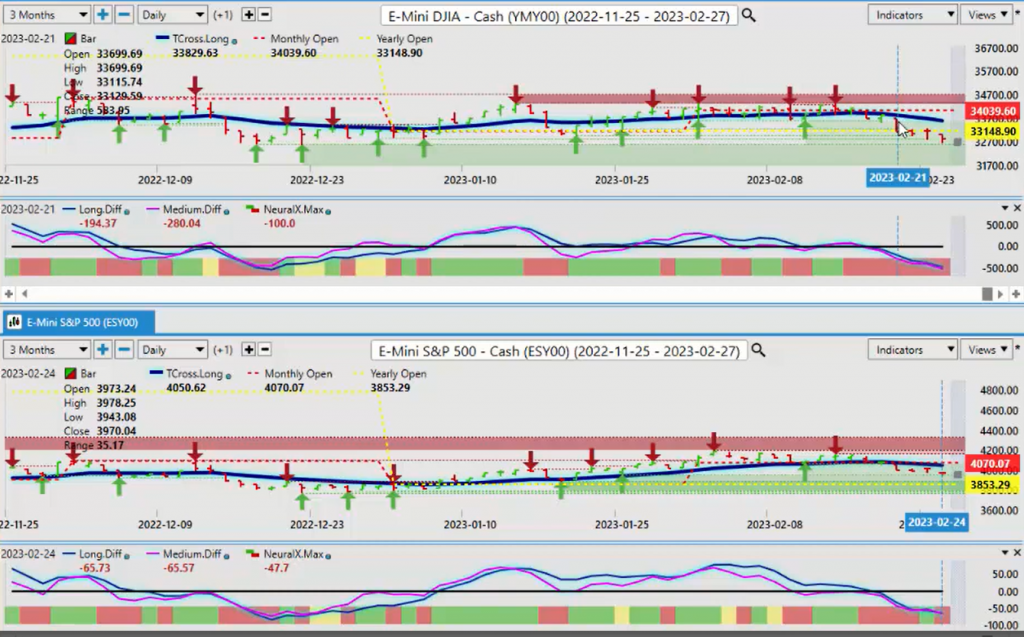
When we look at the Dow Jones Industrial Average, we can see the losses are accelerating, but the correlation between the S and P 500 and the Dow Jones Industrial remains sitting at about 98%. But on a scale basis, it’s moving faster. Now, my concern with the Dow Jones is it has breached its yearly opening price at 33148. So this one is the losses are accelerating faster, this could be a leading indicator that the S and P 500 and the NASDAQ are going are getting ready to follow. But as you can see, the NASDAQ is considerably stronger than the other two.
Russell 2000 Index
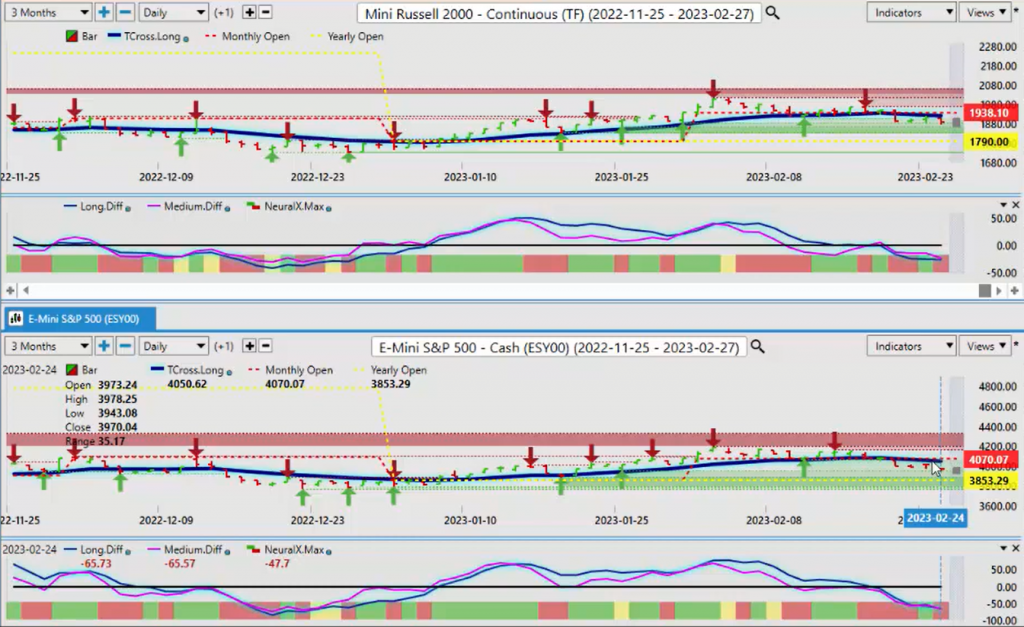
We also want to look at the Russell in a comparative analysis to the anchor point of the S and P. So right now, the Russell 2000 is virtually identical, but as you can see, by using this predicted moving average that essentially the way the market is moving, the correlation is indisputable and it’s very, very high, well over 90% positive in most of the AI weekly outlooks, that’s why I only did the S and P 500, but I think that this is a better way. Why should we just stop in the US? We can look globally at these indexes, again, not in isolation, but compared against the index, the S and P 500.
DAX Index
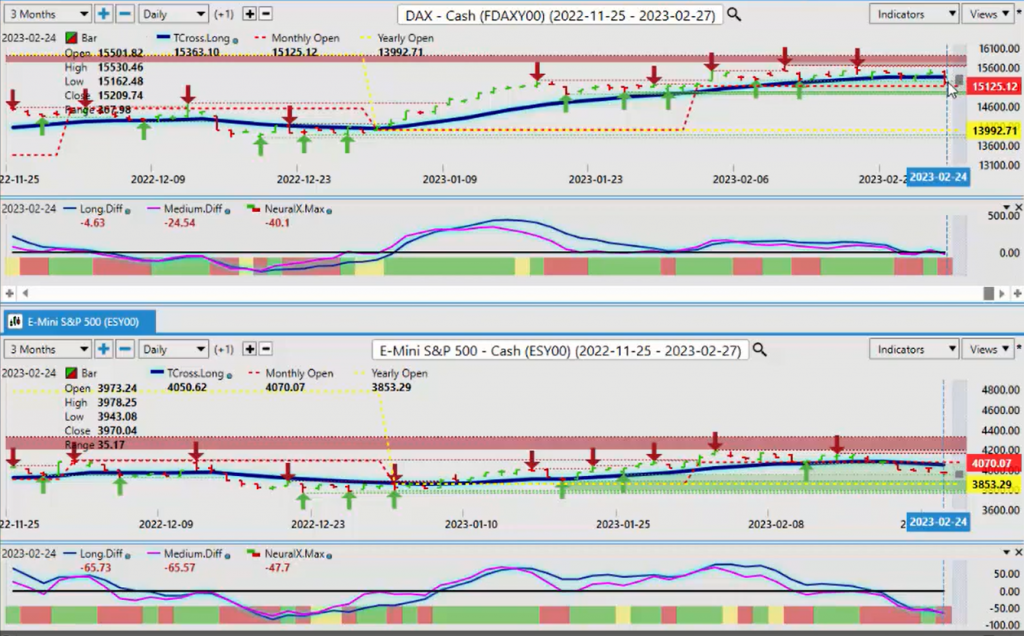
So when we look at the DAX, the DAX has taken some losses, but that was mainly just on Friday on that inflation data, excuse me. But again, personal consumption, guys, lagging indicator. I think the market may be overreacting a little bit, but if we look at the yearly opening price on the European indexes, 13992, very much positive on the year, but on a scale basis, it’s moving up faster than what the S and P 500. So the losses could accelerate quicker on this, but we’re also holding above the monthly opening price at 15125. The Vantage Point T-cross long, 15363. So this is what we want to make sure that we’re watching very closely, is that if the S and P 500 can remain above its yearly opening price, then if the markets turn, then the European markets also represent opportunity for us. If we look at the Dow Jones Euro Stock 50, once again, you can see that the DAX and the Euro Stock 50 are virtually identical, just sitting on their monthly opening price, but also firmly positive on the year.
Nikkei 225
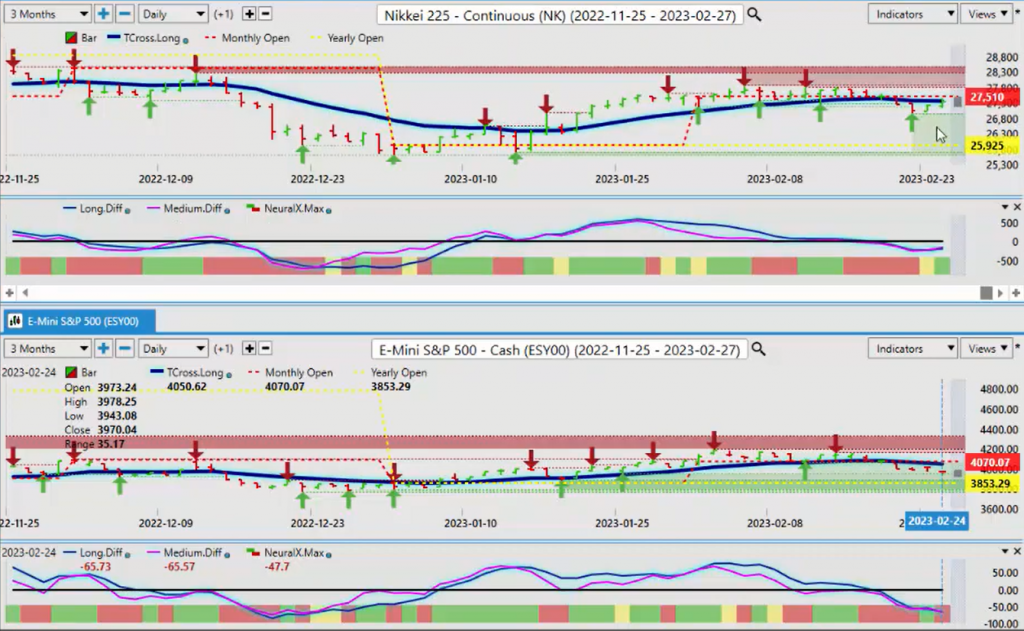
If we look at the Nikkei 225, it more resembles the Dow Jones Industrial pushing below the monthly opening price, but remains firm. And once again, the Nikkei is a very, very volatile index. But when we look at the MA diff cross, what I’m seeing here is potentially a buy signal forming on the Nikkei. You can see we’ve got our neural index, our medium term cross and our long-term predicted difference. This is starting to turn back up, despite the North American indexes turning down. But if you look at the scale of this, it’s more amplified, but the correlation to the Nikkei and the S and P 500 remains above 90%. So once again, if the US indexes are getting a little shaky because of the potential of the Fed hiking more, then maybe we can look outwardly to the European markets to get a little bit better opportunity. Or if we believe that they will follow the Dow Jones Industrial, the S and P goes lower, the NASDAQ goes lower, then shorts on the Nikkei, the Euro Stock 50, the DAX, these could be very, very good opportunities.
Volatility Index
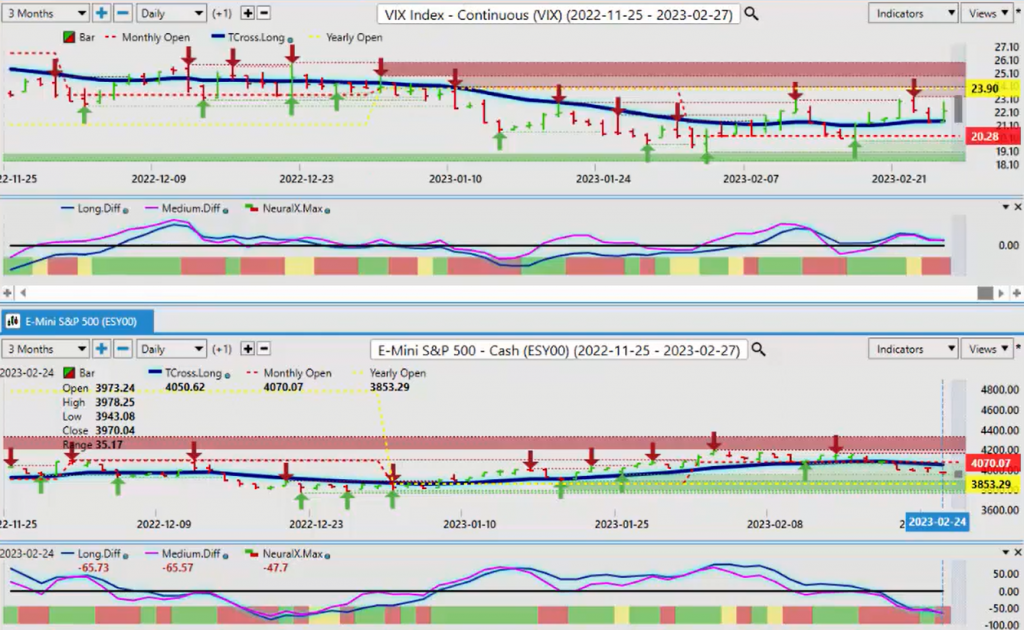
So it wouldn’t be a complete outlook or AI weekly outlook with these indexes unless we bring in the VIX. So when we bring in the VIX, the bottom line is the VX remains below its yearly opening price. It is not positive on the year. So until such time, the S and P 500, the Russell, the NASDAQ, the Dow Jones, the Nikkei, the DAX, the Euro Stock 50, they still have the possibility of moving higher. But if the DAX moves above 2,390, then we’ve got ourselves potentially a bear market. But to be clear, if we’re holding above the yearly opening price and we’re up to 2.6% on the year on the S and P 500, then it’s very difficult to make that bearish argument for the calendar year.
Once we breach below that, then we can look at that. But again, we’ve got to be very cautious with this economic data to make sure we’re looking at leading indicators, PMIs, consumer confidence, retail sales, these are leading economic indicators. We don’t want to get tangled up with the lagging indicators. I believe the CPI may cool in February when we get the data. I believe personal consumption may cool a little bit, but that’s going to be a wild card until we get there. So when we look at this right now, the main thing we want to do is then apply the same type of analysis to our additional futures and Forex markets. So when I look at this, I can say, “Okay, well if I’m looking at stocks from this particular viewpoint, then it would be reasonable to look at the currency markets the same way.”
U.S. Dollar Index versus Canadian Dollar
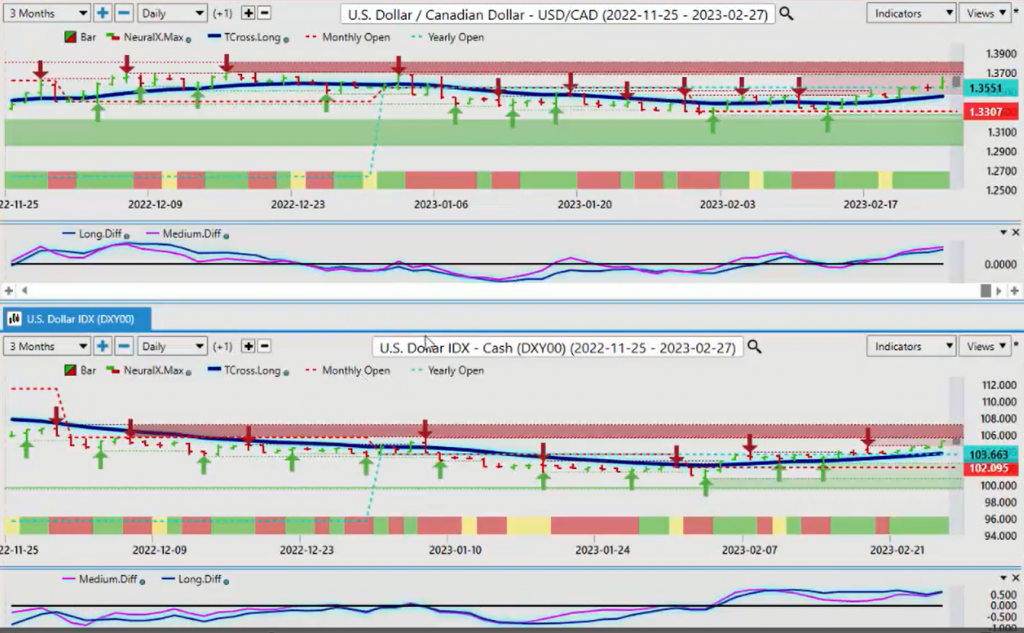
So if we’re looking at that, my anchor point is going to be the dollar index. Instead of looking at a chart and applying 50 indicators to it, we don’t want to look at that in isolation here. The primary basis of the Vantage Point software is intermarket technical analysis, so these correlations are extremely important. The dollar has moved higher on this inflation data this week, but again, will the markets still buy into this theory come Tuesday or Wednesday of next week when they have to rethink this and say, “Well, yeah, that was January, but what about February? What if the numbers are considerably different because the numbers are usually a little hotter in January anyway.” So again, we come up against some very, very stiff verified resistance here. That area is coming in at or about the 10563 level, I’ve got additional verified resistance. That level will come up even higher. We’re going to be looking at around approximately, I’m going to say 10580, 10590.
But if we can break through this red zone up here, then the dollar could go into a very bull market. But my optimism at that time remains guarded because the global equity markets are still positive. So once again, if we look at this, it would be reasonable to bring in a secondary market in our Forex trading or in our currency trading, or even in our equity trading. So when we look at the S and P 500, the main intermarket correlation that we need to understand right now is that it’s dollar up equities down or dollar up and everything else down, including gold and oil and all these different things. So this is something we want to make sure that we’re looking at very closely.
So as we can see, the first thing we do is identify that as the dollar starts moving higher, the equity markets, they come under pressure almost immediately. And then as we the dollar starts to advance further, the equity markets continue to slide down. So again, I’ve got my anchor point here for the dollar in my currency trading, but at the same time, I need to bring in another market to assist with this. So right now with the S and P 500, we can say, “Okay, the global indexes are likely going to remain soft while the S and P 500 is below 4050.” The global buying of currencies will favor the dollar while the dollar index remains above 10378, but they also have to reassess that data next week that we received this previous week.
So looking at those levels right now, the dollar index, the predicted differences, the neural index remains strong. The equity markets are soft.
U.S. Dollar versus Swiss Franc
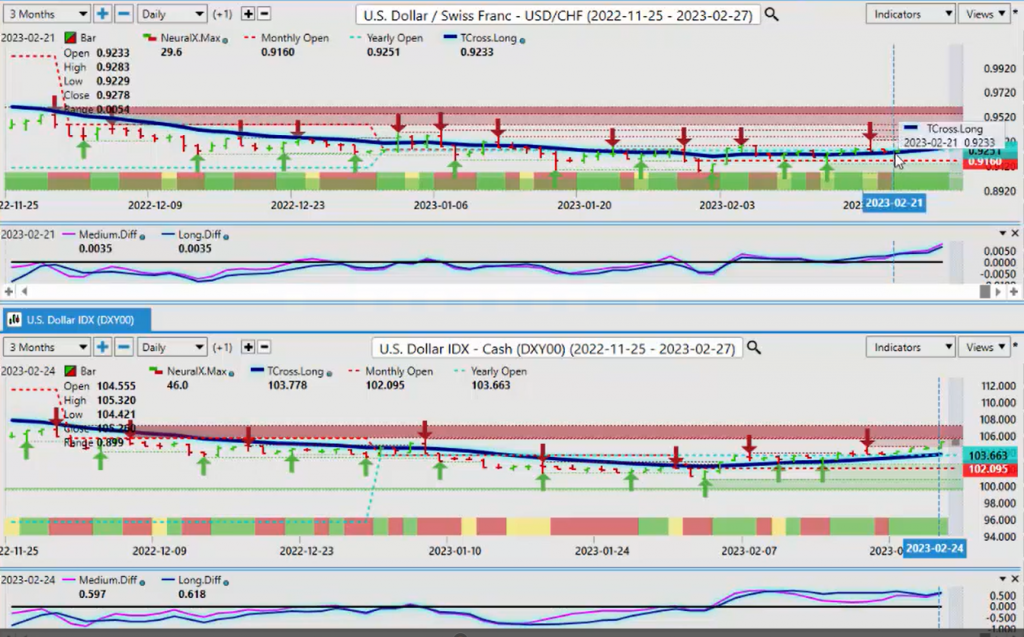
When we apply intermarket correlations to our Forex trading, we need to understand that this is also now interest rates. So the dollar, the US interest rates are some of the highest. So if the dollar is moving higher, US Swiss franc will continue to follow it higher, it will track it higher. The US Swiss franc, our key level there, 9268. So we’re looking for this to continue to advance, but only if the dollar index does. So again, the dollar index has to clear some significant resistance here to help that.
U.S. Dollar versus Japanese Yen
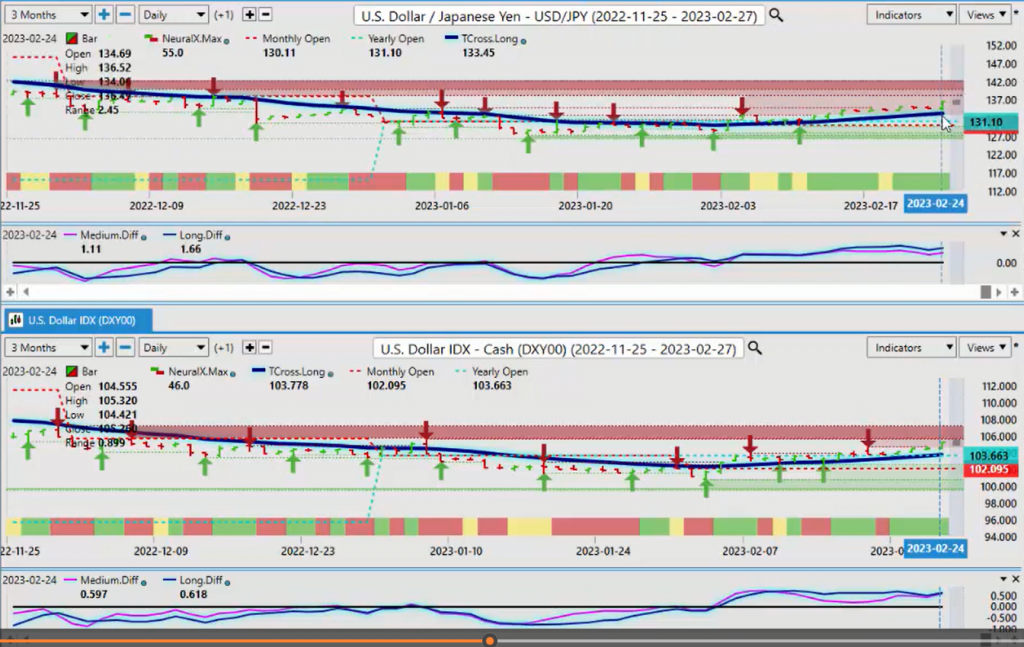
If we look at the US Japan, we can quickly identify when it comes to interest rate, guys, Japan doesn’t stand a chance on this one. There’s just too much of a gap on the yield spreads between the yen and the dollar, it’s just… Between Japan and the US, excuse me, it’s just too big.
So the yen will continue advance, but for this week, 13345 is our T-cross long. We need to hold above that. Our predicted differences are above the zero line. It still supports longs on the yen. I can’t believe I’m saying this at this particular level, but at 135 on the yen, I haven’t seen this in 20 years, guys, but the reality is there’s a fundamental answer as to why this is happening. The dollar strength, the interest rates in the US. The yen, this is by definition the carry trade, buying dollars, buying a strong high yielding currency against a low yielding currency.
U.S. Dollar versus Canadian Dollar
When we look at the US Canadian pair, the US Canadian pair now pushing or attempting to push, on Friday, above its monthly and its yearly opening price. So with US Canada for next week, the yearly opening price is 13551. We would consider that to be long while above that particular level because now this pair has officially turned bullish on the year because, as you can see, the entire calendar year, US Canada has been below its yearly opening price. It’s been pierced, but we need to hold above that. I believe it could have a significant retracement at the beginning of the week as they reassess the economic data. Again, this is something that most don’t take into consideration, but when you’re looking at your charts, make sure you have an anchor like the dollar index to do a comparative analysis. So right now, yes, the Canadian dollar is suffering.
Australian Dollar versus U.S. Dollar
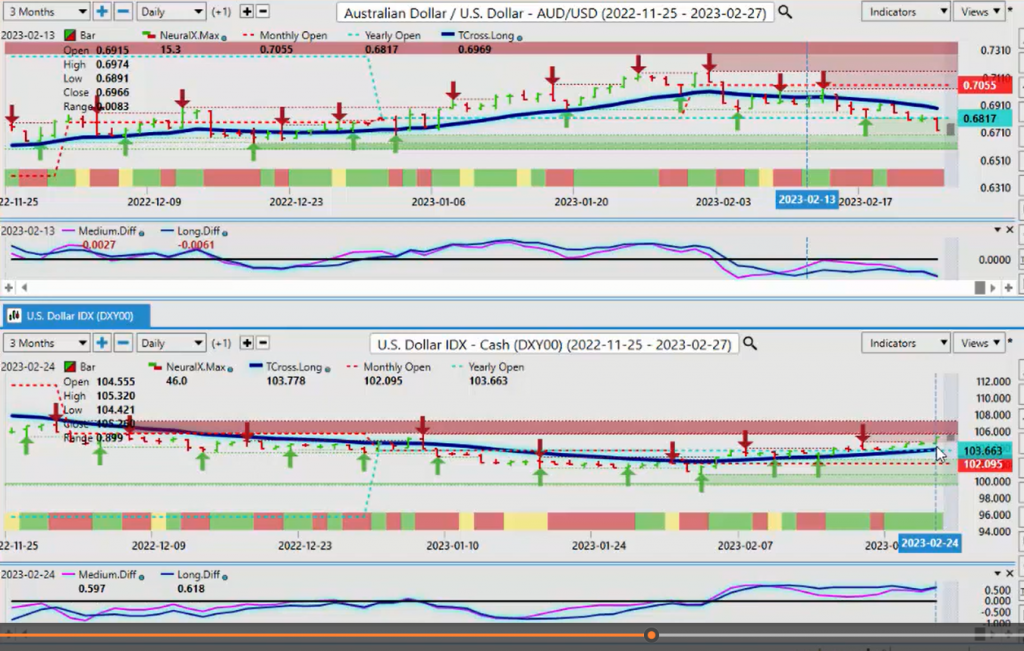
The Aussie dollar also suffering from this dollar strength. As you can see, when the dollar index finally started to show its move back here, you can see that the Aussie responded immediately with any kind of move above the Vantage Point predicted moving average the T-cross long, the Aussie immediately slipped below it. So again, using dual charts like this, it allows us to see multiple things at once. We’re not isolating the Aussie US by itself. We’re not isolating the dollar index by itself. We’re looking at a comparative analysis between the two of them. And the simple answer is if the dollar cannot advance higher, then stocks can’t advance lower vis-a-vis Aussie US moves higher or vice versa. So this is what we have to take into consideration. What is the next move on the dollar and what is the next move on equities that will help us determine which way we would go with Aussie US?
New Zealand Dollar versus U.S. Dollar
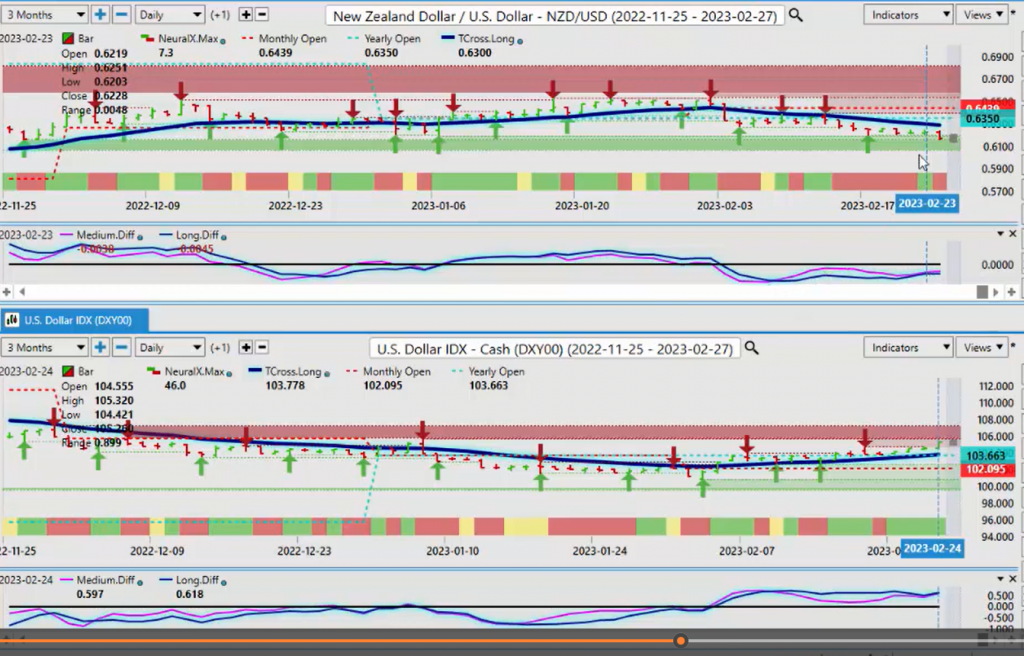
I would argue the same thing for New Zealand US, despite the hike this past week, it wasn’t enough to boost it higher. Or if we look at the Vantage Point software closer, we do have a buy signal forming on New Zealand US. The medium term trend is weakening against the longer term down trend, pink over the blue that usually leads to some strength. Now, our T-cross long here is coming in at 6290. We need to break above that, but we’re below the yearly opening price and New Zealand still having a terrible month below its monthly and its yearly opening price. But again, can that shift? The answer would be indisputably yes, it absolutely can.
Euro versus U.S. Dollar
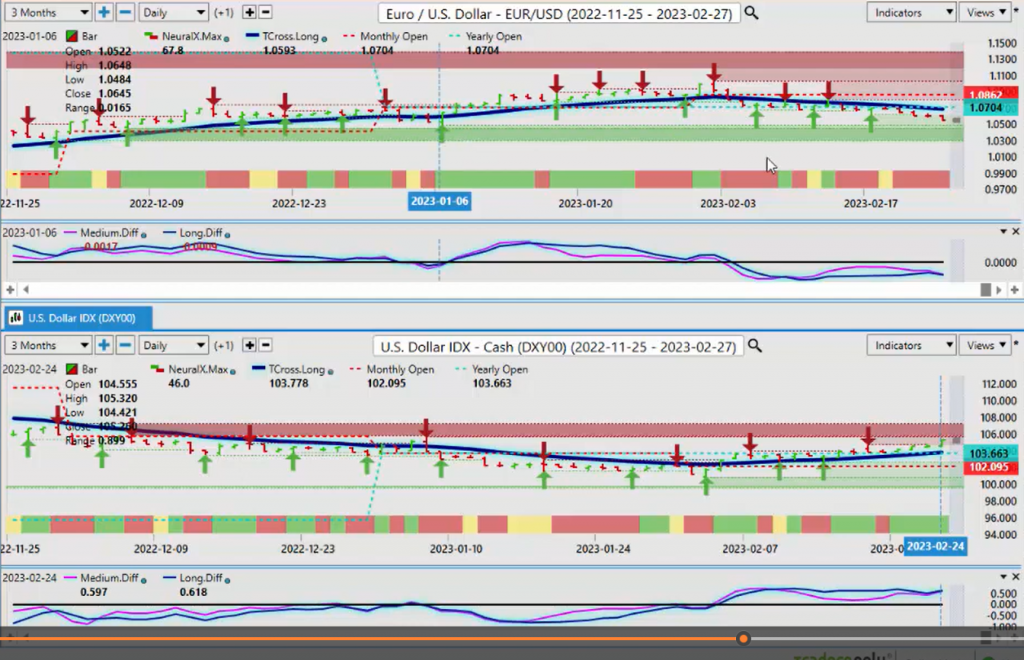
If we look at the counterpart here, which is the Euro US, we can assess the exact same thing. The Euro makes a push off the predicted moving average back on the first of the month, but then it slowly starts pulling back down as the dollar starts pulling up. So doing that comparative analysis right now, you can see that again, we’re running into a very, very heavy support level down here, 10443, I believe, 10550 to be just as equally as strong, 10484 excuse me. So there’s some very strong support down here.
If the equity markets turn higher, then the Euro will follow it higher as the dollar turns lower. It’s connecting the dots. The same thing with the British pound US dollar.
British Pound versus U.S. Dollar
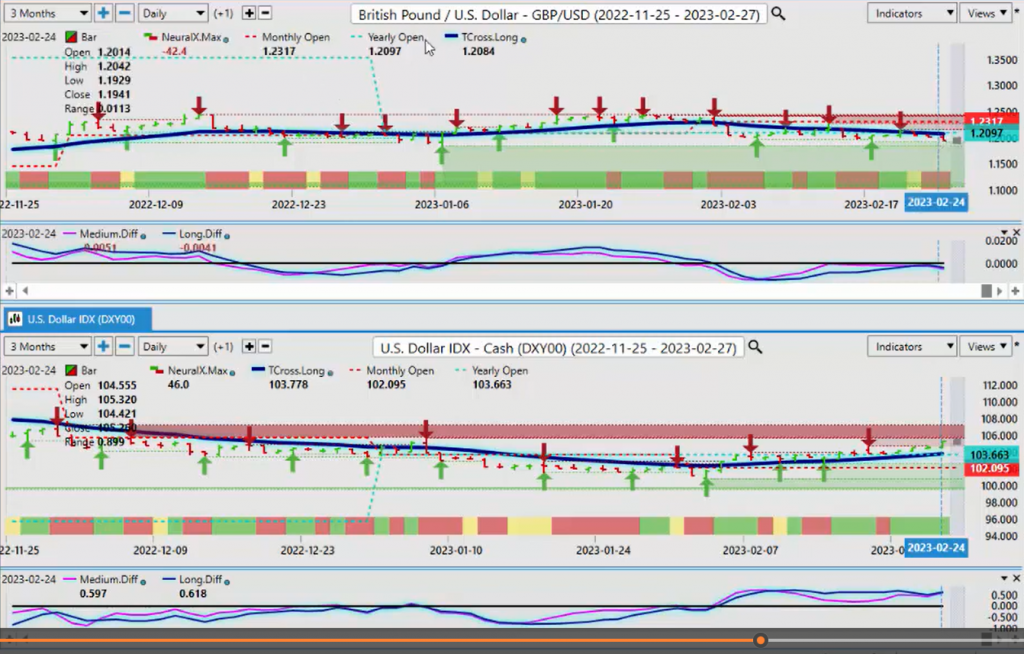
The British pound US dollar is slightly below its yearly opening price at 12097, but it remained below that and the T-cross long for the entire week. In my respectful opinion, despite that little pop on Tuesday, after the holiday Monday, it very quickly returned to its primary trend. The predicted difference is failing at the zero line as the dollar starts to ramp back up again. So once again, our T-cross long here for next week is coming in at 12084. If we stay below that a short is reasonable and the dollar will continue to advance.
Now, from a seasonal standpoint, the dollar is normally fairly strong. There’s a couple of times of the year the dollar is quite strong, between February and mid-April I would argue, and then September and October. But it still is a dollar cycle at the beginning of the month, the first week of the new month, the dollar is usually strong, and then it tends to pull back in the middle of the month and then strengthens again towards the end of the month. I believe this is akin to real money buying. The governments must buy dollars to settle their trade balance. They must buy dollars to pay social security, government employees, fund pension, just a long list of why they need dollars at the beginning and the end of the month. So again, these are things that we can actually monitor.
Now, one that is bucking the trend, which is of interest to me, is the US dollar against, of all currencies, the Mexican peso. It’s struggling for any traction, but if there is a full-blown new dollar trend to the upside, that’s fine with me. But then we look for places of value to buy those dollars, and I’m not sure that buying dollars against the Euro, the pound, the Aussie and the Canadian are the best, but over here, well, yes, it could very well be just that, a better place to buy dollars. Now I can bring in additional markets here to see how the dollar is affecting them. Now, again, when we don’t look at things in isolation and we bring in the intermarket correlations with the predicted moving averages and the core Vantage Point indicators, then we can see that essentially, again, this is a classic head fake, or excuse me, or a bull trap when they send it higher away from the predicted moving average, at the same time the dollar is starting to rebound and you can see the very next day gold’s taking a hit.
Gold
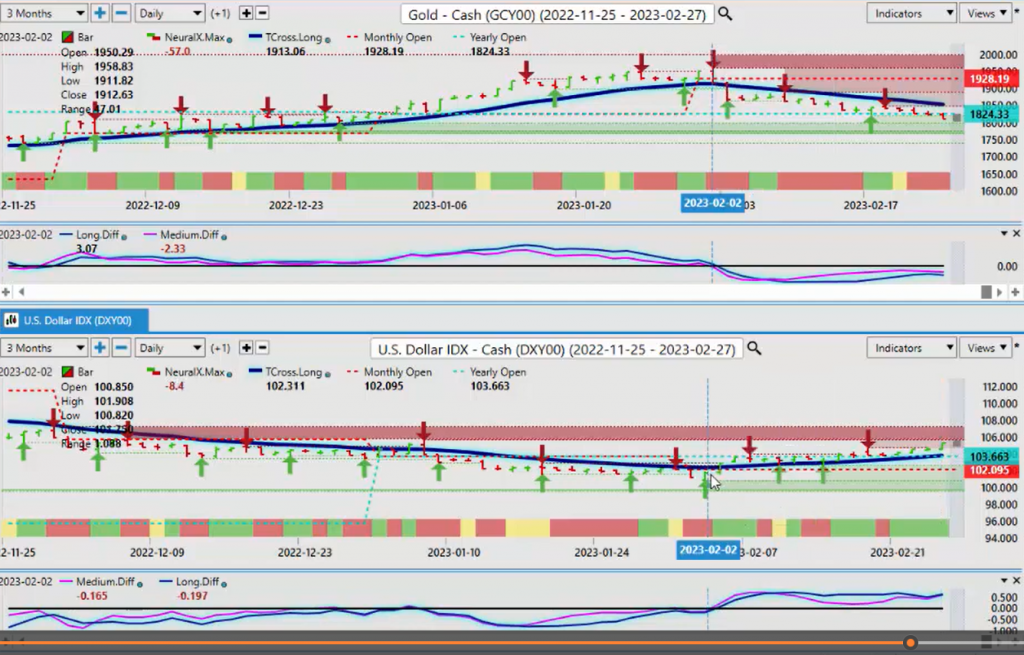
So right now I’m in the camp that in the future that once again, the US dollar is not gold’s only nemesis here. I firmly believe that Bitcoin is gold’s nemesis because again, if we look at gold on the calendar year, the yearly opening price at 1824 we’re basically on that now. Where we do the comparative to that in Bitcoin, and Bitcoin is still well up on the year and to date, we’ve been up close to I think 38% on Bitcoin. So gold simply can’t compete against something like that. And again, I’m still also of the opinion that it’s possible that Bitcoin and some of the other cryptos can be their own asset class, regardless of what’s going on with the dollar and the equity markets, that there still may be demand for that.
Crude Oil
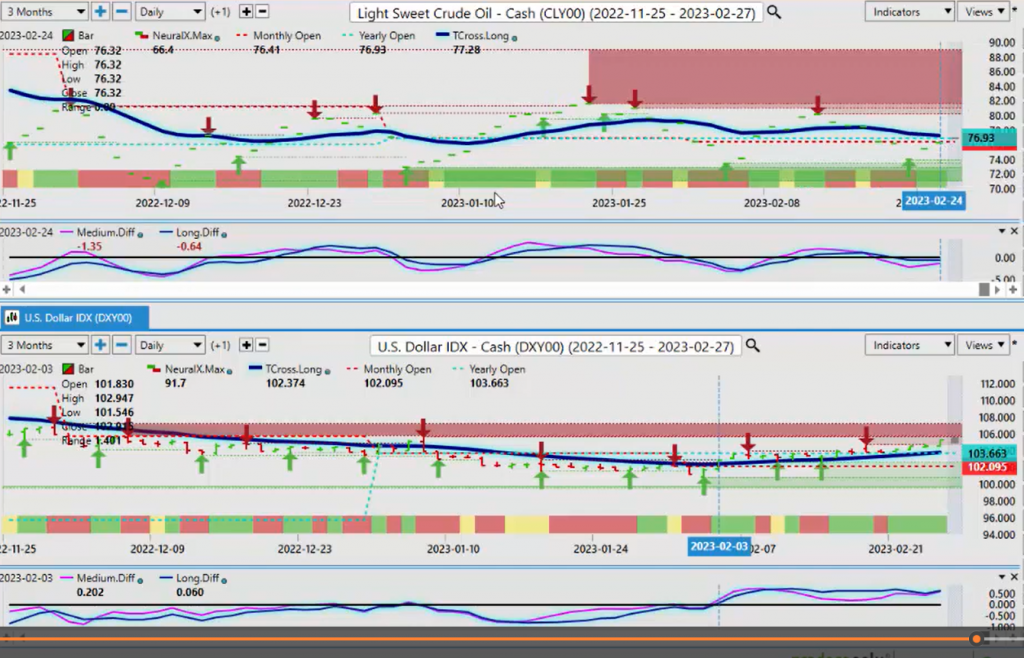
If we look at light sweet crude oil with light sweet crude oil, we’re not having much different, that’s a bit of an oddball chart there. Let me just correct that. So when we look at this from the future side of this, you can see that this dollar strength is once again clearly affecting oil prices. Oil has tried to recover multiple times during a consolidation period on the dollar, but as the dollar started to advance, you can see that oil was not impressed by that one bit, and down it went. So again, this is still a number of factors pointing towards that we’re not getting a soft landing, that we are moving towards a recession, and this is spooking a lot of your oil bulls. So again, what we want to make sure that we’re always doing is looking at things from a broader perspective, bringing in additional markets, and having that anchor point in our equity markets and in our futures and currency trading because it will allow us to see things very differently. So with that said, this is the Vantage Point AI Market Outlook for the week of February the 27th, 2023.


