


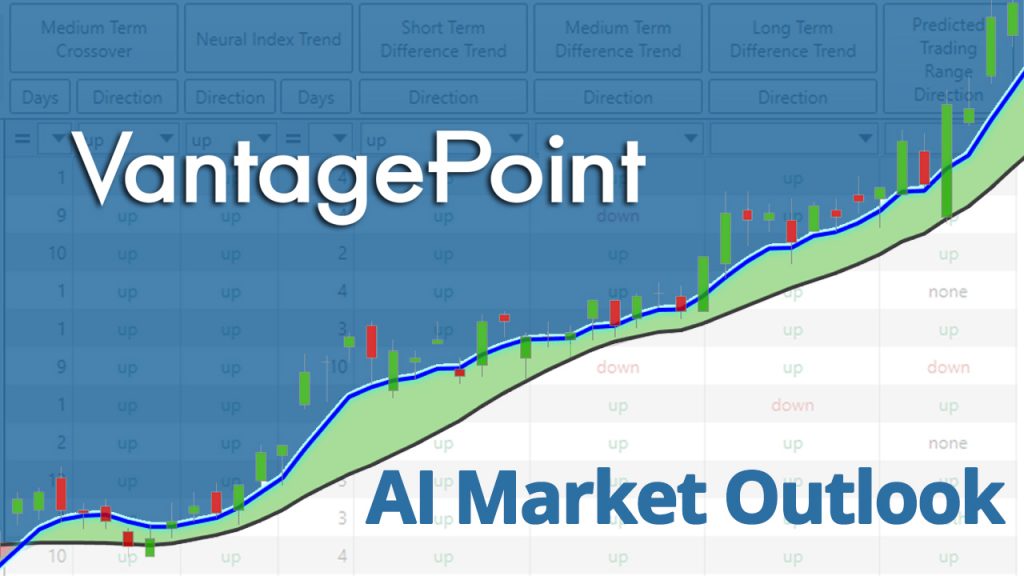


VantagePoint AI Market Outlook for the Week of February 1, 2021
VIDEO TRANSCRIPT
Hello everyone. And welcome back. My name is Greg Firman and this is the VantagePoint AI Market Outlook for the week of February, the 1st, 2021.
U.S. Dollar Index
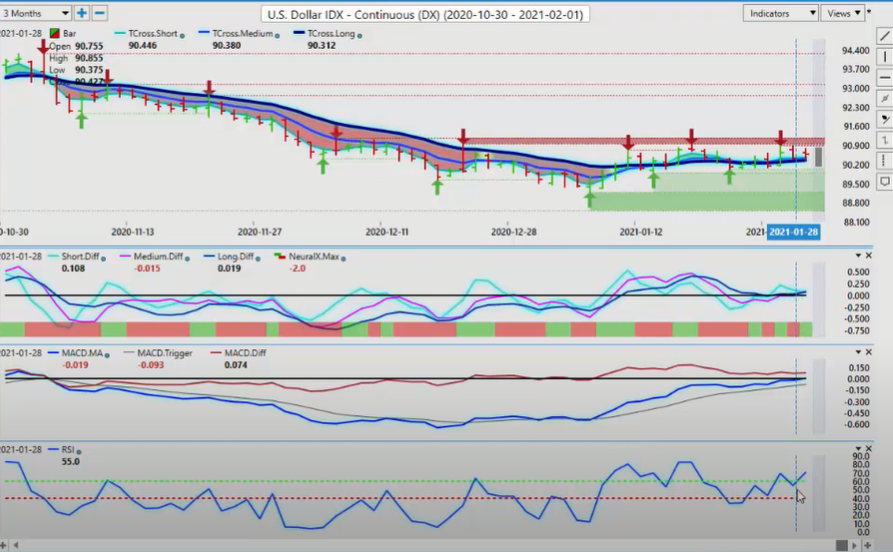
Now to get started this week, we’re going to begin again with that US dollar index, very, very important. Now the dollar continuing to ride along the key VantagePoint pivot levels, that coming in at 90.34. We’re moving back and forth between the verified resistance zones. Now we have three smaller zones that are coming in just below this major one. Now, this will be the trigger for further dollar strength in my respectful opinion. As again, if we can break this series of lower lows and lower highs, this is what we’re looking to do.
Now, the indicators from VantagePoint are certainly turning bullish here. We’ve got our short, medium, and long-term predicted differences above the zero line. Our neural index is green. Predicted MACD also looking good, but the position of the RSI is suggesting we have momentum. Now, Monday trading very often is a fake price. We get a big push and then on Tuesday it does the exact opposite. So what you want to watch this coming Monday is to see if the dollar is actually quite weak on Monday. If it is, you can expect it to turn around on Tuesday. However, that goes both ways here. If the dollar is very strong on Monday, then it’s likely to take a breather on Tuesday and then recover on Wednesday.
Now again, when we look at the inner market correlations, it’s very, very important here to gauge dollar strength.
Gold
If I can use gold as a comparative analysis, there is just no buyers. They have no interest in buying gold. I think a lot of the real money is going over into Bitcoin. Gold stalling out here. But that key level that I mentioned last week, 19.04, the yearly opening price, where I’ll again, put that back onto our charts here. But it’s just not even testing that. We are unable to break through this VantagePoint TCross Long at 18.65. This is proving to be very, very stiff resistance.
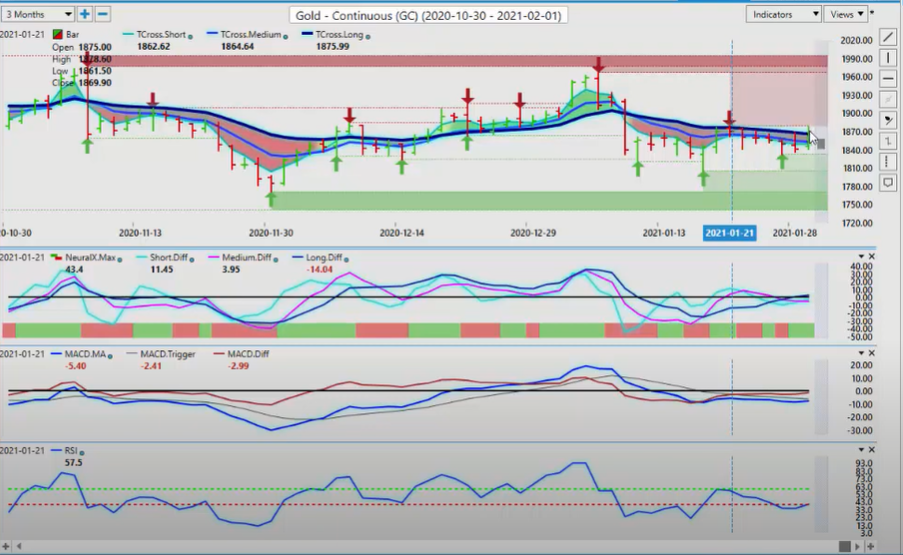
Now, once again, we look at the medium term crossing the longterm predicted difference to the downside. Suggesting here that gold is getting ready for its next leg down. More than likely we would see it move towards that low of 1804 this coming week. Now we do have the unemployment report coming out of the US on Friday. I’m not too concerned with it, guys. And the reason I say that is because with so many businesses shut down because of COVID the numbers aren’t really accurate to begin with. So I’m not going to put any real emphasis on the payroll number. You’re still going to see volatility, but it’s not that big as what it normally would be for me.
So right now, I’m looking at these inner market correlations. When we come back and cross-reference that to the dollar. If we also look at the dollar a year ago, you can see that the dollar is predominantly strong going into around the end of February. Now last year, at this time, we had a lot of things going on with COVID. We had a big sell off, than a recovery. But this basically, on March the 24th, started the longer term decline of the dollar over the 2020 calendar year. I don’t believe that’s going to happen this year. I believe the dollar is very likely to recover at least half of this lost ground that it had, putting the dollar index somewhere up around 95 mid year. That’s what I would be looking for. But of course, we must clear this very stiff resistance at 91 to get any move like that started.
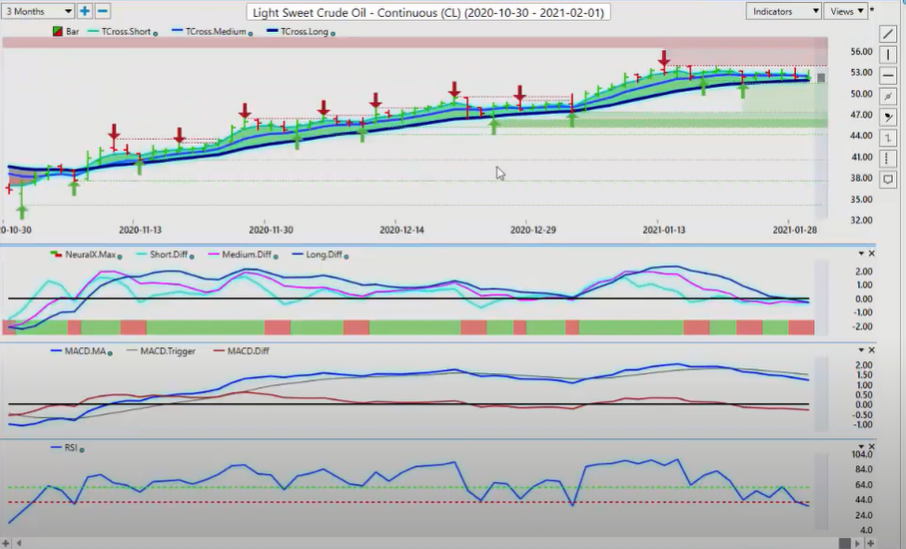
Crude Oil
Now, one of the other things we’ll look at here too, using these inner market correlations, is oil. Now oil is stalling out here, usually that inverse trade, dollar up, oil down. So oil is really, really struggling at this particular level. Our neural index is down. It’s showing we have momentum building to the downside on oil. This would trigger longs on US/Canada. It Would set off dollar buying probably right across the board here. So we want to keep a very, very close eye on that for next week.
And of course, what all eyes are going to be on is the S&P 500. Now again, unable to break through here. But as I’ve stated many times, I am extremely cautious with shorts. It looks like the perfect setup, all of these things, guys. But there’s so much interference from the fed with this S&P 500 that I just don’t trust shorts.
So for now, I think it would be reasonable to suggest that the equities are going to open up Sunday night, very, very bearish. But then I would look for a recovery by 11:00, 12:00 on Monday morning look for the equity markets to reverse. But I suspect the initial move on stock Sunday night in the Asian market is going to be very weak, probably a very violent move down. But look for this level here on these verified zones, down around 3633, assuming that we get down to that level 8, 9, 10 hours after trading opening on Sunday night. Then watch for it to pause down around this particular level. If we break under 3633, then I would respectfully submit. Once again, this is not a moving target, guys. We can see where that is. Having limit orders just below that, that may be a very viable option on shorts. But I suspect we will hold within the overall range. But the signals here from VantagePoint, again, very accurate.
S&P 500 Index
I pointed this out to my own direct clients and I mention that way back here on January the 11th, we hit on the S&P 50 about 3826. And to be perfectly honest, we’ve really done nothing since, except wander around here. Now, the medium term crossing the longterm predicted difference, one of the most powerful contrarian indicators that I have personally ever seen, was warning me not to buy this. Since that particular date we’ve gone through almost the entire month of January. And there’s been some very good intraday rallies here. But overall, since January the 8th, they’ve been forecasting that this is getting ready to turn lower. Now that signal is starting to progress here now. If we click on our F8 in our VantagePoint software, we can assess that basically the second we crossed below this blue line here, this started to gain momentum. At that time, the predicted RSI broke below the 40 level.
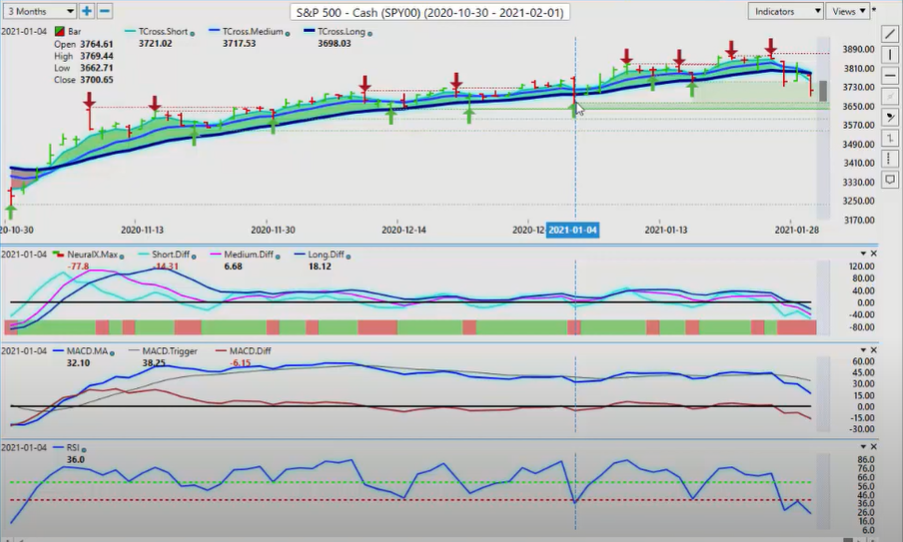
Where most people are using the RSI, stochastic, MACDs, accumulation, distribution, what have you, as overbought or oversold. In actual fact, it’s an excellent momentum-based indicator. So we look for that momentum to build to the downside. And sure enough, we got it. So the break of that blue line, the market closing below that blue line. The next two days after that, Thursday and Friday, we’ve come back up, hit the predicted moving average to the number, only to have a significant sell off. All the while, getting that warning sign at the beginning of January, that these equities are not strong. So we would look for further losses on equities. Just be very, very cautious when you, you get into Monday trading by mid day.
Now, when we go back up here and we look at, again, the all-important Bitcoin, I’ve talked about this, again, in the VantagePoint live training room with my own direct clients. I’ve been a very, very strong advocate for buying Bitcoin. Now, the yearly opening price on Bitcoin, I’m pegging it just slightly under $29,000. We can see we’re getting very good buying. Anytime we come down around the $30,000 mark and they really went after it on Friday. And that was interesting on just a little bit of dollar weakness.
Bitcoin
Now, again, what does concern me a bit with Bitcoin is remember what it’s trading against here, against the US dollar. So if we are expecting more US dollar strength in the month of February, then Bitcoin is unlikely to break above that $41,000 mark, our most recent high. Almost $42,000 actually. So I anticipate that Bitcoin will remain within the overall trading range between the $41,000 mark and then down right around this $28,000 mark, $29,000 mark. So we’ll continue to monitor that.
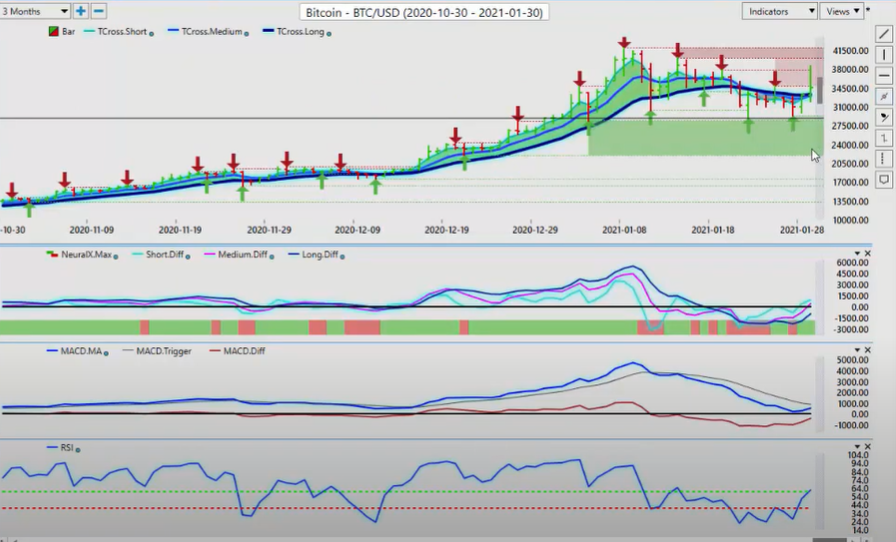
But the indicators from VantagePoint are, again, warning that this thing is getting ready to move yet again. So the predicted difference is rising. Our predicted RSI at 61.6, which is technically a breakout point or it’s warning that we’re going to get some strength here. So keep an eye on that. We’ve closed above the TCross Long. So everything here looks quite good for Bitcoin to continue to advance within the overall current range.
Euro versus U.S. Dollar
Now with the Euro/US pair, once again, I have not been an advocate for longs on this pair. Now, if we are to buy this, the verified zones have proven to be a very good place to do that. The lower end at one 1.2059. We’ve come down and tested this level multiple times. But we’ve come out of there each and every time. What we want to take notice here is that when we come back up, we’re getting all tangled up around the VantagePoint TCross Long in these predicted moving averages. They’re not allowing the market to penetrate through there. I can see yet another sell signal starting to form, even though the Euro is rising.
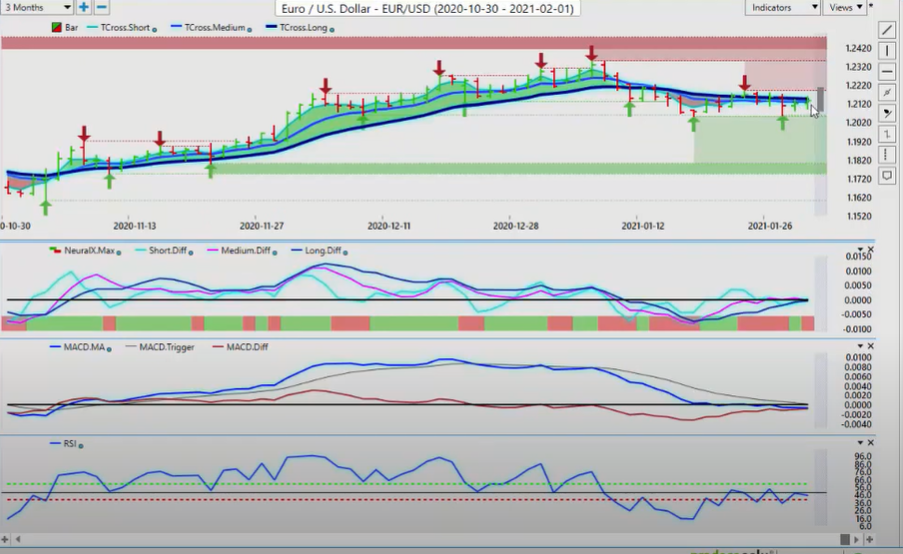
On Thursday and on Friday, we can see that the VantagePoint medium-term crossing the long-term predicted difference in the neural index, despite them being up days is warning us that basically we’re range trading with a very slight bias to the downside. Now, one of the key factors you want to watch when trading the Euro is watch gold very, very closely. That is why I’ve refused to put out long trades to my own direct clients this month because of those gold contracts and basically a 95% correlation to the Euro. So if gold is not going higher, long story short here, guys, gold doesn’t go higher, neither does the Euro. So we’re still within the overall range. But I believe that, again, that this 1.22 level is likely to hold going into next week.
British Pound versus U.S. Dollar
When we look at the pound dollar, once again, the pound dollar, you can see it’s moving up. And it’s moving up in a very orderly manner here. You can see it’s almost like a set of steps, walking up a set of steps. These are the kind of trades we like. We don’t like trades that go by way of the elevator, so to speak, where they go flying up and flying down really quickly. This has been a very moderate move here. But it’s been a very consistent move here, ever since VP has called this long trade back here in November.
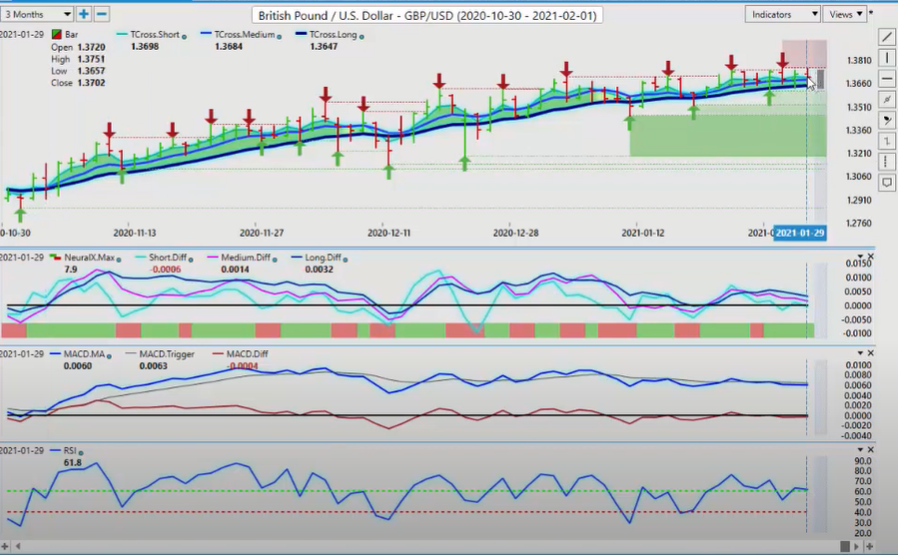
My concern at this particular time is the virus is going after the UK. They’re having problems there. There’s still some unresolved issues with Brexit trade stuff. So the other main thing that concerns me is this signal right here, this pink line over this blue line, the medium term, crossing the longterm predicted difference. This is just like the S&P 500 here, guys. It’s warning me to be very, very cautious with long trades up here. Because the medium term trend is weakening against the longer term uptrend. That’s usually a signal that we’re going to correct lower. Which we have. We’ve come down and hit the VP TCross Long two days in a row, and we’ve bounced out of there. But it was a very shallow one on Friday. So again, watch out for longs up here. I think a short trade is imminent here.
U.S. Dollar versus Japanese Yen
Now, when we look at the dollar/yen going into next week, we still get a bullish signal. In my respectful opinion, this is the one you’ve got to keep your eyes out for. This level up here at 1.0476 has proven to be very, very stiff resistance. If we can clear this, and you can see how sneaky this market is, we got above it, but we couldn’t close above it. If we can close above this level, preferably two days in a row, that is going to open up the door back towards the 1.06 area. I think right now that’s a very, very likely outcome. When we look at the predicted differences, they’re both pointing upwards. We’ve got the predicted differences pointing upwards, excuse me, with the neural index. The predicted RSI breaking through that 60 level. And you can see the market accelerating through that particular area.
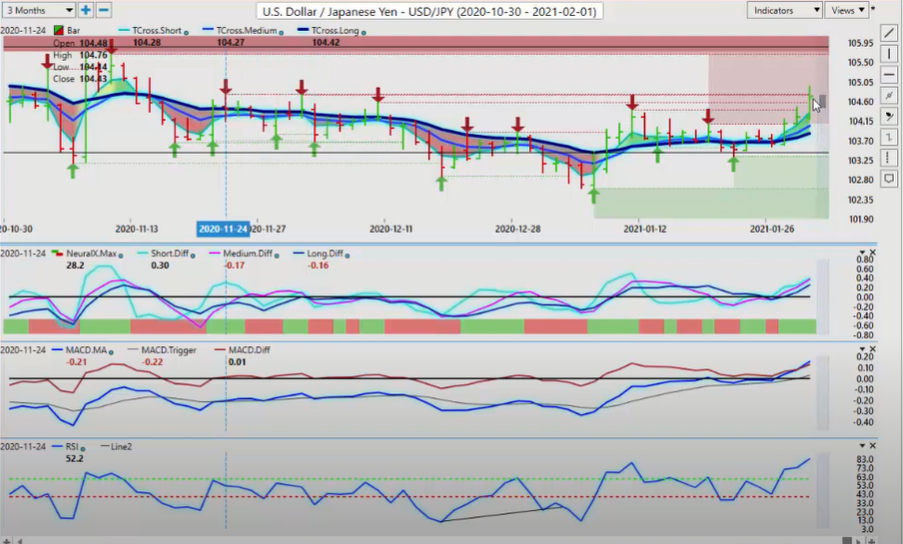
Now, one of the areas too, that you can assist is put the blue line on by itself. And you can see, once the market cleared two days in a row, closing above this blue line, we had a very significant move off of that 1.0420 area. So again, using that predicted moving average as a daily pivot level for a potential entry point is a Van-tastic way to use the software. So again, I would look for further gains. Just be careful around the same thing, gold and equities. The yen has a very high correlation to gold. If gold is going down, the yen is weakening, which makes that dollar/yen go higher. That’s how that this trade works, guys, using those inner market correlation. So keep a close eye on these verified zones too. That’s the final piece of this particular puzzle. Can we get above here and stay above here? I’m optimistic. But that optimism remains guarded because the yen is such a volatile currency.
U.S. Dollar versus Canadian Dollar
Now, as we come into our three main equity-based currencies, starting with the CAD, we have the unemployment numbers coming out of Canada on Friday. Surprisingly, Canada’s GDP, wasn’t too bad. But Canada’s got a few problems here right now. Particularly, well, we’ve got a Prime Minister that’s just one scandal after another. This is fact not fiction. Every week it’s something with this Prime Minister that some scandal is forming. He’s really messed up on the vaccine front. We’re out of vaccines. The COVID virus is running rampant here. So in Ontario, where I am, alone over 2,000 cases per day, death rates going up. So Johnson&Johnson, it’s my understanding, we may have secured some of the new dose, maybe in the next couple of weeks. We’re going to have to see.
But the unemployment numbers, again, that are coming out of Canada on Friday, just remember that they’re going to be like the US numbers. They’re going to be skewed a bit because we’re in lockdown. Most of the cities in Canada right now are in a physical lockdown. So people aren’t going to work. Businesses are shut down. So again, I’m not going to put a lot of weight on that Canadian unemployment report. I’m more interested in getting the vaccine issue resolved, moving forward here.
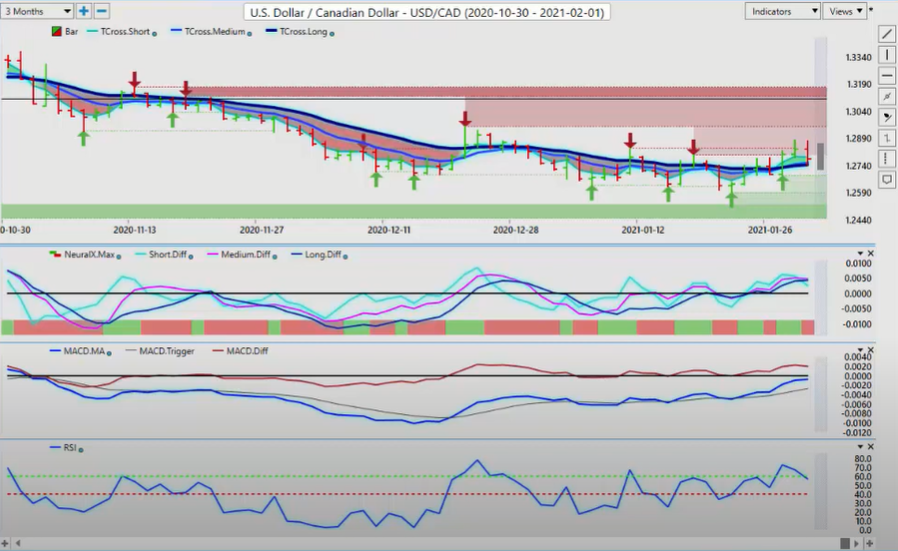
And again, I think we’ve got to be very, very cautious with these inner market correlations too. What I mean by that specifically is if oil inequities turn, then again, the fundamentals aren’t going to matter anyway. The inner market correlations will take hold. If oil goes lower, it’s going to take the Canadian dollar with it. And if the S&P 500 sells off, that will hurt the Canadian dollar also. Those, despite all the fundamentals that I’ve talked about inside of Canada, the grossly incompetent Prime Minister in Canada, meaning Trudeau, then none of that matters. The only thing that matters right now to this Canadian dollar is that stocks recover and oil recovers. If those two things happen, the Canadian dollar will strengthen again. And you will see the pair go lower. But if stocks and oil tank, the US/Canadian pair will move up very aggressive. Mid-year, I’m targeting the 1.34 area. I’m not sure that this is the turning point where we go higher. But there are some technicals, some inner market technicals, and certainly some fundamentals that could weaken the Canadian dollar, at least in the near term.
Australian Dollar versus U.S. Dollar
Now, almost everything I said is identical to the Aussie here, guys. So when we look at the Aussie, the thing we want to look at here is that it too, like the Canadian dollar, is under pressure because of the S&P 500. There is a correlation to oil and the Aussie dollar. And I do want to just come back to the US/Canadian for one pair, for one minute here. Now, down around this level right here, with your VantagePoint software, I would really recommend that you draw a line on here, which is the yearly opening price. I believe it’s around 1.2714. So that level, on Monday and Tuesday of next week, you really want to watch that very closely. And you’ve got the VantagePoint TCross Long at 1.2743. So again, that yearly opening price is a big, big deal at this time of year. And the trigger, again, is going to be those commodities and equities, the S&P more specifically.
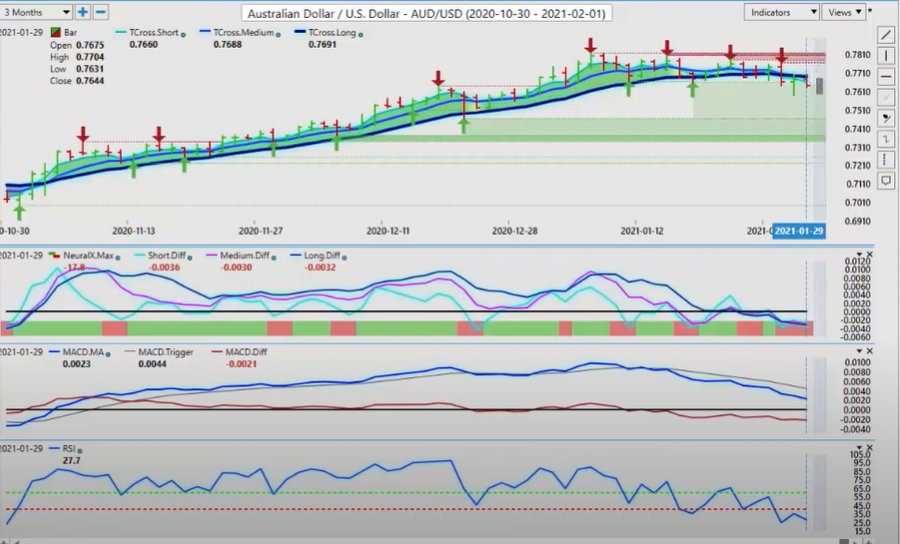
So right now we have a sell signal, a strong sell signal forming off of the Aussie. Now this could reverse very quickly if we get stocks moving back to the upside, the Aussie will follow. But we did have a recovery a little bit there on Thursday in stocks. But it came right into the TCross Long at .7696, and the Aussie went down again. So we’ve got to be careful here, guys, with this particular pair. The US/Canadian, the Aussie/US, the New Zealand/US. A very, very similar trade.
New Zealand Dollar versus U.S. Dollar
When we look at New Zealand right now, it’s clinging like a life preserver to this key VantagePoint level. We’ve got a monitor this area. We’re between two verified zones, the verified resistance and verified support. So once again, when we’re looking at this right now, we’re saying off the open, we’re going to come into the lower end of .7096. But then we’re going to see if stocks can turn around. So always remember indicators are fun but trading is very hard. So we’ve got to make sure we understand the driving factor of these three currencies. Because I’ve seen these inner market correlations. I’d been using the VantagePoint software over 20 years now, and I’ve seen these correlations. But I’ve never seen the Aussie, the New Zealand and the CAD so heavily correlated to the S&P. And in fact, most days when I’ve got my predictions from VantagePoint in the evening, when the trading bell goes off, I actually have the S&P 500 chart opened up to look at these pairs because it’s a driving force here.
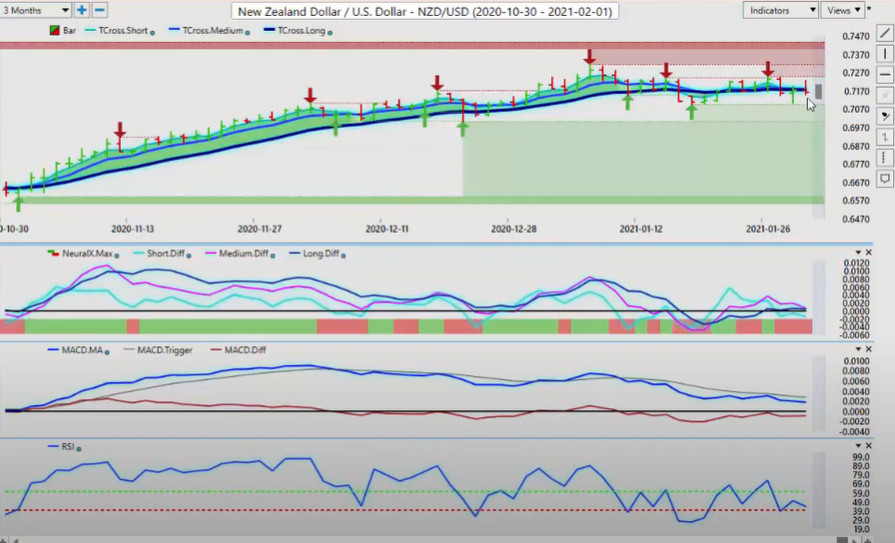
But again, this may decouple somewhat. If we can get this COVID virus under control. Which I’m hoping we can do here in Canada. I’m hoping we can do it globally. I think that Australia, and I believe it was New Zealand, I think, correct me if I’m wrong, but I think it was around a five week lockdown. And they’re doing pretty good right now. So that may be something that we may have to end up doing here in Canada also. It’s very difficult to say at this time.
So with that said, this is the VantagePoint AI Market Outlook for the week of February, the 1st, 2021.
Are you using A.I. yet?


