The Hot Stocks Outlook uses VantagePoint’s market forecasts that are up to 87.4% accurate, demonstrating how traders can improve their timing and direction. In this week’s video, VantagePoint Software reviews forecasts for W.W. Grainger and Co.($GWW), Boeing ($BA), United Health ($UNH), Franco-Nevada ($FNV), and Intel ($INTC).
Register for a Free Live Training
Hello again, traders and welcome back to the hot stocks outlook for May 7th, 2021. Hope you all are having an excellent week out in the financial markets, and as always, plenty of opportunities to take a look at here today. We’re going to start out. We have shares of W. W. Grainger, UnitedHealthcare, Boeing, Intel, and lastly, Franco-Nevada, which is a stock that we’ve brought through several times over the past several weeks, And a really good example of how the VantagePoint forecast can really benefit traders in this environment.
Starting out with shares of W. W. Grainger, though, what we have here is daily price action. Every forecast that use within VantagePoint works the same way off of end of day data. So, each one of those candles represents a full and complete trading day. You’ll notice that there is a black line and a blue line placed right up against that price data. Now, the black line that you see there, that is a regular, simple moving average, or what we refer to as the actual simple moving average, but simple moving averages are very common technical indicator, and they act as a good measure of where market prices have been in the past.
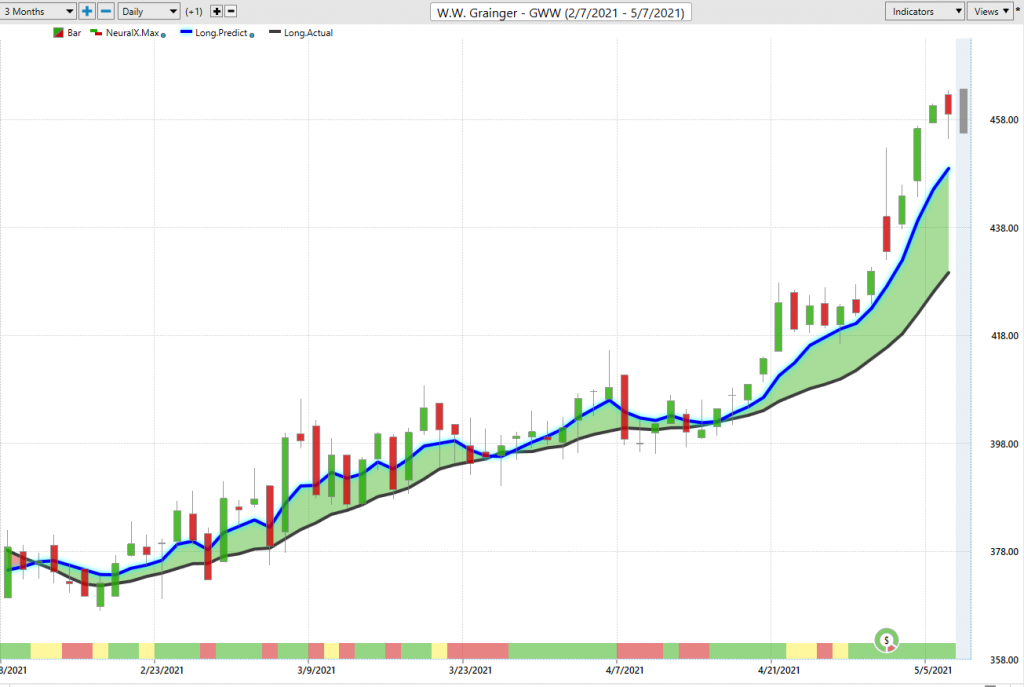
So, it’ll take the last 10 close prices, add those together, divide by 10, and it smooths out the price data, so you get a good measure of where market prices have already been over the previous price action, but obviously, a trader needs to understand, where are market prices moving going forward, so we can be ahead of any move in the market? Now, what we’re able to do is actually compare that black or actual simple moving average or that lagging moving average, you can think of it, but what we’re able to do is compare that to this blue line.
For that value to get calculated and then plotted on a chart, every single trading day VantagePoint is doing what’s called intermarket analysis, and it’s utilizing its technology of artificial neural networks to do that. What that means is, it’s utilizing a type of artificial intelligence to look for related markets and important market relationships. For W. W. Grainger, well, this is going to be different ETF groups that are in this area or sector of the market, that can be individual stocks, that can be things like the dollar index, interest rates, global futures and commodity markets.
Particularly to Grainger, the artificial intelligence has identified which markets uniquely affect this stock’s future price moving forward. What it’s able to do is actually look at those relationships and generate true price predictions, so things that have not yet occurred as far as where market price is headed. So, what it’s able to do is take those true market price predictions and use those to actually generate and construct the value of these indicators, turning what was a lagging indicator that just gets plotted around for most recent close prices into an actually forward-looking predictive tool that’s looking at those market relationships and making a true forecast of where things likely to head and with a very high level of accuracy.
Whenever we see that blue line cross above the black line, it’s suggesting those average price are likely to start moving higher and you’d therefore want to go ahead and get long. Now, truly round out the entirety of the forecast, you’ve got the overall trend here with your predicted moving average. At the very bottom of the chart, you’ll see that you have this indicator that goes from green to red, and this is again, utilizing that technology of the artificial intelligence, but tunes to a specific timeframe, only looking ahead 48 hours at a time and looking for short-term strength or weakness over that subsequent price data.
You can think of this as a very short-term strength or weakness indicator just over a couple of candles. Then, at the very right of the candle or right of the chart, you see that there is a shadow candle here. That’s actually an intraday prediction. Again, using the technology to now look for a different timeframe, now intraday, and a prediction of the predicted high and a predicted low. So, you have the overall trend direction, short-term strength or weakness, as well as that predicted high and low range to help guide you, and so once you identify that, okay, Grainger is a stock where I potentially want to get long, well, now you get not only a forecast, but updated information every single day to help guide you and say, okay, well, if you want to be a buyer in this market, look to be a buyer, buy down at these predicted lows.
You see that we actually don’t hit any of those predicted lows, somewhat of a rarity to not hit any of them here. You see, you get very close, but the point being that you have this roadmap that says, look, try to buy at or near these predicted lows. Very clearly the blue line remaining above the black line. You also see here this Neural Index goes bearish, and that’s where you see the sidewaysness, right? That’s where the market runs sideways, but a trader, when they see that and understand, look for cheaper prices, this doesn’t invalidate the overall uptrend and you see the market doing very well and continuing to the upside.
Now, making this a hot stocks outlook, we have a lot of mixed opportunities. Here you see something like Grainger moving up 13.5%. We’ll go to the healthcare stocks have actually done really well as well, have done well. But this past couple months have been very interesting, and you’ve seen that the Russell has hit a wall, stopped advancing. S&P has kept climbing higher, but you’ve seen a very mixed picture in the market and you’re seeing very important markets start to make some very important moves, big moves in dollar, but here’s UnitedHealthcare. So, at least another example of some of these bullish opportunities where the software is saying, look, we have these crossovers to the upside, blue line over black line, and then come in and again, use those predicted highs and lows to help guide a position like this.
Over the past month here, if you want to be a trader, you can at least say, okay, UnitedHealthcare, here’s an area where at least looking towards these intraday predicted lows, it might not be a bad idea. Now, you want to tie that in with your timeframe. What are you? A trend trader, or a swing trader, or are you just here for the day or trading options? But very clearly here, we’ve seen this whole grouping of stocks, Humana, UnitedHealthcare, all of these healthcare insurance stocks start to move higher, and we started to see those indications really at the mid point in April and seeing that blue line cross above the black line and saying, okay, well, this is an area of the market you can pay attention to and benefit off of those subsequent forecasts as the trade progresses.
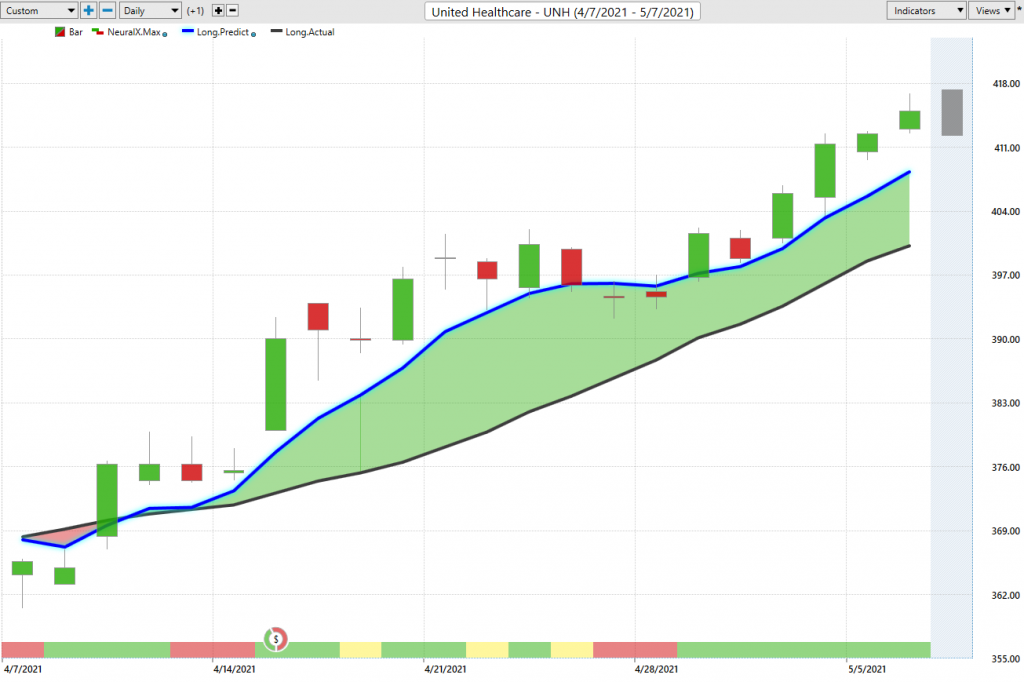
I’m trying to draw it to this point of the situation that we see in UnitedHealthcare of these healthcare stocks moving up. Well, that’s what we had in gold stocks, and now you’re seeing gold, the commodity, and those individual stocks doing very well, but this is something we identified all the way back in March, believe it or not. This is really where these tools are going to be certainly helpful, but moving forward here, there’s a couple of bearish opportunities. You’re seeing some pretty big important areas in the market that just aren’t fairing well, and it’s very clear that you want to either short hedge your portfolio, would be another way to go about that, but that this ultra bullish … I sort of think back to November of last year, very bullish period.
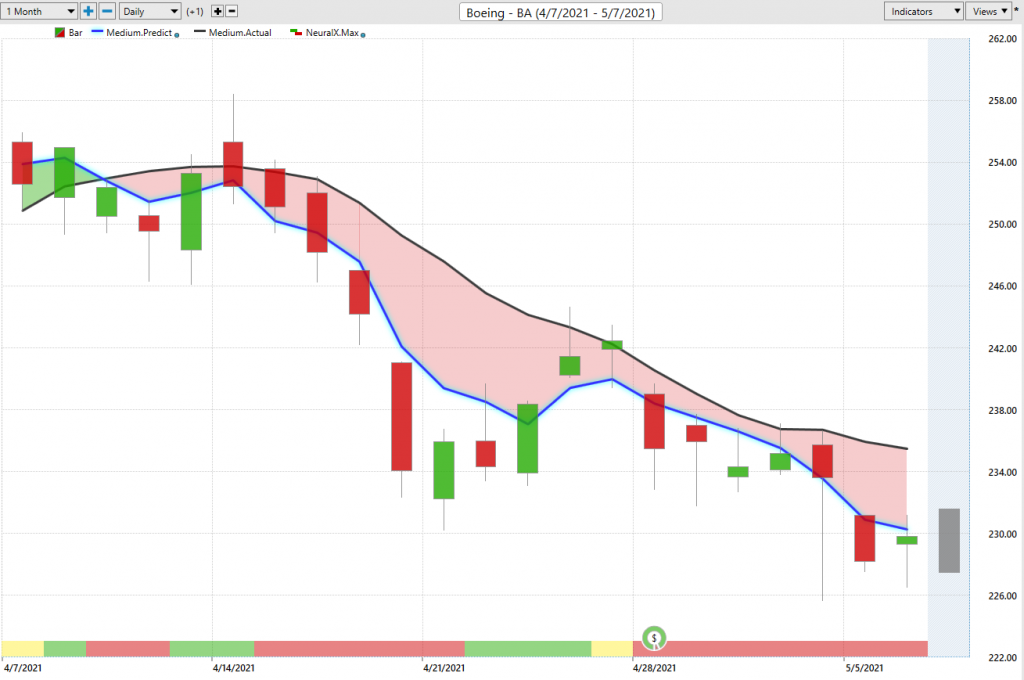
Get long, buy stocks, only be long, net long your portfolio. Things are shifting around here now, and you really need to be aware of that, and either hedge your portfolio or just short the market. Here you see Boeing cross over to the downside, Neural Index bearish. You see you get these bounces where the Neural Index gets bullish. You get some higher highs over the subsequent 48 hours of price action, but that doesn’t change the bigger picture of the trade. So, what’s really helpful with VantagePoint is, form a directional bias on the market. Know you only want to be shorting or going long and taking profit, however you want to manage it directionally.
But you see here, that when you have that guidance, it says, look, if you’re looking intraday, it’s at these predicted high levels where you’re really getting a good intraday price, and of course you want to deal with the volatility appropriately and understand that, hey, in something like here, you may get a big bounce, expect some higher highs again, over those subsequent 48 hours of trading, but the overall trend is still very much to the downside and you’d only want to short and take profits on those short positions.
Here we see Boeing really nice decline here, about 10% or 11% moves from where those crossovers came through.
But clearly, everything is not straight up, very bullish. We’ve seen the S&P growing to those new highs, but like I said, you see the Russell, you see the NASDAQ finally gets back up, and there’s some issues out there, and you definitely need to be careful.
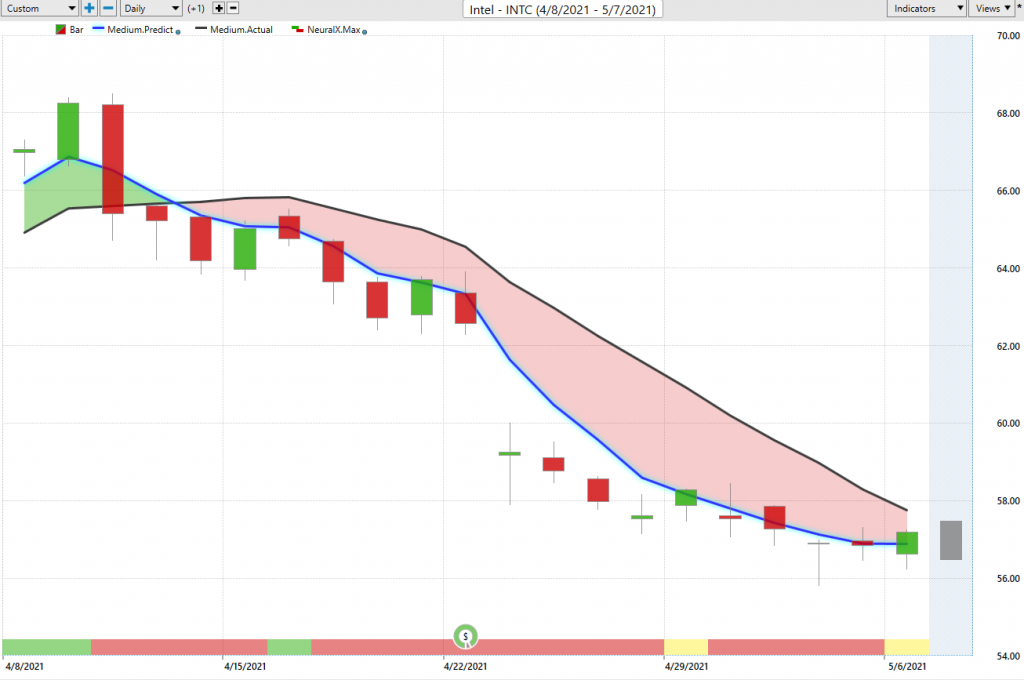
Here’s Intel. Here’s a crossover to the downside, very much like Boeing, and you’re seeing a lot of these correlations, whereas a couple of weeks ago, where a lot of these stocks started to turn lower, and you just see how bearish this whole forecast is of pretty much every day for the past month, it’s been very clear. Short Intel, take profits on shorts, it’s the only way to go.
Of course, intraday, you’ve got this guidance from the predicted highs to at least get a good price level. So, as a trader, you don’t have to risk a whole lot to benefit by targeting predicted lows, or better yet, here being a trend trader, you get that gap is really where the big money gets made, but multiple opportunities here where those pushes up towards a predicted low, subsequently moving down … From the predicted high moving towards a predicted low, and of course being a profitable short opportunity. Now, here’s really the big thing.
There’s these very big macro important market relationships going on. I want to bring in Franco-Nevada, because it’s such a great example of the obvious ways VantagePoint is effective. Whereas, looking at individual stocks, it might not seem obvious of, what is the software picking up on? What are these intermarket relationships? How’s it looking at ETFs and all these things? Well, when you’ve got a stock, like a gold mining stock that mines other metals and things like that, well, you know that, well, what’s going to drive future prices of Franco-Nevada? Well, it’s going to be things like the gold market, it’s going to be things like copper, it’s going to be things like ETFs and gold mining stocks, individual stocks.
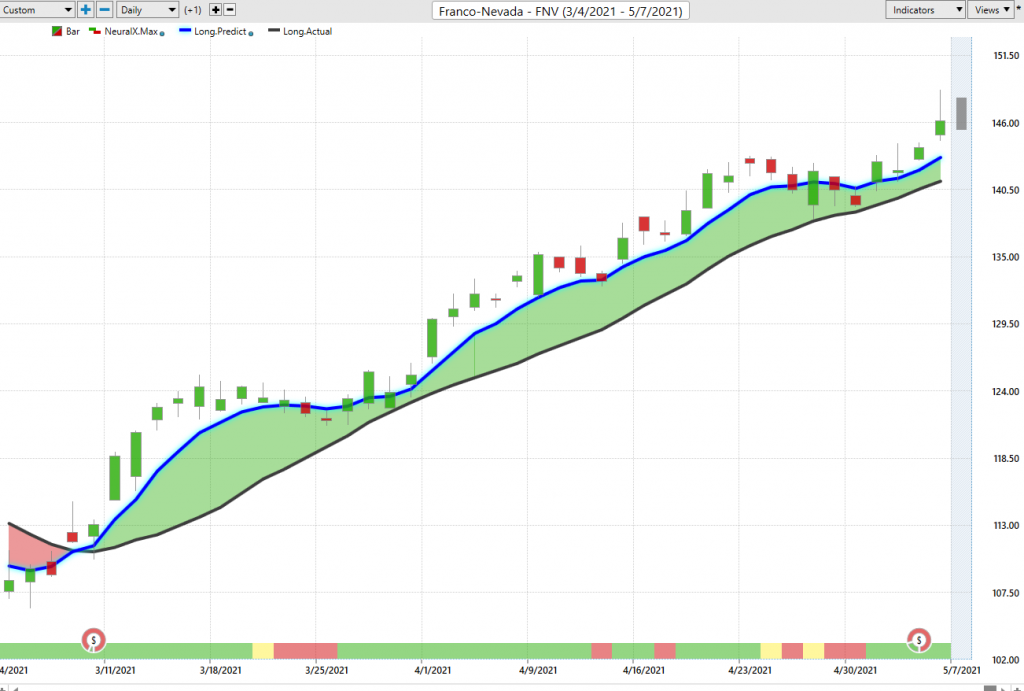
It’s going to be things like dollar index. It’s going to be things like global interest rates. It becomes very obvious how all these very important markets are going to clash and drive the future price of Franco-Nevada, but the important thing is saying, okay, well, I’ve got a tool that says something’s going on in gold mining stocks all the way back here at the beginning of March, and specifically, tools that really show Franco-Nevada is really the strongest looking opportunity here. We’ve got crossovers to the upside, Neural Index, a lot of strength.
It just makes it so that, okay, well, if I want to benefit from the situation going on in gold mining stocks and gold and precious metals, well, Franco-Nevada’s where I can do that. So, you can understand that here’s the bigger picture, but then go in with that shorter term view. You can see that, what this is, is the actual predicted high and low predictions against the actual market trading day. What’s going to happen here? Is you’re going to see the actual market data, and I’m bringing this through because gold is breaking out, and therefore you’re seeing this market actually start to break out.
But the point being that these are the actual predictions before the actual trading day. When you understand that this is an area of the market you want to trade, similarly like UnitedHealthcare might be an area of the market you want to trade, what you understand is, every single day, you’ve got a forecast that’s letting you know that, well, if you want to be a buyer on this day here, well, predicted low, that’s where you want to be paying attention. That’s where your focus wants to be. That’s where you can think of the opportunity is, the real opportunity to actually make some money, buy at one level and sell at a higher level.
You just see how this is not a short period of time we’re talking about here. This is two full months of trading in a particular stock, that if you go back and watch the weekly, or the hot stocks outlooks here over the past several weeks, I keep bringing these gold stocks through, I keep bringing … This is an area that we want to pay attention to, and when you can answer that question of, where should I be paying attention? And we answer that question with the help of a lot of our scanning features that all came through back here in March and said, something going on in gold, that came through recently in United healthcare and said, something’s going on in these healthcare stocks.
Then you understand that, well, now I have a place to trade, but also a roadmap to guide me as every single day trades at … What happens here as the day closes, we get the end of day close, and then the software is doing that analysis looking at all those intermarket relationships of, what happened in gold? What happened in the ETFs? What happened in stocks? What happened in dollar, and how is that going to affect us moving forward and how we might want to manage a trading opportunity? Just a really good opportunity to bring this through and highlight what, again, we’ve really recognized for now a couple months.
If gold really breaks out here, you could see these things really benefiting over the next couple of months as these trend continue. Once again, this has been our hot stocks outlook for May 7th, 2021. Thank you all for watching, best of luck to you traders out there in the markets. Thanks again, and bye for now.