Welcome to the Artificial Intelligence Outlook for Forex trading.
VIDEO TRANSCRIPT
Hello, everyone. Welcome back. My name is Greg Firman and this is the Vantage Point AI Market Outlook for the week of August the 23rd, 2021.
Bitcoin
Now a very choppy volatile week again with the Fed minutes not really matching the previous Fed statement, leading to a pretty strong move in the US dollar at the end of the week, but some of the other markets are moving strong also, so we’re going to look at things a little bit differently this week. Now what I’ve talked about over the last several years, Bitcoin, being the top investment over the last 10 years, with an annualized return of about 230% per year with some choppy years up and down. But what we can do is we can benefit from anything that’s related to Bitcoin using intermarket analysis. So when we look at this right now, what I’ve done is I’ve split the screen on the chart, putting BTC, Bitcoin, against the US dollar, and then matching it up to other markets in the stock market, the ETF market.
Bitcoin vs. US Dollar
So we’ll have a quick look at this, but we’ll also do a comparative analysis between Bitcoin and the actual US dollar. So if we look at Bitcoin versus the US dollar, we can also see we have GBTC, Bitcoin Investment Trust. Now, this has made a very, very strong move over the last several years, going from a couple of dollars a share up to almost, I believe, almost $60 a share, but that’s being driven by the main market, Bitcoin versus the US dollar. We can see we have HIVE Blockchain Technology. This is a mere, almost bordering on a penny stock, but we can see that over the last several weeks, over the last, I could argue the last month, for example, this stock has almost doubled in value. But based on intermarket analysis and intermarket correlations, we can understand that they’re moving up and down together.
Ethereum. Zcash. Ripple. Neo. Monero
So if the main market, Bitcoin versus the US dollar, is doing well, then the stocks, the ETFs, are also faring very well. But what about the other digital currencies like Ethereum? You can see that it’s done very, very well, moving basically tick for tick with Bitcoin. Then we have Litecoin, not as good, but still pretty decent. Then if we come down to some of the other ones, we can look at, for example, Zcash that too, 98% correlated to Bitcoin. Ripple, same thing, Neo, and then we have Monero. So there’s a number of different markets that we can use, including even the ETFs, like GBTC. But if we look closer at this and we, to some degree, pull, peel the onion back maybe a little bit, is we can see that when we look at the US dollar itself versus Bitcoin, as I’ve often stated here, that I’ve noticed that there’re significant periods when these two correlate to each other, where they’re actually both positive.
US Dollar
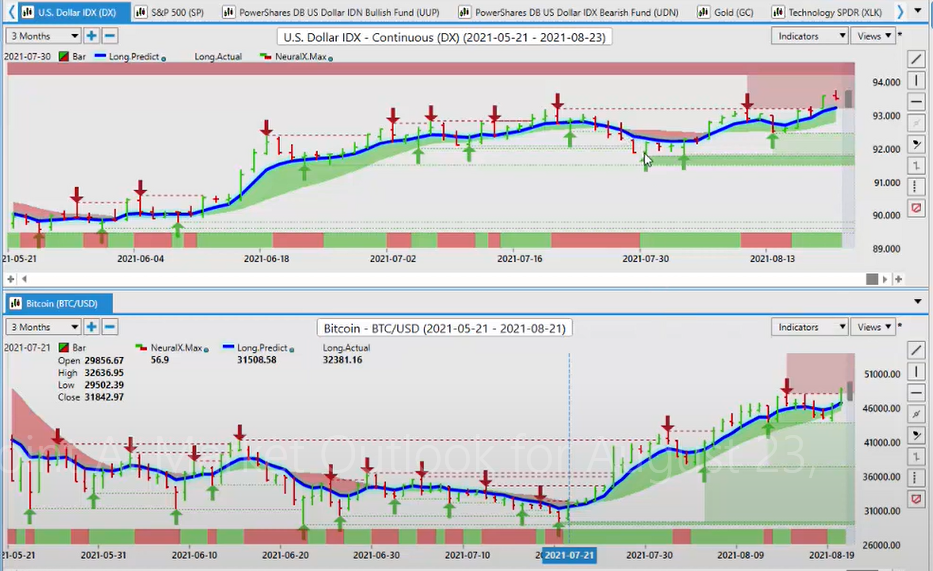
So if I look at this and I put a specific date to this, I can look at this and say, “The beginning of August, we’ve had a very strong move starting on the dollar,” but that has also led to a very strong move in Bitcoin, in my respectful opinion only. What I’m looking for is for this correlation to break down, and actually Bitcoin to move forward, and the US dollar to continue its broader downtrend over these many years. Once again, a very interesting article on the Vantage Point blog about fiat currencies, and it explains it very well. And it makes reference in that article to Bitcoin. This simply follows that up with the analysis to point out there’s many, many different ETFs, stocks, and even some of the main currencies in ETFs that can correlate to Bitcoin also. So there really is multiple, multiple trades coming off one single market if the savvy trader knows what to look for.
So if taking that into consideration, and we go back to our main forecast here, we can see that the dollar is actually having a pretty decent week here. And with that, the move up we’ve set a new high on the year. My concern here, the high at 93 74 is great. The dollars moved up, but also, in my respectful opinion only, I really wish that the Fed is forced to release the minutes the same day he releases the policy statement because they never match, and it causes excessive volatility in his constant flip-flopping as to what they’re going to do. Now we have Jackson Hole this weekend. And I’m sure he’s going to flip flop again. So the start of the week is likely going to be a choppy one, but what we can assess from most charts like this, whenever we make a new yearly high, there’s often a very significant pullback.
So to begin the week, the dollar, you can see once again, the indicators we’re using this week, I’ll simply bring those up so everybody can see the 52-week look back is modified to 33. We’re using bars, not candles, short, medium, and long-term predicted difference, the Neural Index, the point in time is set to the weekly open, so the weekly opening price, which is used very similar in the way that I use the yearly opening price that I’m looking for price to hold above the weekly opening, if it’s actually bullish. If it slips below it and stays below it, usually by midweek, we can start to see market sentiment changing. So it’s a very useful indicator, to say the least. The predicted RSI that’s been modified to a nine period with a 60/40 split. We are not using it for overbought and oversold.
The triple EMA cross, and of course, the verified support and resistance zones, which point to us here and still warn us to some degree of the 93, 43 level. You can see this dollar index was very sneaky and that it made a big move, but it actually closed the week below that level, which is again very interesting. And these are the kind of games that are being played. When we look at this, the predicted differences have crossed to the downside, which did lead to about a four day move down. Then we had a violent turnaround. I could even argue that to some degree, I would even suggest that maybe somebody knew what those Fed minutes were going to say, and that there were a number of dissenters in there. So again, we look at these things from an analysis standpoint, but the predicted differences have crossed, the pink line and the blue line have still not crossed back to the upside.
The RSI is warning us that we’re losing a little bit of momentum here. So again, understanding where your key levels are to begin your trading week, 92/87, as long as the dollar is above that level, it remains bullish. We then click on our F8 Tier, we get an additional pivot level of the long-predicted the T cross long was the other level, excuse me. This is the long predicted 93/21. Then of course we have the 93/43, but in my respectful opinion only I want to see the dollar index hold above 93/40 if we have any chance of taking a run higher towards the 94/70 mark. And again, when we back out our vantage point software, we can pull those additional verified zones. They go back upwards of 10 years to find these failure points in the market. So it gives us an additional point to target here.
Bitcoin

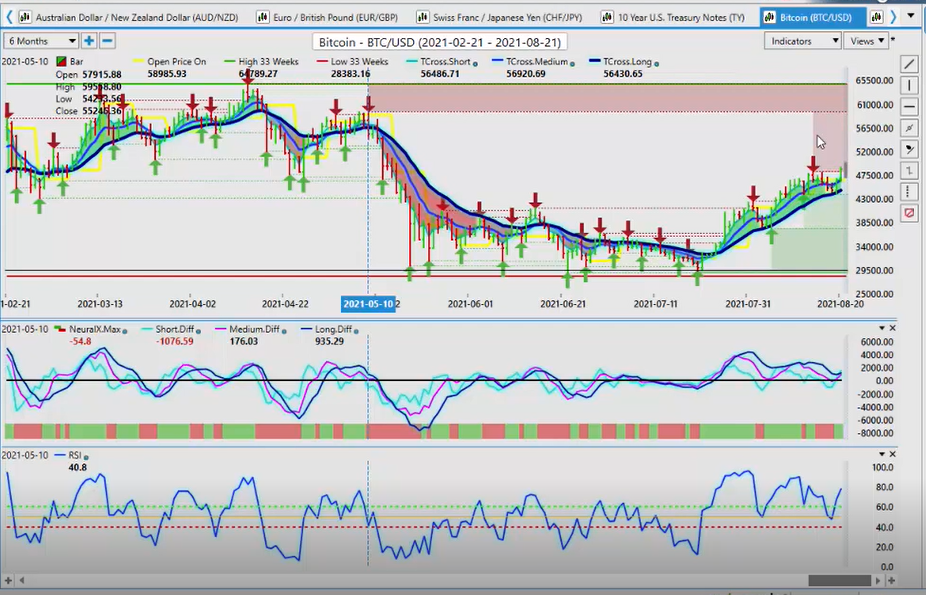
And again, my optimism that we can get up here with the dollar still remains very, very guarded to be, to be perfectly blunt here. So again, we will monitor that, but the next targeted level, if we can hold above 93/43 would be in these levels here around 94/30 and then 94/70. But you can see as the shading and the color and the verified zone goes from a very pale pink color to a slightly dark, darker pink color, then more or less a hard red color suggesting very, very heavy resistance. Now with that, with that dollar rising again, I think it’s wise that we do look closer at Bitcoin because we can see that we had another verified resistance that had formed at the high at about 48,190 but we managed to clear it and close above it. The next verified resistance high is 59,000 and change, which you can see.
There is very little headwinds up here and it looks like Bitcoin is getting ready to make yet another move back up to this. Now I’ll remind everybody we’ve had multiple, multiple opportunities to buy this thing on a dip between 33,000 and 29,000. The two respectful yearly opening price. One, the futures side, the other one, the yearly opening price, which is the Coinbase side. Coinbase, obviously operating as I speak on Saturday. So that price, you can see that vantage point is updated their traders for today’s trading, even though a large number of us don’t have access to that because we’re trading futures or CFDs or through the ETFs or stocks, but still, it’s good that we get these updated prices. But again, we are moving higher from Friday and it looks like we’re in line for at least another test, close to this 59,000 mark.
S&P 500
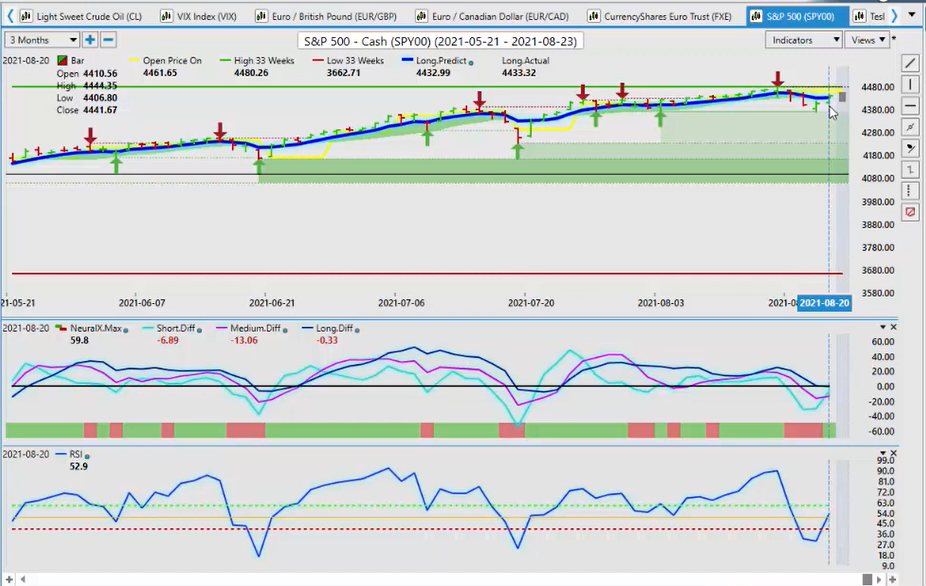
Now, with a bit of a bumpy road for the equity markets this week, they still finish the week pretty strong in my view. So again, we had to push down the market. The talking heads came out of the woodwork, saying stocks are dead. They’re done. And pretty much as they were saying that, stocks were already starting to turn around. So this could be a leading indicator that the market’s got a little bit ahead of itself, with the US dollar should the SMP 500 hold above the key vantage point level of 4421. We also have the F8 here, which is also very important. The long-predicted 44/32. If we can hold above these two levels, stocks recover. That is likely going to put a little bit of pressure on the US dollar again. So keep a very close eye on that, but we can see our technical indicators.
Gold
The predicted RSI has retaken the 50 level. The predicted differences are starting to turn back up and we’ve got a neural index, but one thing I will warn stock traders very clearly is something is likely going to come out of this Jackson hole meeting this weekend. And it may not favor stocks. So keep an eye on the news headlines and be very cautious at the beginning of the week. Now, with gold again, Gold’s arch-nemesis is no longer just the US dollar it’s obviously Bitcoin is causing a lot of problems for gold, and I believe that’s why gold is stalling here because money is actually not going into it. The charts clearly tell us that money is real money. You can argue speculators too, or some will argue it’s just speculators, but not with these kind of moves in my respectful opinion.
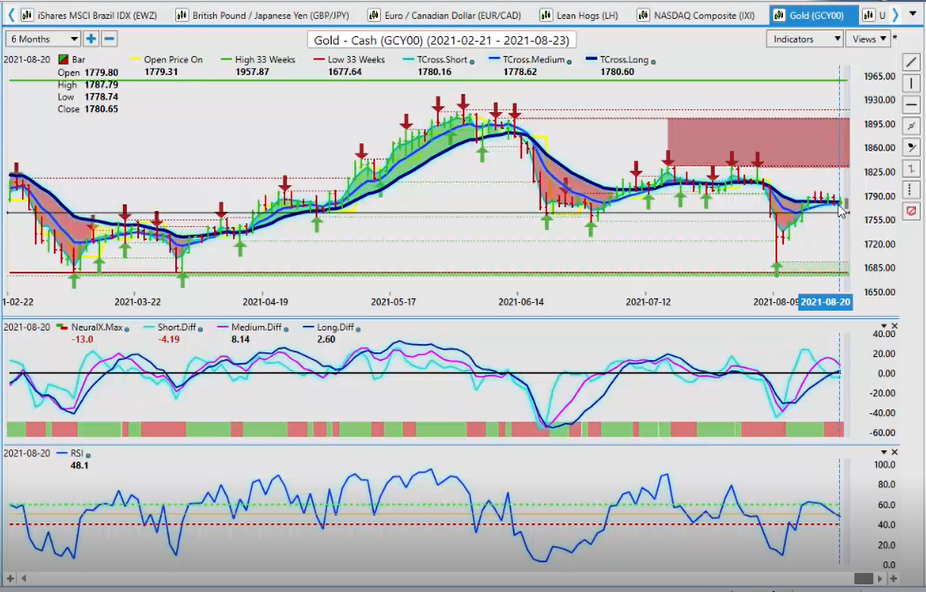
Again, only it is some institutional money. Corporations hedging their inflation risk with Bitcoin, not gold. So for now, if we go into a risk-off scenario here, you would think that gold would rally, but the dollars got it pinned down and so does Bitcoin. So right now we’ve got heavy support and resistance all-in rate, in and around the 1780 mark. We’re looking for the market to break free and clear of this level to see if we can get some kind of trending move on gold, but respecting the Delta variant and the hospitals in the US getting a little overwhelmed in the Florida area, then there is still light at the end of the tunnel and gold still could move back up, but I would like to see it above 1830, break free and clear of this 1830 to the upside. So we can rechallenge that yearly opening price.
Oil
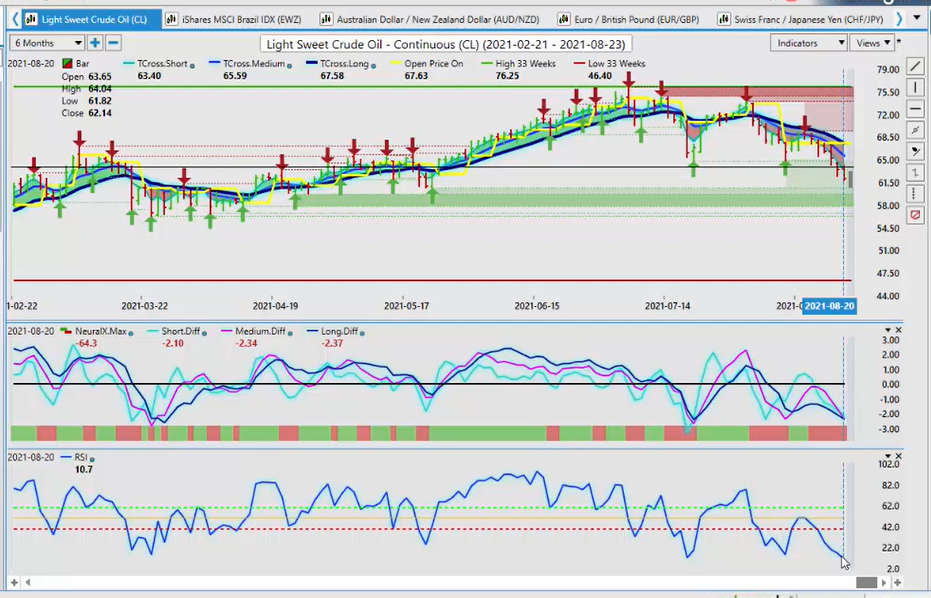
And again, when we look at this, our 31-week high, we can bring all of that information up at the same time. 31-week highs and lows are 1957 and 1677. We’ve just recently come down to the 1677. We had good buyers down at that level, but we’re just not getting above these vantage point levels in order to continue buying this. But I would be slightly optimistic on gold that we still can push higher to close to that 1900 mark. But again, that may take more than a few weeks to get to that. Now, oil having a tough week and it’s probably not going to get too much better for it next week with COVID, that’s the biggest concern that we’re starking it. You remember last year, in the first wave with COVID, Freightliners all across the Atlantic ocean, just driving around, trying to find places to store oil.
Market’s getting a little nervous about this. Again as this Delta wave starts to hit the US and some of the other countries. So Canada, we’re not doing too bad right now, but once again, if we’re trading off overbought, oversold signals, then the predicted RSI is at 10.7. But guys, if the risk-off takes hold of the market, oil will plunge further and completely ignore technical and fundamentals. It will simply say, okay, there’s going to be a supply glut here again. And we’re just going to have to start dumping out of any long futures contracts that start dumping out of them. And when they all start running for the exit, that can cause, that could cause some real violent spikes in oil. So again, keep a very close eye on that.
Euro Vs US Dollar
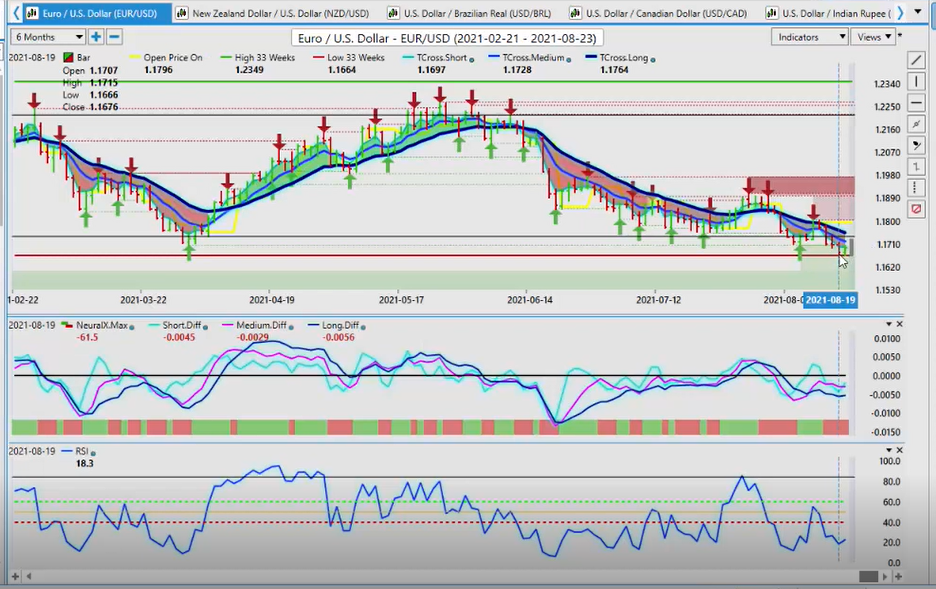
Now, the Euro currency has now set a new year, low down here. We’re pushing down into this 116 area. It was 76 area, but we do have still have strong support at the 116 level. What I find perplexing here also is the Ma diff cross in the pink, the separation between the blue line and the pink line there is still separation there. So again, our RSI is saying, look, we’re lacking downside momentum. So look for a bounce, maybe around the 116 level, but again, keep a very close eye on gold. If gold does break out, like we would hope then the Euro is the one that will follow not the US dollar per se. So we’ll be watching it closely. But for now, our resistance to begin the week is that 1.1755. We must clear that level. If the Euro is going to recover, you can see that our, market unopened price using that weekly opening price, the Euro was below the weekly open the entire week.
Then we’re using these VP levels to reset short. So if we click on our FA tier, you can see that this here again, only in my respectful opinion, it does look like a short squeeze could be taking place here very soon. So we use this predicted moving average by itself is a pivot level. So if we look at that and say 1.1708 one could straddle this and say, okay, there could be a short squeeze here. This is the perfect level for brokers to run stops on when the market is excessively short, this particular payer. So putting limit orders just above 1.1710 is a reasonable play. And then we play it back up towards the 1.1751/1.18 level. But you could have a bigger, short squeeze than this, right? So, but the main thing is if you know your levels and understand the technicals and the inner market correlations, it is absolutely tradable.
British Pound vs Us Dollar
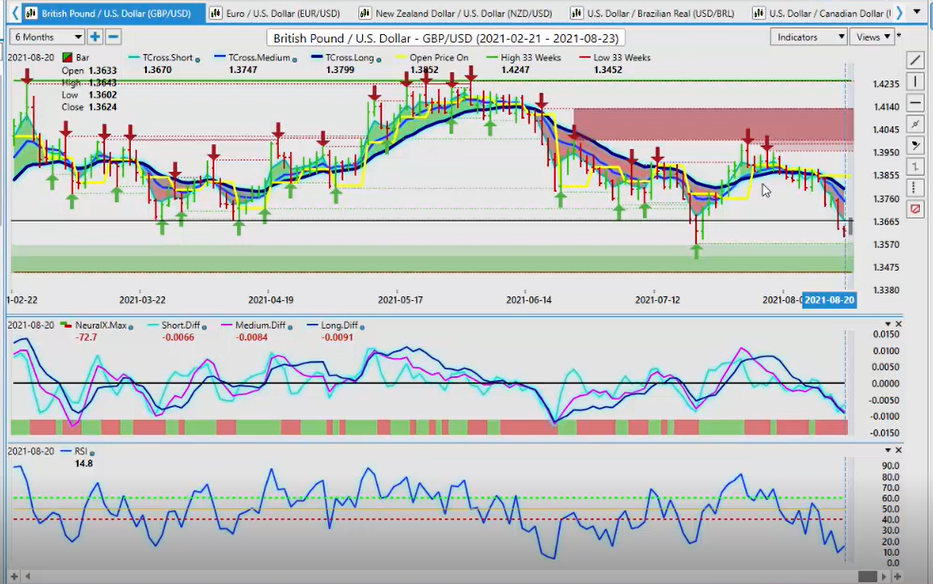
So again, the same thing applies to the pound dollar here. We’re, getting into these yearly lows down in the the lower 1.3450 area. But when we look at so far, and we look at it from a 33-week perspective, then we can see that our, our high is 1.4247 on a 33-week basis or on the year. And our low comes in up here at 1.3452. So this 1.3452 is where order flow traders are going to target for longs, in my opinion, because I’ve seen them do this time and time again. So they’ll try and run as many shorts out of this. The brokers will run as many stops as they possibly can before they take the market back up here. Now, there is risk here with the variant in the UK, but I think they’re handling it fairly well. Or at least that’s my understanding with what little news I can get on this.
But again, I think that more so than not, oil is going to be a determining factor. We remember what happened with the pound dollar last year during COVID when oil crashed down to 20 below $20 a barrel, the pound dollar was down below the 1.20 areas. So be mindful of that, that there are fundamentals in play here that we have no real control over. So if you’re trading this pear, keep a very, very close eye on oil contracts to see if they can stabilize and move back up with the SMP 500. But right now our key VP levels are the T cross long is all the way up at 1.38. When we click on our F8, you can see that the blue line here, our long predicted that’s coming in at 1.3726. So all of our resistance is considerably higher.
Us Dollar vs Japanese Yen
So we could get a strong retracement, as our RSI sits at 14.8. Now, with the dollar-yen, the dollar-yen again will follow gold contracts. So if gold plummets, then the dollar-yen is going considerably higher, but if gold recovered and starts moving higher, then that’s going to put pressure on this pair. You can see that we’re struggling at the T cross long 109.87. So again, this is the level you want to watch to see, and keep a very close eye on what if gold is moving above or below the 17.80 mark because that is what will really determine the next move on this pair. Now, again, with this dollar strength, we need to see what comes out of Jackson hole this weekend, because that may not favor the dollar. So you could get a bunch of people that are caught on the wrong side of this from Friday that are long the US dollar.
And then they’re going to be looking for the exit very quickly on Sunday night. So be careful with this pair. And like I say, to my own trading group is, always make sure you’re not taking any trades on Monday till at least 9:30 AM Eastern. Let all markets come back in before we start taking any trades. Because again, they’re just going to push the market around in thin illiquid conditions. Now we do have a rising RSI, but still, below 50, our predicted differences still crossed to the downside, but the slope is starting to turn back up, but the neural index is getting a number of mixed signals here. So just watch your key pivot levels. And again, that level is 109.87. If you believe that the dollar is going to strengthen, then you can simply put again, a straddle play works here, guys because we know the level.
US Dollar vs Canadian Dollar
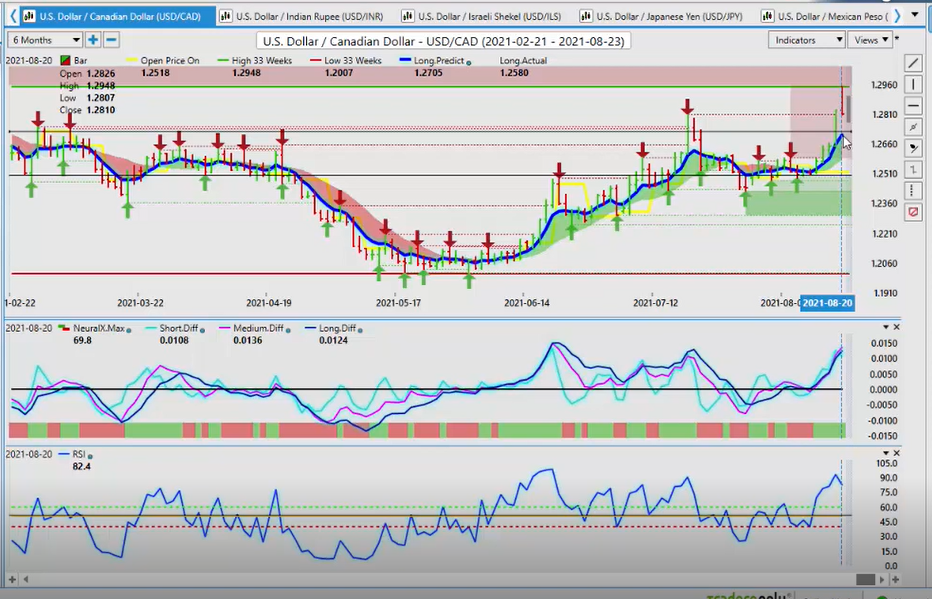
It’s not a moving target, it’s stationary. Putting a long order at say 1.105. And if the market goes up to 1010.05 it activates your long. And if it doesn’t, then you just simply delete the order, but it is a very effective way when we have these predicted levels to work with. Now, the US/Canada putting in a new high up here at the 1.29, I believe it’s 1.2948. Yes, it is. So once again, you can see that we had a violent push lower on Friday after we made this big run-up, we had the same amount to the downside. So once again, oil is the one to keep your eye on. I believe that this big push down was not because of oil. However, it was actually because the SM P 500 was recovering into the close. It did well into the close and that showed up on pairs like US/Canada, AUS/US, New Zealand/US.
So again, keep a close eye on the SMP 500, but our T cross long is all the way down at 1.2605. So to start the week we use that predicted moving average by itself. That gives us a 1.2705 levels. So if you are a buyer, that’s the area you would look to. But once again, watch oil and the SMP. If the SMP 500 starts moving up high again. Then once again, you can straddle just below that blue line, say 1.2690, and if it gets below there, then we know we’re going to take another run back down to the 1.26. I think that is entirely possible because so far Canada is doing fairly well with the Delta variant and the economy has opened up a little bit. I will warn everybody though. There is an election pending at the end of September, where it should be an interesting one, to say the least.
New Zealand vs US Dollar
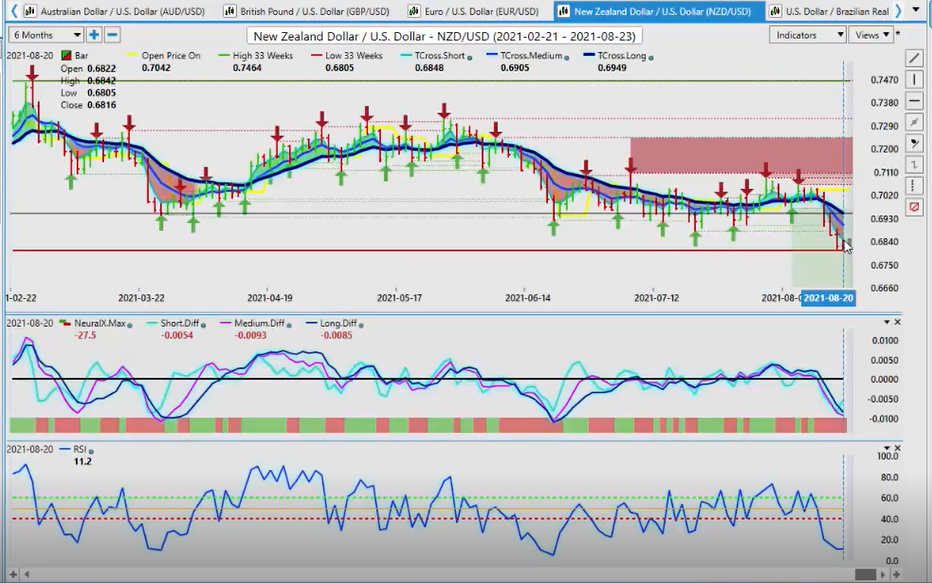
So, usually around election time, some of the international investors in Canada get a little nervous because they don’t know if the current administration is going to stay in power or if they’re going to be out. So that can cause some volatility with the currency, but the numbers, economic numbers out of Canada are still very mixed, but the bank of Canada is saying they’re going to hike before the FOMC. So we’ll wait and see. But for now, that is their plan. Now with the AUS/US and the New Zealand/US, once again, both of them, this is more of what we would normally see is both of these two, taking a hit at the same time. You can see that New Zealand did no better than the AUS, and they’re back to 100% correlated despite the bank of New Zealand saying that they are going to hike a couple of times, right?
Australian Dollar vs New Zealand
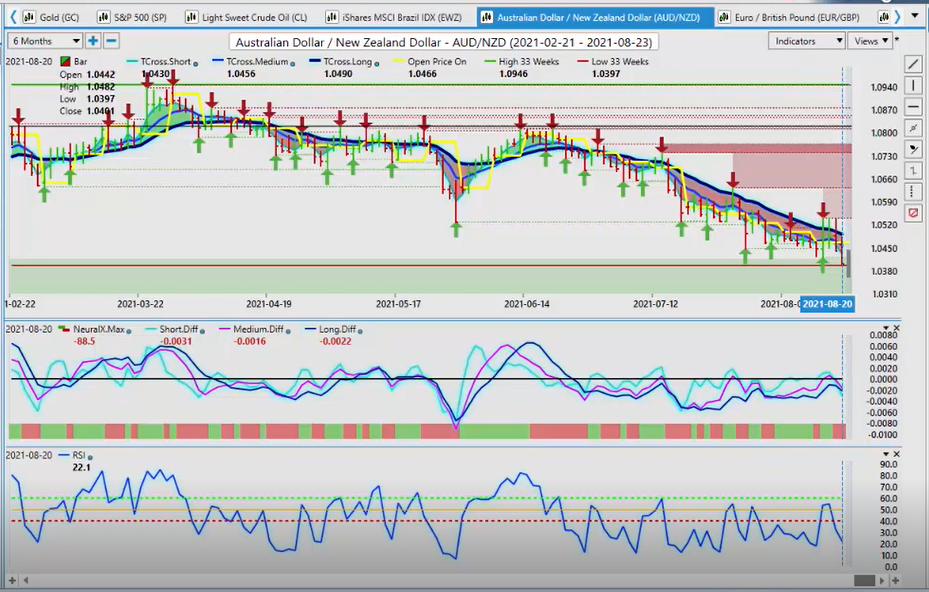
And you know, one of the gentlemen had mentioned in last week’s presentation that New Zealand’s handling the COVID virus breakout better than Australia. That is true, but ultimately, I believe that the divergence between the two banks is going to be the one that sends one of these two in either direction, and Australia, New Zealand, as I’ve discussed on here many times is a driving factor. So when we look at the Aus/New Zealand pair, that may even be a better one to trade instead of going after AUS/US or New Zealand/US or both, and just trade it by of this pair. So that is certainly an option, but it’s still very bearish.
We made a new low on Friday all the way down to 1.0397. So again, we are getting very oversold on this particular pair, but that doesn’t mean it can’t go lower here, guys. So if things do get worse in Australia, then that’s going to hurt the currency for sure. So in, that risk-off environment, so we do have a busy week ahead again, next week, it will be volatile, but it’s unusually volatile. Usually, in the month of August, it’s very, very slow. So this is one of the most volatile August trading months I’ve probably seen in the last 15 years. So what that said, this is the vantage point am AI market outlook for the week of August, the 23rd, 2021.