


The Hot Stocks Outlook uses VantagePoint’s market forecasts that are up to 87.4% accurate, demonstrating how traders can improve their timing and direction. In this week’s video, VantagePoint Software reviews forecasts for Seagate Technology ($STX), Boeing ($BA), Boston Scientific ($BSX), Verisign ($VRSN) and Intel ($INTC).
Register for a Free Live Training
Hello again traders and welcome back to the Hot Stocks Outlook for April 30th, 2021. Hope you all are having an excellent week out in the financial markets, and as always, plenty of opportunities to cover here in today’s Outlook. We’ll start out with shares of Seagate Technology. We also have Boeing, Boston Scientific, VeriSign, and lastly, Intel Corporation.
Now, starting out here with shares of Seagate, really good example of how really regardless of what market you’re trading, whether it’s Seagate, Boeing, Gold Futures, you know, Euro, US dollar, whatever market you’re trading, really all of these predictive forecasts work the same. So what you see here on Seagate is actually daily price action. So each one of those candles there represents a full and complete trading day. All of these predictive indicators that we’re going to look at work off of end of day data, so waiting until the close at 4:00 PM on the US markets. But what we have is daily price action, and you’ll see right up against that price action, there’s a black line and a blue line, right against the data.
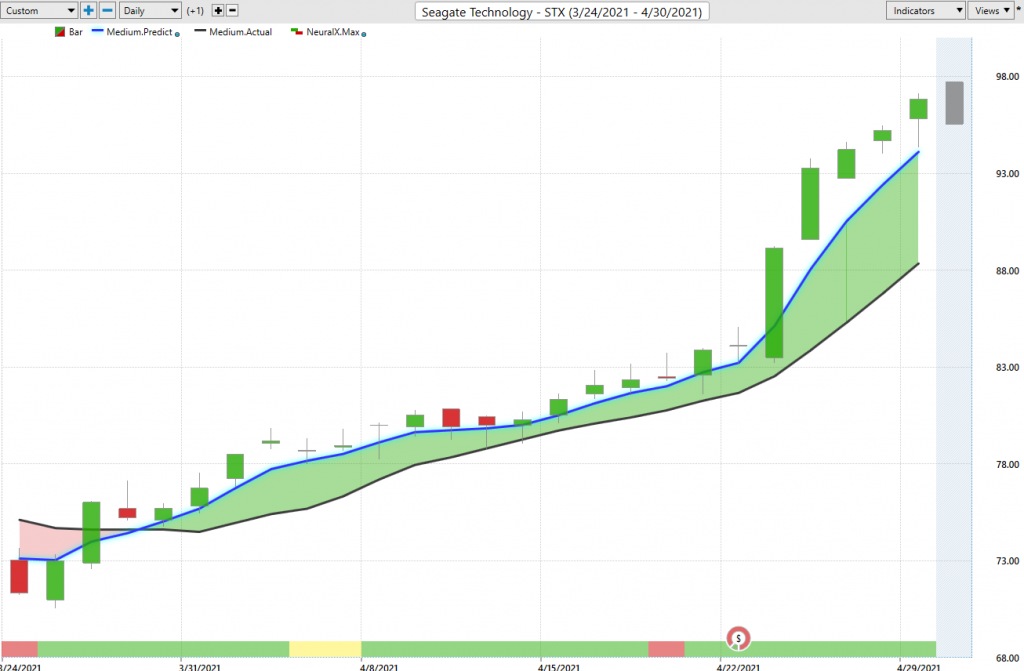
Now, the black line that you see there, that is a simple moving average, what we refer to as the actual simple moving average, and what that indicator does is really just look back over the previous price action. In this case, it’s a 10 day simple moving average, so it takes the last 10 close prices, adds them all together and divides by 10. Now, the weakness with an indicator and a tool like that is that all the data is coming from the past, and so it really acts as a good measure of where market prices have already been. And it works to smooth out that data and let us know, okay, well, where have things been trading?
But obviously as a trader, we need to be in front of these moves and understand where’s the market likely headed moving forward. And so what we’re able to do is compare that black value so that we can think of that as a lagging, moving average, letting us know where market price has been and compare that to this blue line that is called VantagePoint’s predicted moving average. And for that value to get generated and thus plotted up against this chart every single trading da, VantagePoint is doing what’s called intermarket analysis, and it’s utilizing the technology of artificial neural networks to do that.
So what the artificial intelligence is doing is looking at interrelated markets that are known to drive and influence the future price of Seagate Technology specifically. That can be individual stocks, that can be ETF groups, that can be things like the dollar index, that can be global commodity markets, interest rates. And it’s able to summarize all that information and actually generate a price prediction, so where are prices moving in the future going forward, and it takes that prediction generated via the artificial intelligence and it builds that into the value of this predicted moving average, turning what was a tool that really just gets dragged around by the most recent close prices into a forward looking predictive tool that’s actually anticipating where is the market likely to move going forward.
So whenever you see that blue value cross above the black values, the blue line crossing above the black line, it’s suggesting average prices are going to start moving higher. And therefore as a trader it would make sense, well, we to go ahead and take a long position. Now, there’s other indicators that are going to really round out the entirety of this forecast. If you look at the very bottom of the chart, you’ll see you have this line that goes green, red, back to green, and this gets updated, again, at the end of every trading day, works off of end of day data, but this is also utilizing that same technology, but it’s tuned differently. It’s tuned to really look ahead just 48 hours, and it’s looking for short-term strength or weakness in the market.
Now, it doesn’t mean 48 hours the market’s going to close higher, close lower, but it means there’s higher highs or lower lows are likely to come through, and you can understand, well, what is the context of the trade that you’re currently taking and how’s that going to affect things, and it’s really round all of this out. If you look at the very right-hand side of the chart, you see a predicted high and a predicted low, or the shadow candle here. Well, that’s what that shadow candle is, is it’s actually letting you know a prediction for what the expectation of the actual intraday high and low price will be. So whether you’re setting limit orders, profit targets for short-term trading, you’ve really got all the tools to let you know how you might want to manage that opportunity. So as long as that blue line, again, crosses the black line, is remaining above the black line, suggesting the overall trend is going to continue higher.
Now, as we go through these subsequent charts, you’re going to see periods where the neural index goes to a red, and you’ll often see either a sideways or a little bit of a pullback period from that point. But what you’ll notice is that this indicator over the course of all of its predictions on all of the markets, is accurate up to 85, 86% in many markets. On average it’s about 80%, about four to five times it’s going to get that correct. And you’ll see that you get a couple of days here where maybe it’s incorrect, but it’s pretty much right 85, 90% of the time here, letting you know short-term you want to be a buyer in this market, and also the overall trend is up.
So very clearly, almost every day here getting some very strong signals that this is a market where you really want to be long for the overall trend, and also the short-term move. We can look at the overall move here, and then we still have a market that’s still in a very strong uptrend, you see the most recent forecast. If we’re looking at this, obviously trend is up, you’ve got your predicted range and that neural index still looking very bullish. So what I just want to highlight, and really what these subsequent charts is, that you may take a position getting involved in a particular market, but this is where VantagePoint has an edge in really helping you walk forward and adapt to those changing market conditions, because you may get in the market and maybe 10 days later you’re here and you need to understand that, okay, well, the trend is still up, maybe look towards things like VantagePoint’s predicted lows to add to the position as it continues higher. But you got to stay patient and walk that position through each and every day before you get that big breakout, and that’s where things really start to pay off here.
So, you see about a 26% rally in about 21 trading days, but let’s move forward and take this approach and say, okay, well, regardless of the markets you’re trading, how do you want to utilize this approach? Now, I’ve highlighted how over the past several weeks there’s really been quite a split in markets. There’s been some bullish opportunities, there’s been some bearish things, you really have to be pretty careful there as far as picking where you might want to get long, but also where you really want to avoid getting long and potentially even short the market.
Here with Boeing, you see this crossover to the downside, going back really to the mid part of April here, and very clearly blue line below the black line. You’ll see here, you get this neural index goes up to a green configuration, and you see those higher highs are coming through over the short-term price action, but the overall trend still very much to the downside. Again here, you see the neural index gets bullish, some higher highs coming through, but you don’t want to be buying the market, you actually want to use that strength to potentially short. And that’s again, where do these tools like the VantagePoint predicted highs, are going to help guide you if this is in fact the type of trade that you’re trying to take.
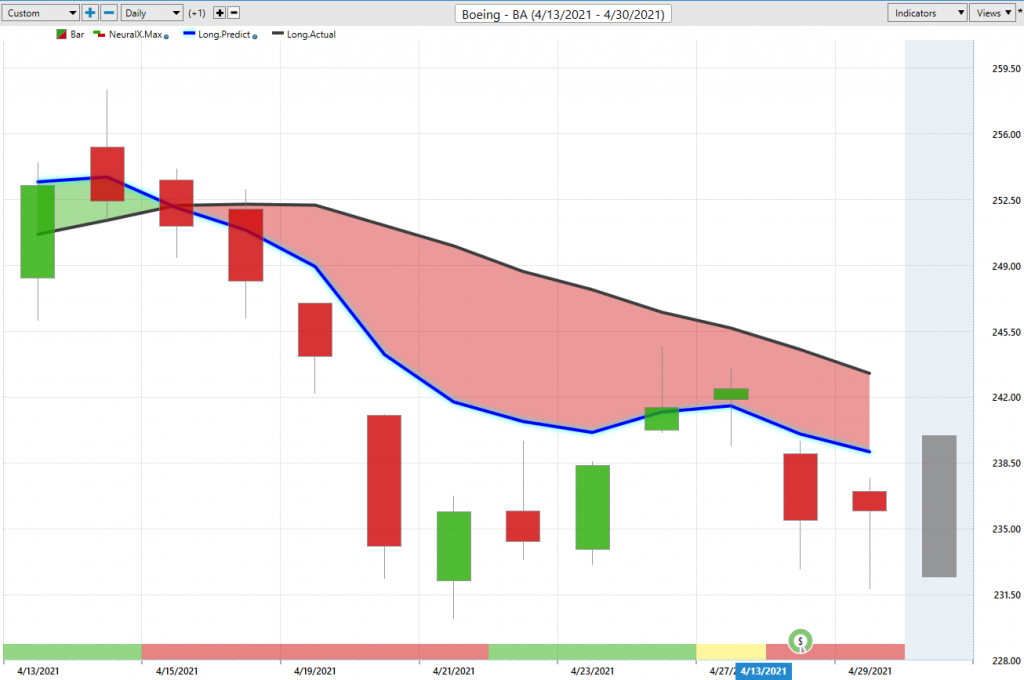
So you see the market’s declined about 7% from where those original predicted highs were hit, but you see here, these subsequent levels where if you’re a day trader knowing this is where you really want to be short, here’s where you should be looking for higher price levels, but knowing that those higher prices over those 48 hour windows are still in a downtrend. And you see that this market’s down about 7%, not a huge move, but clearly a place where you don’t want to be long, and for short-term trading, you’ve got those levels that say, look, if you’re going to short, really have some levels to identify where to make the most of that.
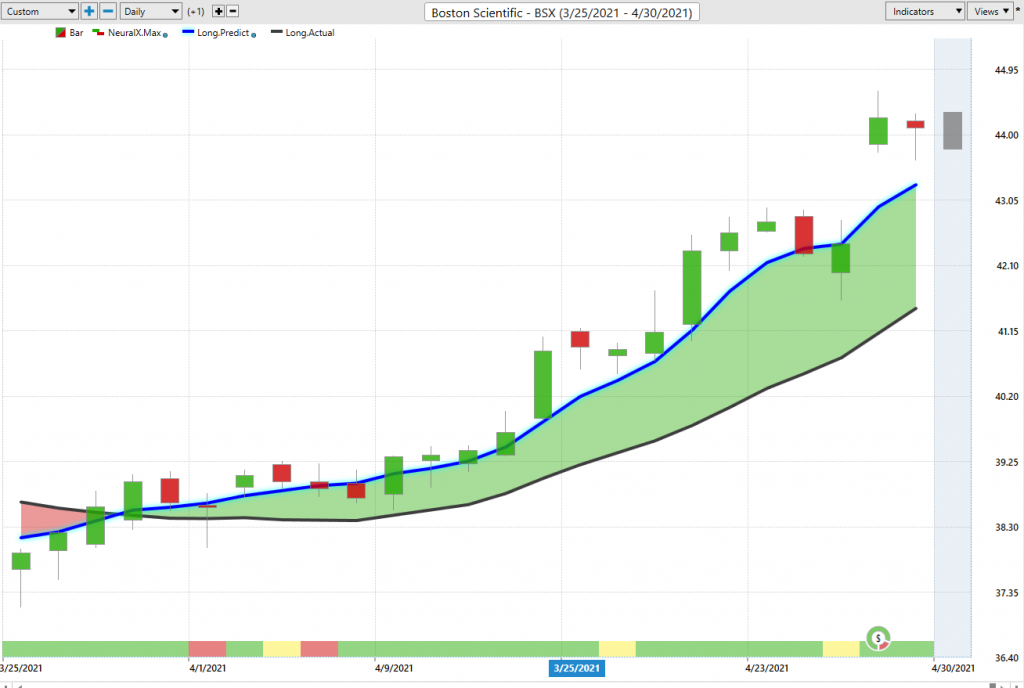
Here’s Boston Scientific. In this case, another crossover to the upside blue line, over black line. You’ll see you get these periods where neural index goes bearish, you get a little bit of sideways there, but overall the trend and the overall forecast, extremely bullish here, saying, look, you only want to be long take profits on long positions in Boston Scientific, and if you’re coming in on a daily level, you really know, okay, well, if I’m coming in and want to get an intraday price level, where should I set those limit orders to get involved in the market? And again, you see one, two, three, four, five, six, seven, eight entries as this uptrend proceeds over the past couple of months. But let’s see overall, it’s about a 16% rally. So not only are you potentially there for that 16% up move, but understanding that there’s plenty of opportunities here to add to that position and take some profits as that market continues higher.
Here’s VeriSign. It’s another opportunity to the upside blue line over black line. And again, I just wanted to highlight some of these shorter term forecasts, and not so much how you can identify the opportunity, but how once you may get in the opportunity, you got to know how to manage it. So you have the tools here that say, okay, well, look for weakness over these couple of days, but the overall trend is up. Potentially look for some weakness coming into this trading day, we trade right up. Again, here you get some sideways price action over here, but the overall trend, obviously clearly only wanting to go long, take profits on longs, and understand when that potential weakness is likely to come in, but not kick you out of your trade. You know, understanding that that’s actually weakness, that would be a potentially nice opportunity to be a buyer in the market.
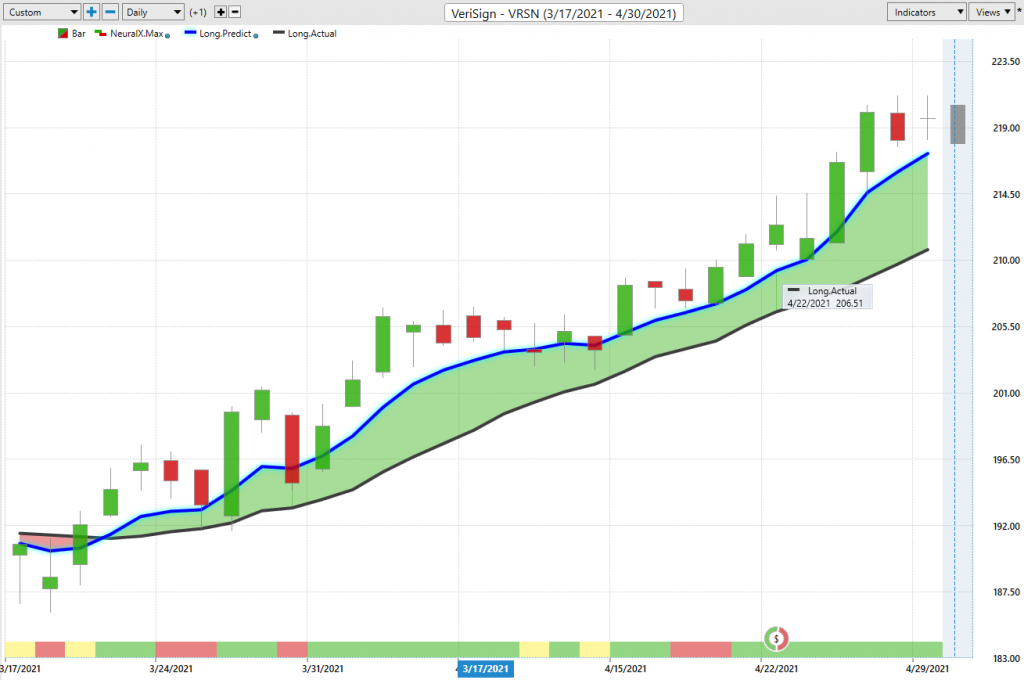
And again, so we can see what that looks like on these intraday levels of saying, okay, well, if you’re going to be a buyer intraday, where do you want to accept prices? And you see even here on things, where you get this big down day, you see immediately the market immediately snapping back the overall trend, continuing higher there. So a really nice move here out of VeriSign, We can see overall about a 13, 14% move just over past 27 trading days.
And lastly here, Intel. So another one of these markets, we’re not looking like a good opportunity, very clearly here. This is not where you want to be over the past couple of weeks. And if anything, trading here looking to short. And so intraday, where might you be looking for those levels to take short positions?
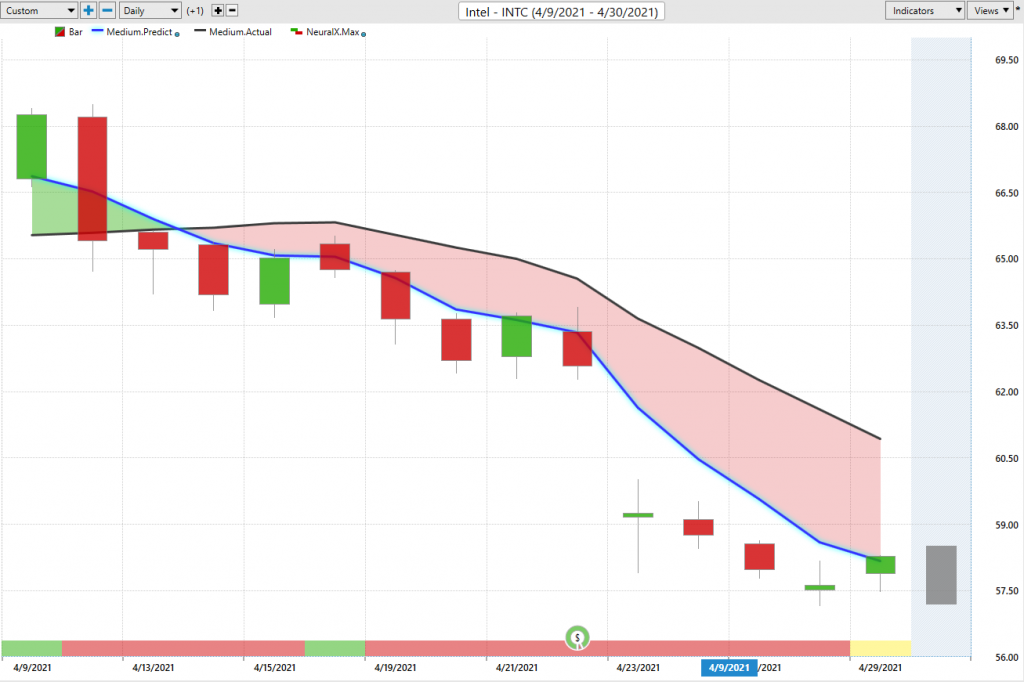
What you see here as the market starting to slide down, you’ve got to be shorting on those up days, and this really highlights something very important, where if you’re such a short-term day trader, you see that a market like this, there’s a good opportunity to get short here, but you often have to short on the close of the day. You see how the strength gets you that good price, but you close there and you really have to hold overnight for those things to move lower. You see again, it happens here, you close here, and then immediately that trend is really starting to break down. And that’s where the benefit of these 48 hour outlooks is going to help you manage that position and know when to stick with your trade. And that’s really something different than just saying, okay, well, you know, here’s the market you may want to get involved or buy or sell, but knowing how to manage it once you’re already in it.
So here you see about 11% decline and very clearly a place to avoid if you’re looking for opportunities on the long side of the market here. So again, and what we can highlight here is that we have these features that allow us to scan for new opportunities here. So this is what’s called the IntelliScan Feature, and what it’s going to allow you to do is potentially if you’re a trend or a swing trader, you can actually scan for these crossovers. So actually see fresh crossovers right as they begin and understand that, look, here’s the start of a new opportunity. Not only that, now’s the time to get involved for that longer-term trend trade, but have the guidance moving forward as the market adapts and move forward.
So if you want to set those one day old crossovers, you can, of course, just set the criteria to one. And you can set a lot of different criteria. Maybe you are a shorter term trader, maybe you do trade off the predicted highs and lows, you can set any of these conditions to really help you find exactly what you want here. Same thing with maybe you take shorter term trades and you’re looking for really trending conditions. Well, you can do the same thing and say, okay, well, where are we’ve been trending for a considerable period of time here, in addition to these short-term tools being bullish, and that’s how you can identify some of these new opportunities where you might want to participate, of course, bringing into account that overall trading style, and then matching it with the predictive indicators that we have here within VantagePoint to help you identify opportunities like Seagate, like Boston Scientific and some of these things doing really well. And of course, very clearly recognize when to get out of the way, sell your position, or potentially even short the market or buy some put options and make some money as things decline throughout the equity market.
So once again, this has been our Hot Stocks Outlook for April 30th, 2021. Thank you all for watching. Best of luck out there, traders. Thanks again, and bye for now.


