Register for a Free Live Training
The Hot Stocks Outlook uses VantagePoint’s market forecasts that are up to 87.4% accurate, demonstrating how traders can improve their timing and direction. In this week’s video, VantagePoint Software reviews forecasts for AMD ($AMD), Prologis ($PLD), Builders First Source ($BLDR), Ameriprise Financial($AMP), Franklin Resources($BEN), Goldman Sachs($GS), Helmerich&Payne ($HP)
Hello traders and welcome back to the Hot Stocks Outlook for November 26th, 2021. Hope you all are having a excellent week out there in the financial markets, and as always, plenty to cover here in today’s outlook. So I really want to cover here, we’ve got AMD, PLD and Builders FirstSource. And this is really going to cover what we’ve talked about over the past several weeks. There’s strength coming into the market in October, we’ve seen that spread out throughout the marketplace through a lot of different stocks, and there’s been great opportunity there.
But last week, we started talking a little bit about financials and energy stocks. And it’s a good time to go back and watch a lot of those previous weeks, as far as how we dealt with October, how the portfolio has been very bullish, and also recognize some areas where things are shifting and that that can play out against the larger marketplace.
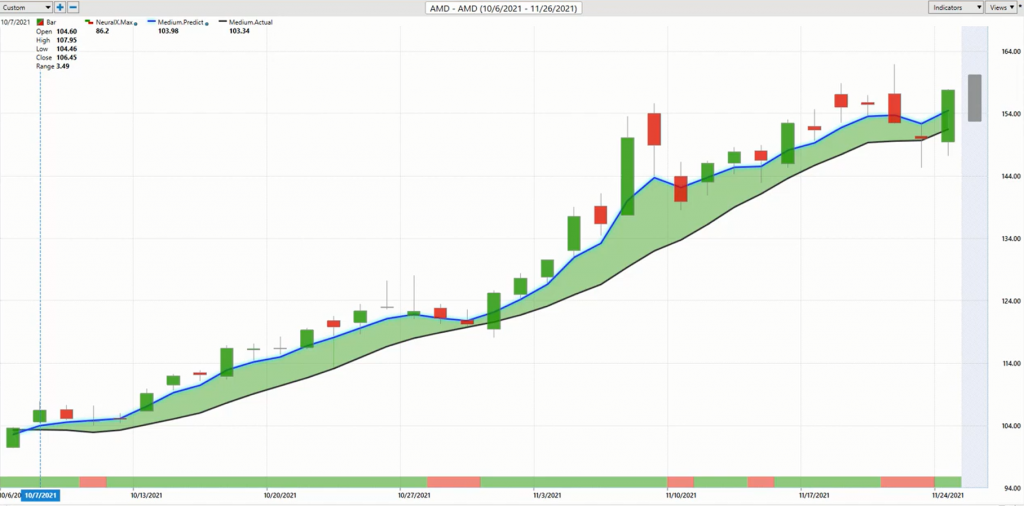
But when we look at shares of AMD, what we recognize is there were a lot of these opportunities that happened in October, and this is how VantagePoint picked up on this. So what we have here is daily price action. So each one of these days represents a full and complete trading day. And right up against the price data you’ll notice that there is a black line there and also a blue line.
So the black line that you’re seeing there, that is what we would call a simple moving average or what we refer to as the actual simple moving average. And that’s a very common technical indicator in that it only looks back over the previous 10 closes in this case, divides that at by 10 and you get a rolling simple 10 day moving average. And that’s a good tool to smooth out the price action and let us know where prices have been over a given period of time. But obviously traders need to be ahead of the move and we need to understand where are market prices likely to move next?
And so what we’re able to do is compare that lagging simple moving average to this forward looking predicted moving average generated via the technology found within VantagePoint. So for that value, that number essentially to get plotted against the chart each and every trading day, VantagePoint’s technology of artificial neural networks are performing what’s called intermarket analysis.
So what that means is for, specifically in this case, what we would call all the target market AMD, there’s a specific set of markets that are known to drive and influence future price. Now that’s a combination of stocks, the broader indices, global currencies, global interest rates, futures, and commodity markets like oil and gold.
And so it’s able to factor in these important market relationships and use that information to generate a predictive forecast of where prices are headed going next. And it’s that information and data that has actually worked into these indicators to turn what traditionally are lagging indicators that just get pulled around by price into forward looking predictive tools.
So when trying to determine that overall trend direction, what’s very helpful is seeing that blue line cross above the black line, and it would suggest average prices are going to start moving higher. Now, what I just really love about this tool here is that we actually have the ability to scan for these predictive indicators and we can see the market shift.
So what we’re able to see by setting up some processes to just track these things as the market moves forward is that October we see all this strength coming through. And that’s what I want to highlight when we look at these first few opportunities and what we’ve been highlighting over the past several weeks. So here in AMD, we see since that crossover of that blue line crossing the black line, not only here in AMD, but broadly throughout the marketplace, you see shares of AMD up 50% in the past 35 trading days.
In this case, 200 shares there has up over $10,000, but this is a significant move over only 35 trading days during a period of time where it was very obvious that look, stocks look strong, there’s some opportunities, and VantagePoint can guide you here if you’d like to get exposure to that. But there’s that 50% just as far as the blue line crossing the black line, but we also have this neural index and that technology is tuned to a different timeframe in this case.
So in this case, this neural index, you see it can go from green to red, back to green, but it’s tuned to only look ahead 48 hours at a time. So any one forecast is only looking ahead 48 hours and can obviously flip from green to red and is going to help you as far as short term, strength, or weakness in the market.
So if you know you want to be long, if you know there’s strength in October, what the neural index is going to help you do is anticipate some of that short term weakness over the subsequent price action, but not lose track of the bigger picture. So in addition to that indicator, which has an extremely high level of accuracy, you can see that the market’s moving up predominantly and when the market’s ready to go sideways or move down that neural index pops in, but quickly goes back to green and things move higher.
But in addition to that accuracy and forecasting, you also are given a intraday. So down to intraday short term, you could think of this going down to minute candles because it’s giving you an intraday, what the extreme higher low is likely to be, but an actual forecast or prediction there to help you with adjusting positions, setting limit orders, setting profit targets. And like we always do, we’ll go back and look at how accurate all of those forecasts are.
And so for a period in October, when it’s very clear that you want to be long taking profits on longs, well, this tool is going to do a good job guiding you. And so even a period like this, where you see you come out of the range a little bit, that’s going to happen during periods of extreme volatility, but you’ll notice that extreme volatility is to the upside and making it very clear that even when you get periods like that, I comment on this all the time that this is an adaptive technology. So it has a very good capability of saying, okay, what happened there, readjust, and you see how accurate things get back on track as far as moving forward. So really nice opportunities here all through October.
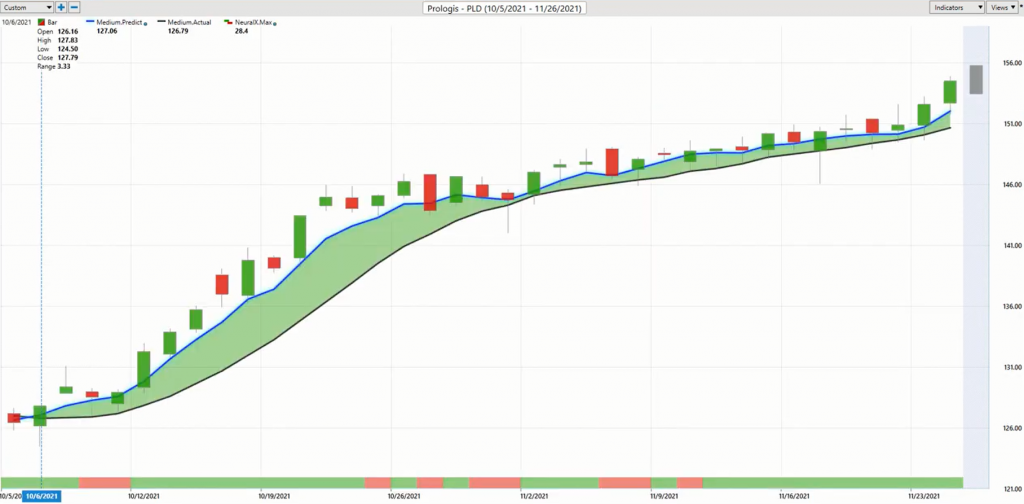
Here’s PLD, very clear, you see that blue line crossing the black line, but also notice the period of time in which it’s happening is October. You’re running the scan and a lot of things are coming through saying, there’s a lot of bullishness here, position the portfolio to get some exposure to that. And you see there’s so many different markets that are not in the same sector or anything like that, but are performing well. And you see about a 21% rally over the past 36 trading days.
Again, fairly small position making you several thousand dollars in profits over a fairly short period of time from that early mid-October to where we are right now. Move it forward to Builders FirstSource this stock. And I remember when this thing was trading down in the teens several summers ago, but here you have blue line crossing the black line very clearly.
You’re saying, look, new opportunity here. We know October, there’s a lot of strength here, and sure enough, blue line crossing black line, you get a little bit of weakness here. You see the neural index running bearish, but the forecasts are bullish, not just on that intraday or that individual market that you might be trading, but broadly throughout the markets. So this tool allows you to not only have that very effective guidance on the individual day-to-day level on those markets that you might be trading, but give you a much broader perspective of the broader markets.
And what sectors should you be focusing on? What individual stocks within those sectors should you be focusing on so you can make those better trading decisions? So here you see, builders first source, but it’s become very clear that the time to buy for those longer term trend reversal sort of trades was in that first middle of October period.
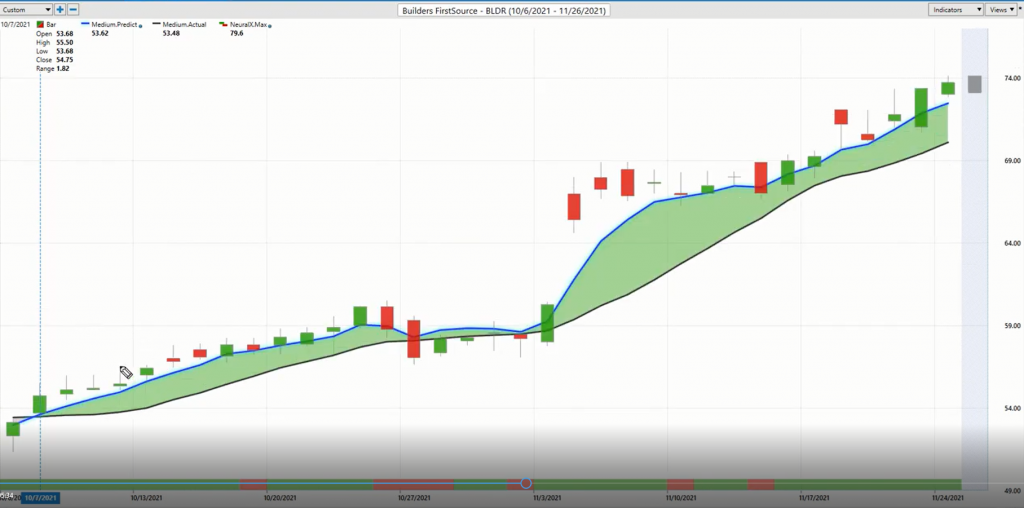
So about 36% rally shares up, about $3,900 profit on just a couple hundred shares here in BLD Builders FirstSource. But we move on and we see that sectors are doing different things, and where we first start to see some dangers in the market. Well, that definitely shows some areas where you might want to hedge the portfolio, maybe even go short and get some exposure that way, so that if the volatility of the S&P and the broader markets heat up, well, maybe your lungs give back a little on some volatility, but the portfolio is making money because of that volatility.
So here we have Ameriprise Financials, and you see the same thing. We didn’t bring in a whole lot of financials over that October period. But you can see in this area that this is very strong. You see actually in late September, this pulls higher, you get a little bit of shaken around, but then October comes in and it’s pretty much a straight ride higher, which is pretty emblematic of the broader markets here.
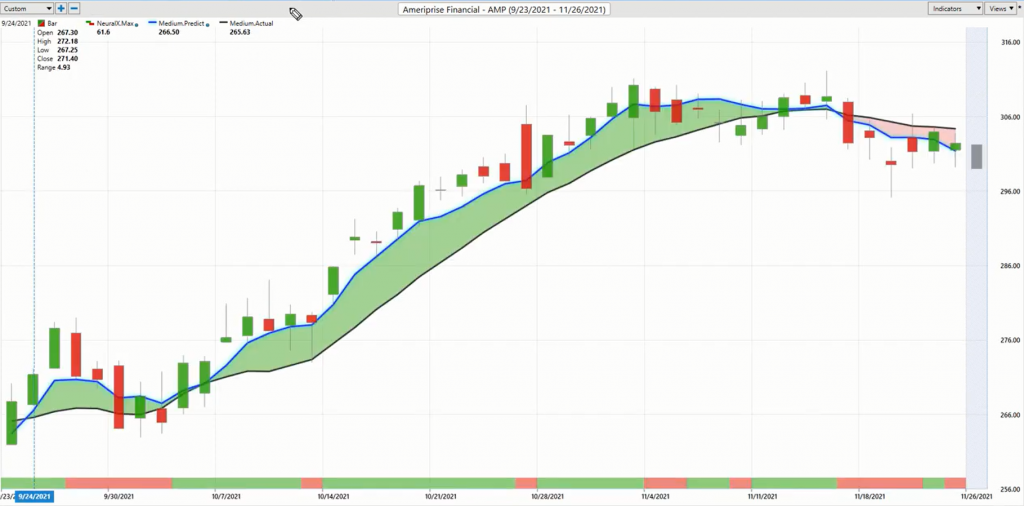
So really nice move over the course of October, where we understood that things are looking really bullish, that’s fine. But what we recognize is things have shifted and where that’s been identified is in financials and energies. But a lot of these areas of the market, regardless of where you’re trading, you see those crossovers move lower, and you understand that, hey, take those profits if you’re long, maybe look to go short, but you want to find the best places to do that. And that’s where the scans and these tools can really help.
Here we go, these crossovers to the downside, and this has been now over a week and a half here where it’s very clear that if you want to trade financials, the play has been what, maybe look to short, take profits on shorts, but this is not a good time to especially initiate fresh longs or anything like that would be a no go and quite dangerous. And so we’re seeing this, it looks to be early on in some of these sorts of shifts, but it just gets to that. How might you be structuring the portfolio because of the tools and how they’re guiding you and making you aware of some of these situations?
So here you have Franklin Resources. Again, October, we’re expecting to see some bullish crossover, some opportunities to the upside. And when we look at those short term forecasts on the way up, they do a really great job of highlighting those entries and you get a big rally. But notice how the short term forecasting gets weak in here.
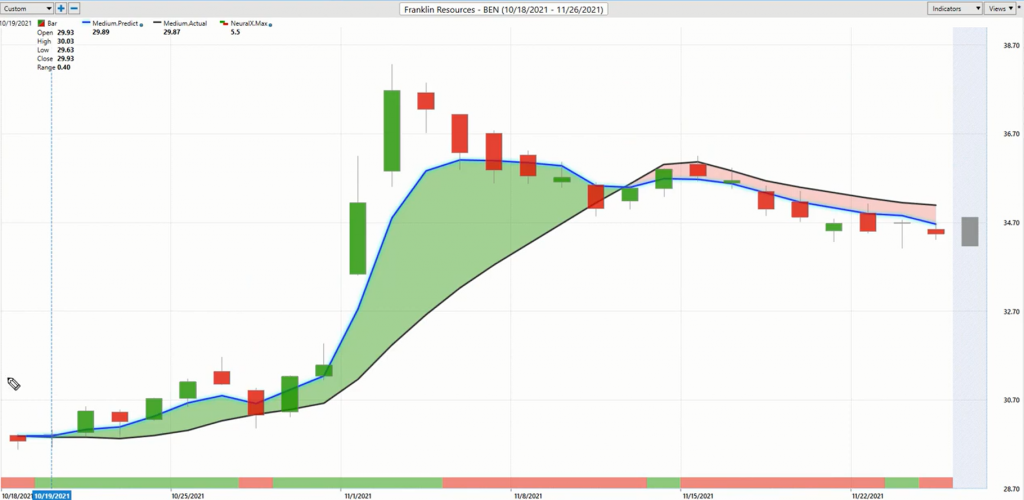
You just get weakness, weakness, weakness, saying, look, it’s weak over that time period. And then you start to see again, the shift taking place in the market so that you’re running your scans and you’re actually seeing fresh crossovers to the downside in financials. And just the like, again, Ameriprise, that was a little bit more recent, but we’ve seen this for a couple weeks, especially in Goldman Sachs.
We look at JP Morgan last week that here there’s some danger there, and at least over here is not where you should expect to be making money trading over the short term. And not only that, but again, some good areas to potentially hedge, but in the shorter term, the predicted highs on the forecast would certainly be a more appropriate place to get a good entry.
Now here’s Goldman Sachs, same thing. We see the strength in October. That’s what those previous, you go back and watch the playlist of the previous Hot Stocks Outlook that’s what you’re going to see. A lot of this shifting from September where there was weakness to that strength coming through in October.
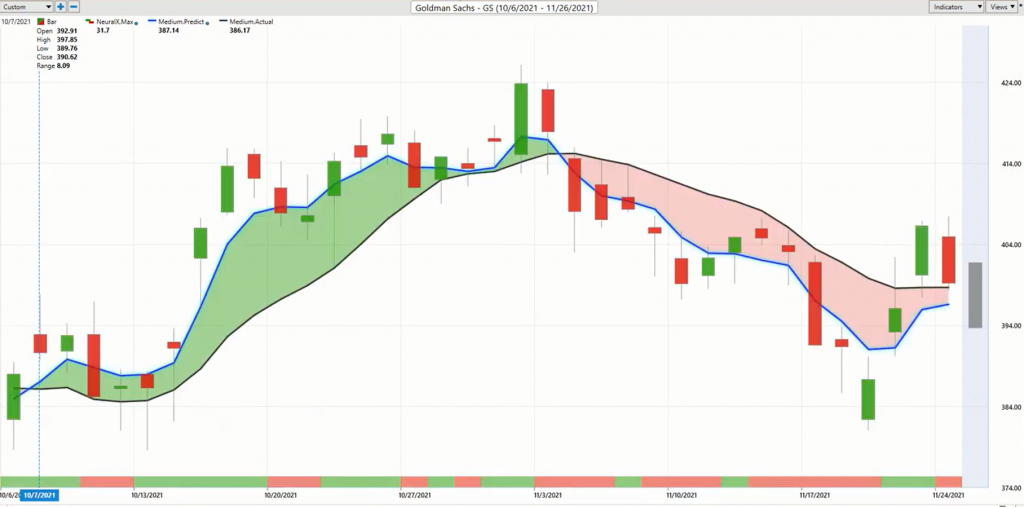
But again, just last week, we brought through Goldman Sachs. And again, seeing that look, there’s a lot of volatility here. Sure, but clearly not an area where it’s worth messing around, let’s say, or taking bullish opportunities, but doesn’t mean that we can’t short. But you see that when you’re able to recognize these early shifts in the market, you can get some really early entries. So you can deal with that volatility and potentially have some of the insulated positions to buffer the portfolio.
And so that when things start to slip, the portfolio is making money and in nice trends, just like in October, it recognized now’s the time to get long trail those stops. And as long as the trends keep moving higher, there’s your trade.
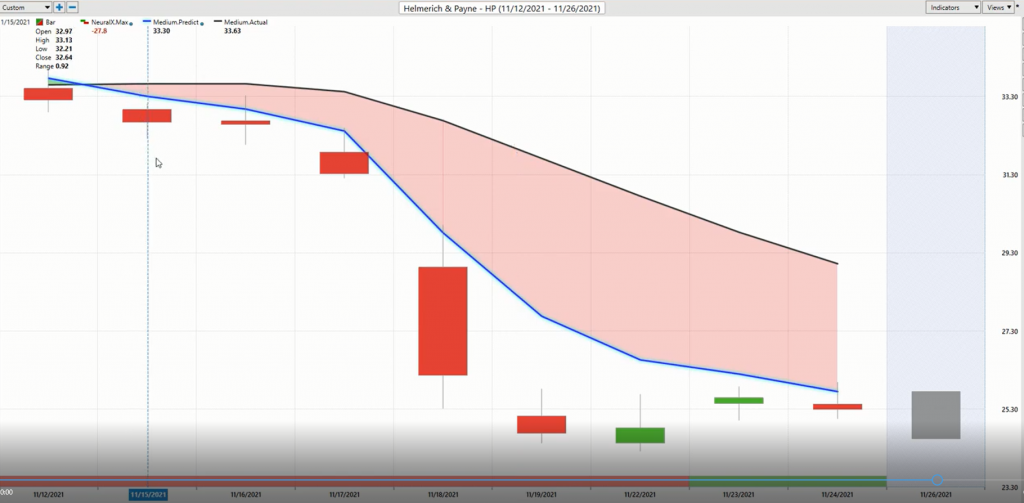
Here’s H&P. So in energy stock here just very clearly, we can see some of the issues, the couple stocks we brought through last week. Here you see another one clear cross over to the downside over the past couple weeks here.
So as you’re running your scan, you’re just repeatedly seeing that where the dangers are, where these predictive forecasts are forecasting weakness, and that’s going to guide you on how to position the portfolio to say, okay, well, maybe I want to get some exposure, bearish energies, or potentially bearish some of the financials, just to get that bearish exposure, to the portfolio that up until recently would’ve likely been very long using these forecasts.
Here we have a 23% drop here already in shares of HP, just over the past seven trading days. So just a week’s time there seeing that weakness come through and obviously a lot of volatility accelerating. And so just to get another great weekly example of how these tools do an excellent job of that predictive forecasting, getting us ahead of these moves, recognizing these shifts throughout the marketplace and opening up some really tremendous opportunities on both sides of the portfolio, whether you’re getting long or getting short here.
So once again, that’s been the Hot Stocks Outlook for November 26th, 2021. Thank you all for watching, best of luck out there and bye for now.