Register for a Free Live Training
The Hot Stocks Outlook uses VantagePoint’s market forecasts that are up to 87.4% accurate, demonstrating how traders can improve their timing and direction. In this week’s video, VantagePoint Software reviews forecasts for Wal-Mart ($WMT), APPLE ($AAPL), Southwest Airlines ($LUV), TESLA ($TSLA), Nvidia ($NVDA) and Cummins ($CMI)
Hello again, traders, and welcome back to the Hot Stocks Outlook for December 30th, 2022. Our last Hot Stocks Outlook of the year before we roll into a fresh 2023. It’s a really great time if you’re a trader in the market to really get organized, get prepared, and really get the best tools to help you make better trading decisions. So if you haven’t already, make sure you go ahead and click on that link in the description below, and you can get a live demonstration to learn more of the specifics about how this technology can help you as a trader make better trading decisions in the marketplace. So a lot to cover today, a lot of the big stuff. We’re going to start out with shares of Walmart, and this has really been a key area where we saw a lot of these markets start to pivot lower. But we’ll take a look at… We’ve got Apple, Southwest Airlines, Tesla, Nvidia, and lastly, Cummins.
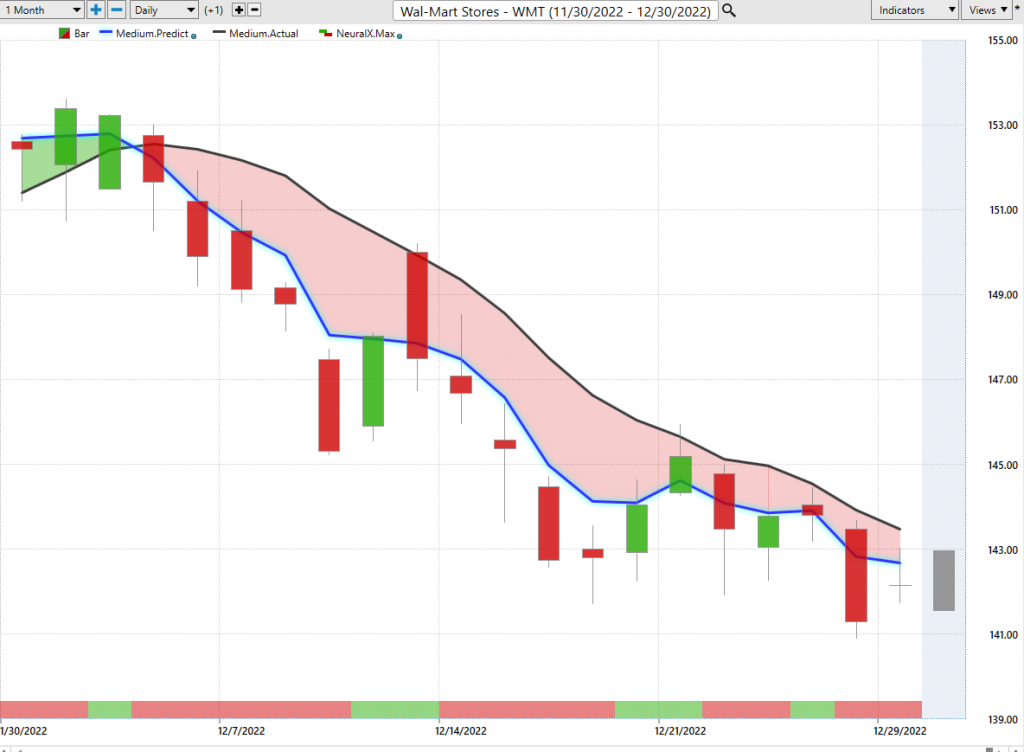
So we’ve looked at a lot of these markets over the past few weeks, what’s really helpful here is to understand how tools like this can help you adapt as a trader and recognize these really important shifts in the market, not just on the broader market like the S&P 500, but those individual markets that you may be trading. So, really good example here with shares of Walmart, and what we have here is daily price action. So each one of these candles represents a full and complete trading day. And so right up against all that daily price action, what you’re going to see against the screen is that there’s a black line and also a blue line there. So the black line value that you’re seeing, that is actually a simple moving average. So that’s a very common technical indicator. And in this case, what it does is it looks back over the previous 10 closed prices, it adds those all together and divide it by 10.
And so it acts as a very good baseline to let us know where market prices have been, but obviously, the savvy trader needs to be ahead of that next move in the market. And so what we want to do is actually compare that black simple moving average or what you might call a lagging moving average to this proprietary predicted moving average, that blue line on the chart. And for that number to get plotted and calculated for traders each and every evening, this is where the technology of artificial neural networks come in, and they’re performing what’s called intermarket analysis. So what that means is, rather than just looking at past prices of Walmart stores like traditional technical analysis would do, what this technology’s able to do is understand market relationships that are known to drive and influence the future price of Walmart shares.
Now that’ll be things like… Well, the global dollar index has had a big effect on the S&P in the broader markets, but down to those individual equity indices or the Nasdaq, maybe you’re trading tech stocks, but then it goes to individual ETF groups where you see a lot of capital get grouped together and move in and out of sectors within the market. You’ve got broader commodities like wheat, and sugar, and grains that can affect particular markets, the oil market, the dollar interest rates, gold prices. So this is how it really does this global approach of looking at everything down to individual stocks that share relationships with Walmart, and it uses that information to generate price predictions.
And this is where the technology really has an edge in taking in huge amounts of data, understanding what’s significant there, and then leveraging that data to generate accurate predictions. So it’s those predictions of price that are actually used to construct these indicators. So in this example, they’re predicted moving average, whenever that blue line is moving below the black line, it’s suggesting average prices are going to start moving lower, and this can be a very helpful indication of trend for traders. But again, a tool that’s leading the market, using those inner market relationships to actually generate a forecast and skew these markets to the bearish side.
And so I’m focused on Walmart here, and I want you guys to understand this because as we go through all of these markets and use tools like the Intelliscan to actually identify, “Hey, if we want to be long markets, where’s the strength? If we want to be short, where’s the weakness?” Well, these things come through and alert us to… Well, how much of the market is weak, and where are these important areas where we’re actually seeing those shifts and how widespread is it? So we started to see this on Walmart, it was really one of the leading markets before we started to see, as we looked at last week, more and more markets start to pivot to the downside, and this is not lost on a trader utilizing VantagePoint and seeing all these predictive indicators start to skew very bearish. So, Walmart, a great example of the broader market. Only off about 6%, 7%, but that’s what gives you some of this valuable information that says, “Hey, the markets are quite weak here. Let’s go look over at tech stocks to see how they’re doing.
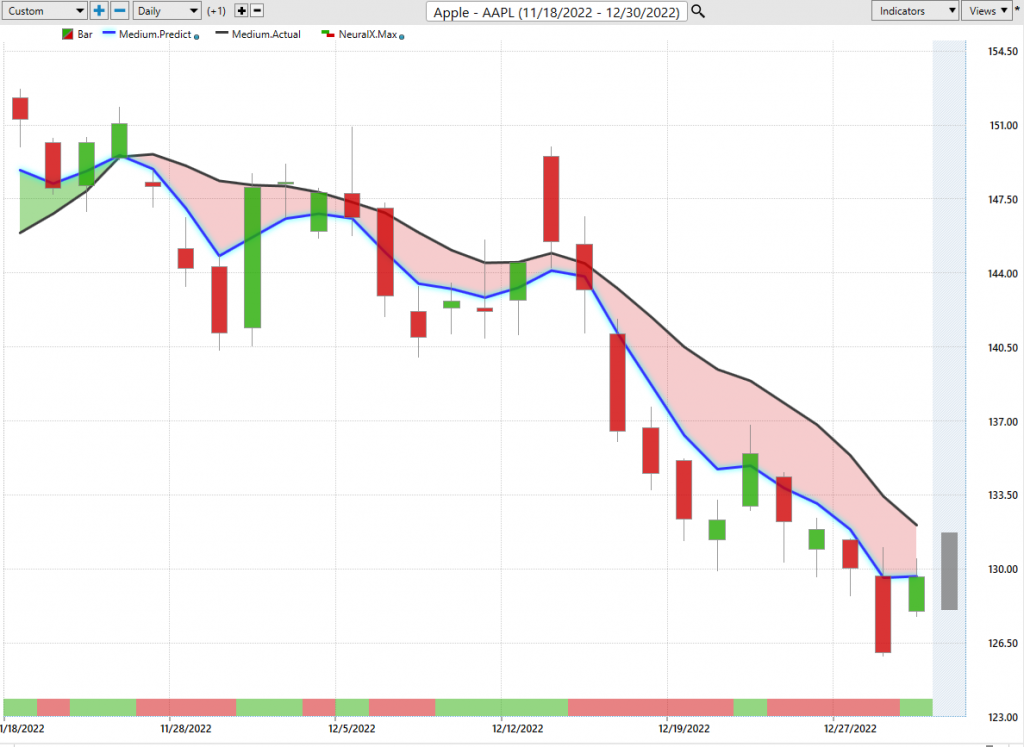
Well, here’s shares of Apple.”
So now, going back all the way you see to the middle of November. I mean, really towards the tail of November here, this is well over a month now. Very clearly, Apple’s in a downtrend, all you’d want to do is short take profits on shorts. But we have these other tools within VantagePoint that are extremely helpful. So if you look at the very bottom of the chart, you’ll see this bar that goes from green to red and back to green, and this is tuned a little bit differently. So if we have a predictive indicator to help us identify trend shifts and reversals in the marketplace, this indicator at the bottom solves a different problem. And that’s to identify short-term strength or weakness over the next 48 hours, or you can think of that as the next really two candles. 48 hours, a couple of candles there, but short-term strength or weakness within that bigger overall trend that you may have identified.
So here, when we understand, “Hey, Walmart’s trending overall. We have a downward forecast in Apple here. Well, what’s going on in the short term?” Well, you see. When this neural index gets bullish, you may get those subsequent higher highs over the subsequent price action. But the blue line still remains below the black line, not just here in Apple, but across the broader markets and helps you understand that, look, the overall directional bias here is still short. So once you have that short-term forecasting that can help you with, again, that 48-hour view of should you stay short, stay long? Well, you’re also provided with a predicted high and a predicted low before each and every trading day occurs. So what you’re looking at, every week when we look at this is the most current prediction of the high and low before any of that actual market data has filled in.
And so these levels will stay stationary, those predictions will stay where they’re at, and then the actual trading day will fill in with what actually occurred. And so this is how traders can understand, “Well, where should I be looking in the marketplace to go ahead and actually set short positions if I want to keep expressing that bearish position on the market?” And so here we see with Apple, there’s plenty of opportunities here very early on in the trend that says, “If you want a short, this is the time to get that directional trade on.” But what you have to understand is you’re going to get this updated each and every day. So as the blue line remains below the black line, great, the overall trend is still in place. If it crosses above the black line, you may have to make some adjustments. But here, we have shares of about 14% in the past 18 trading days, but it’s not just here in Apple, right?
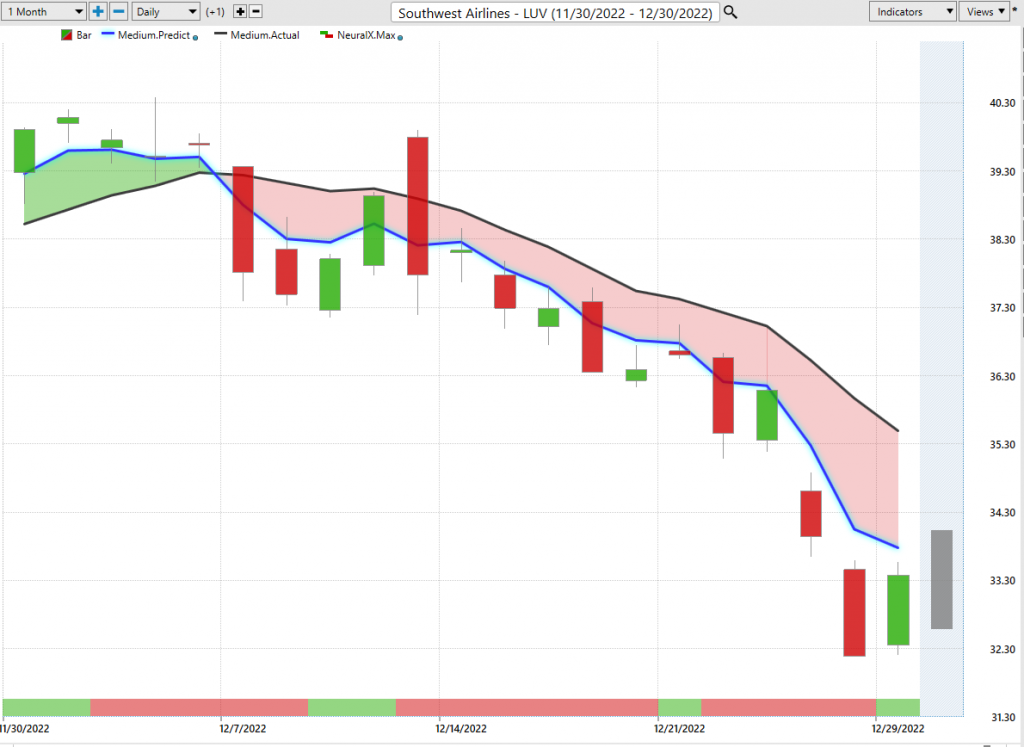
We’re seeing this spread out over the past few weeks and it makes sense on the portfolio level. Get net short. Don’t get on the wrong side, especially if you’re long. Some of these specific markets, Walmart, Apple here, Southwest, Tesla, hedge make some adjustments here. So here’s Southwest Airlines, again, and I just want to highlight that if you set up a process that actually identifies these predictive indicators coming through as they roll through, it gets very hard to ignore things like this weakness you’ve seen over the past few weeks. And that’s why these Hot Stocks Outlooks are highlighting really since that Walmart crossover came through that, “Whoa, we need to pay attention here. If you want to be making money over the past few weeks, and really through this whole month of December, you need to understand this information.” So here’s Southwest Airlines, you see that crossover the downside, you’ll get these blips.
You see where the neural index gets bullish, you get a couple of rally days there, a little bit of a gap-up, but do you want to be looking at getting along the market? Does any day go by where you look at this and say, “Hey, the markets are getting bullish.” Well, no. And so you really gear up every day as saying, “Okay. Well, where do I want to come in and set short positions on the portfolio?” And here in Southwest Airlines, you see… Well, just keep executing that. So if you go into even just this past week, this here is Monday going into the week, hit the predicted high, fall off a cliff. Well, that’s a lot of stocks recently have not really fared well. We can see the overall move here in shares of Southwest, and we got a lot of news and information around the holidays with airlines.
But these crossovers, it’s all the same. This is coming through very early on in December like we looked at last week, and it shouldn’t be lost on traders that, “Hey, we’ve got some problems.” Definitely go ahead and make some money on the bearish side or hedge. So 13%, 14% decline there in just 15 trading days.
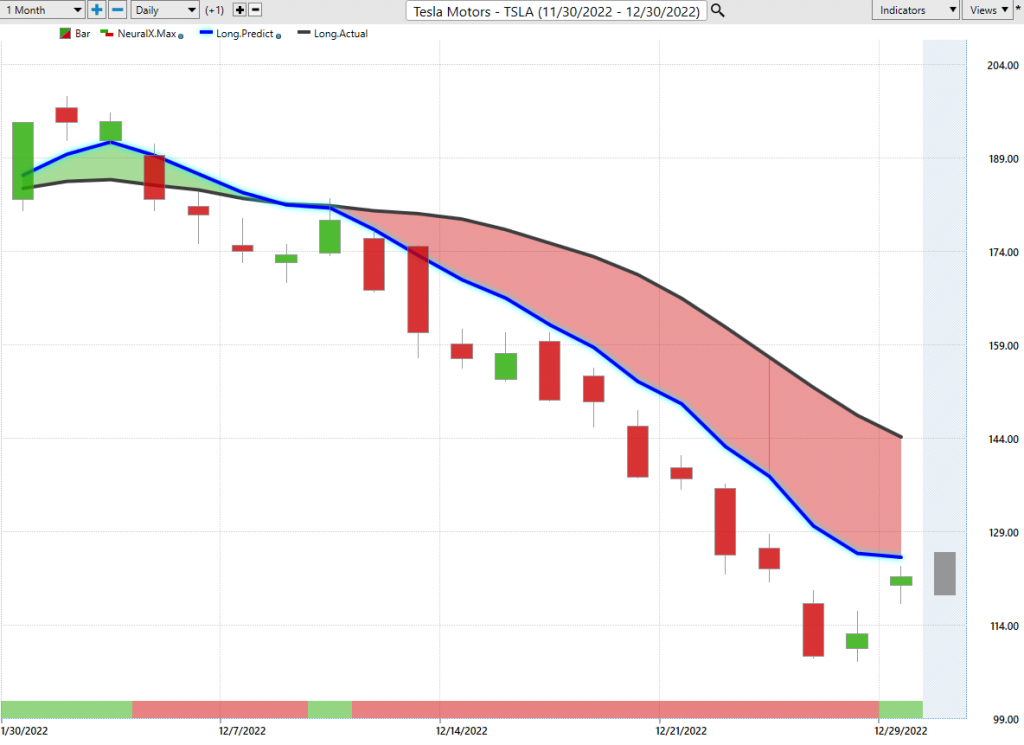
Here’s shares of Tesla, which we see the forecast from where this crossover have come through. We looked at this a couple weeks ago. Well, not a whole lot has shifted, and the market still has continued into that downtrend. So again, on a weekly basis, even saying, “Okay. Well, how am I thinking about the markets? How am I thinking about Tesla? How am I thinking about Walmart or Nvidia, or any of these shares?” Well, there’s really only one way to think about them. Shares are off. You got a 33% decline just in the past 16 trading days.
And very clearly, that full three weeks over the past 16 trading days pretty much can only go short, take profits on shorts, a very bearish forecast, even in the short term there with those 48 hour forecasts that are looking forward.
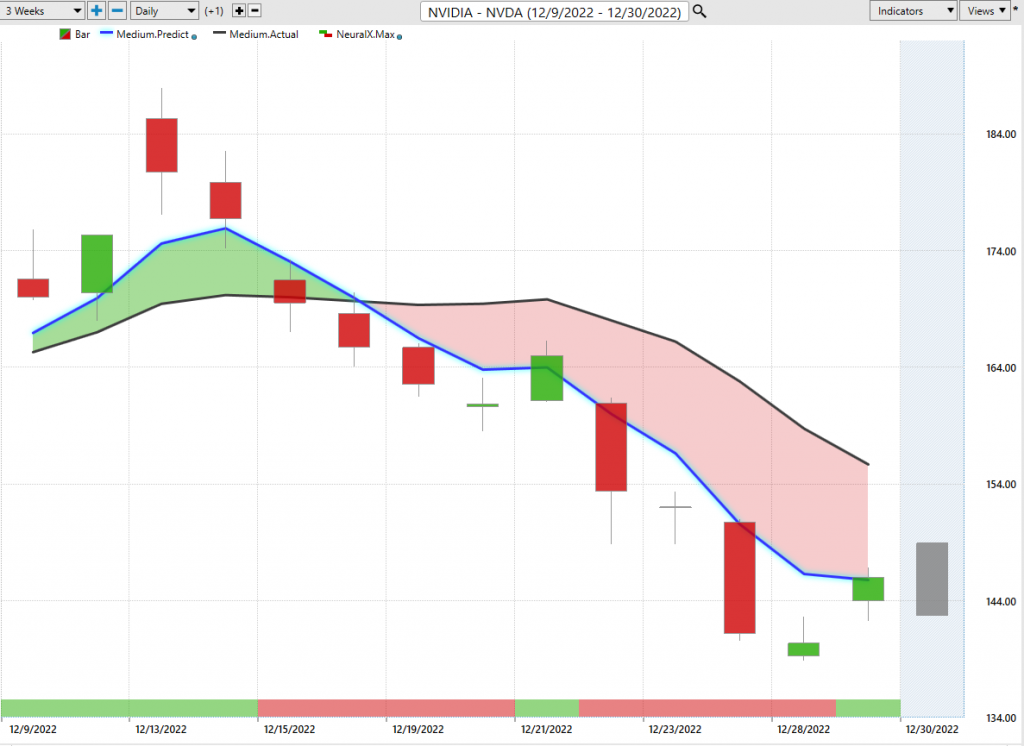
Here’s shares of Nvidia, and this is one of the stronger markets out there. But, even it has shown problems. And so this is now going back two weeks, the crossover to the downside neural index bearish. We get some little blips here where the neural index popping up, but a huge amount of separation between that prediction of the actual moving average. So this is very early on in things like Nvidia here, but I’m just trying to highlight how when you have the right tools set up, and then you have a process set up to benefit off of these predictive indicators so that you see things as they occur, and you can adapt with the market as it’s making these important shifts.
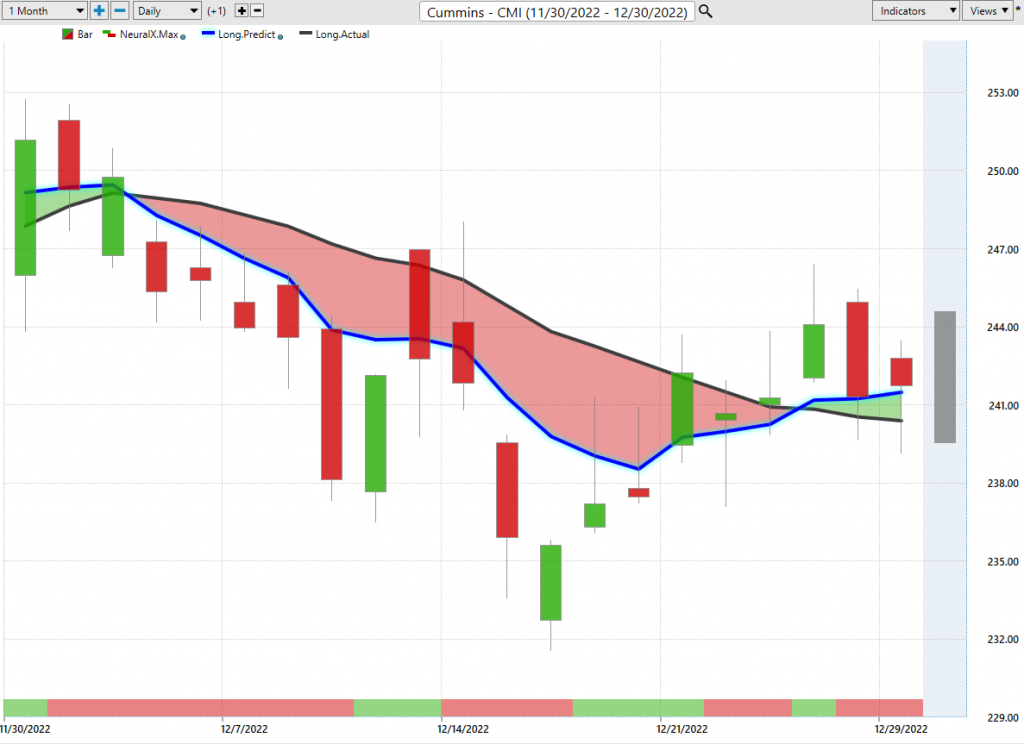
So here in Nvidia, shares of 12.5%. Well, clearly, we can look at the predictive crossover. We can look those predictive highs and lows, and there’s your level, predicted high, look to go ahead in short 12/21. And very clearly, right? I mean with the broader markets, how they look, what we’ve been covering over the past few weeks. If you’re looking to trade semiconductors, well, it’s very clear as far as even Nvidia, one of the stronger markets here is this ain’t the time. And if you’re going to do anything, short take profits on shorts. Lastly, I want to bring in Cummins here to actually highlight a very important example here of how these predictive tools work. So if you’re having a little trouble understanding, “I just don’t get this. How do you use that predictive moving average, that neural index?” Well, you want to understand that these are different tools tuned to solve different problems for the traders. So Cummins, this was a market that we looked at as we started to see all these markets shift to the downside. And certainly not a bad place to short and take profits on those short positions.
But you can make adjustments in the trade. So when you have the neural index gets bullish year, you can understand, “Hey, there’s higher prices over the next 48 hours.” Well, that’s a valuable information to use. Again, neural index gets bullish, “Hey, higher values over the next 48 hours.” But what you’ll notice here is that blue line crosses above the black line. And so what that indicates is that of all the places to short, well, Cummins is probably not a great place to short this week. You see that blue line crossing above the black line, and actually this predicted low would really stand out at you as cover short positions or potentially if you’re looking for a trade go long. And that actually would be Friday of last week saying, “Look, if you were short Cummins, let’s cover that. You can stay short maybe some other areas of the market, but something’s going on here where certainly we can see some higher prices,” and you’ve seen as the markets run sideways, this is one of the few markets where that blue line is above the black line.
But what I just want to highlight is that if the market’s going to be here six, seven days later, we need to get that bullish crossover. So, yes. The market is in an uptrend, but what you’ll also notice is these other tools are also doing their job. And we do have broad-based weakness. We do have a bullish crossover here, but you also have the neural index has been bearish four out of five days. And so that can give a trader valuable information to get better prices, make trade adjustments, and be ahead of that potential weakness, and really contextualize it with the overall portfolio so you can really understand why this forecast is shaping up the way that it is, how that you should manage that if you’re going to involve it in the portfolio.
But also not losing track of the bigger picture of what’s going on in stock, so you can make sure that portfolio is really pivoted the correct way. And even if you are short something like Cummins, make those adjustments. Just go ahead and cover that, get out of there. And if you want, you could always use the software to short at higher levels, but you should wait until those trend and predictive forecasts get on your side, because it’s just going to be an easier roadmap to go ahead and trade when you have those bearish forecasts on your side if you do in fact want to go ahead and get short or hedge other things in the portfolio.
So I’ll go ahead and leave it there. Once again, this has been the Hot Stocks Outlook for December 30th, 2022. Really ending the year here on a strong note. And like I said, it’s a really great time to get those forecasts. Go ahead and sign up for that live demonstration, click on the link below and at least learn about the technologies that are available to you to help you make those better trading decisions as a trader going into the new year. So have a great week. Thanks again, and have a great new year.