Welcome to the Artificial Intelligence Outlook for Forex trading.
VIDEO TRANSCRIPT
Hello everyone, and welcome back. My name is Greg Furman and this is the VantagePoint AI Market Outlook for the week of August the 2nd, 2021. Now, to get started this week, we’re going to continue with our learning process of inner market correlations and different strategies using the VantagePoint software. So, for this week’s session here, going forward we’re going to be looking at these particular indicators. The 52-week lookback indicator in the VantagePoint software, which I’ve modified to 31, I’ll explain that in a moment. We’re using bars, not candles. Long-term predicted difference, medium-term predicted difference, neural index, point and time indicator, which again, I’ll discuss in a moment. Our short-term predicted difference, our triple cross and of course our verified support and resistance zones.
Now, with these additional indicators, they will allow us to see the actual overall structure of the market and not get too caught up with short-term indicators. So, when we look at the dollar index, by clicking on the most recent bar, what I can do is bring up all of my information here. I have my 31 week high, which is 93.43, my 31 week low, which is 89.20, Then my price on open, which is 89.93, excuse me, and that would be very close to the yearly opening price.
Now, these are very important numbers because they do provide market structure. So when we look at this, we can see that the dollar made its yearly low and its yearly high basically in the first quarter, and then it’s just been wandering back and forth ever since, not making any new highs, but not making any new lows either. So, when we look at the structure of this, it shows us a channel that the dollar is running in and where VantagePoint is picking up on some of these signals with their predicted moving average crossovers, and our predicted differences.
U.S. Dollar Index
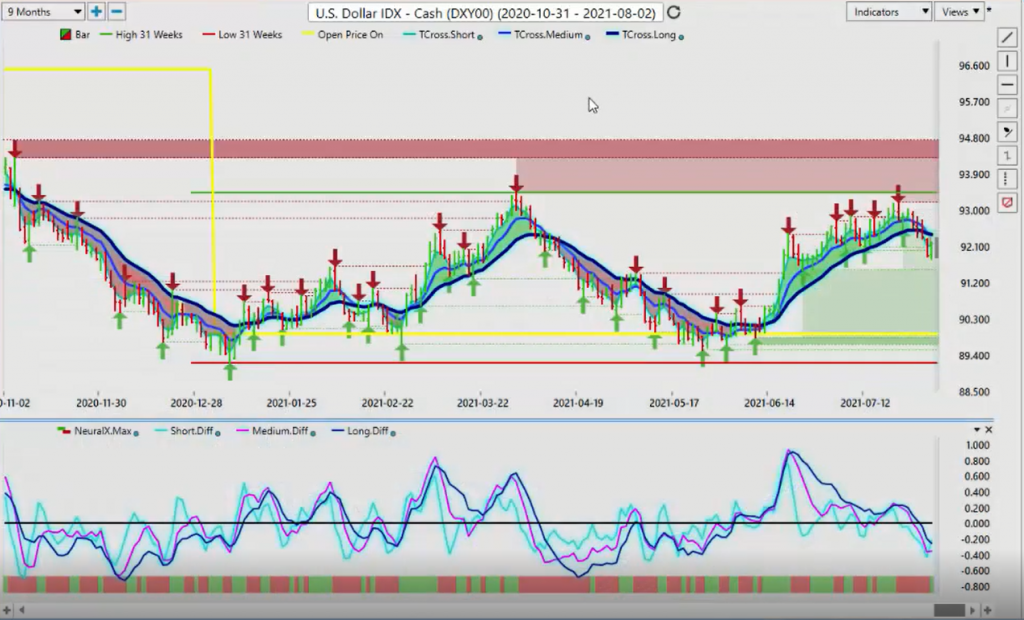
So, in this most recent move down in the dollar, we can see that the medium term crossing the long-term predicted difference was a leading indicator when we combine it with these yearly tops. Now, to be clear, this yellow line that’s coming down here is the yearly opening price, or very close to the yearly opening price. So basically what I can do is say, “Pick a point in time at the beginning of the year, January 1st, where did this particular asset class open?” So, we can see that we’re down here and I can very easily get that information. From this point, coming back in, I can then pull back into a three month period and get a better structure while still maintaining the key indicators.
Now, when we look at these predicted differences, we’re looking at not just the crossover point, but the potential change in the slope. Now, you’ve heard me discuss on many occasions about the dollar cycle. Now, in most cases, it’s not very strong in the month of August, but the week of the nonfarm payroll is usually when the dollar strengthens. But that is also usually a very short-lived move, usually about a week. What I’ve often said is the Tuesday after the nonfarm payroll number, no matter how good that number is or how bad that number is, the dollar usually sells off after institutional buying is done. So when we look at our key VantagePoint pivot areas, we can see that the T-cross long is 92.38, that now becomes our resistance to start the week because we’ve got a fresh triple EMA crossover forming near a newly-formed verified resistance and the yearly high. So we can see the overall structure of the market.
The neural index has gone from red to green. So that’s warning that we’re likely going to see some strength in the dollar index at the beginning of the week, but also remember there’s a holiday in Canada on Monday, so markets will be a little bit thin. Now with that, we also click on our F8. We want to identify that key VantagePoint-predicted moving average. Now this is an excellent way to get some of the lag out of the market here. What I look for is the market to hold above this blue line to stay long, and hold below this blue line, this predicted moving average, to stay short. So, we can assess here that once we crossed over, we had our two day rule, that led to three days of a good strong move down. Now, the bar from Friday is very often what we see or what I see is profit taking.
So, always remember that if we’ve been long euro, US, long, Great Britain US for the entire week and then the market participants, they all start taking profit on Friday, just remember how the currency markets work, that when they close our euro, US long, they’re actually buying us dollars back and selling the euros off. So again, that’s where you get this profit-taking in play. But for now to begin the week, we have the main resistance area, the long predicted and the T-cross long is sitting at around the … I’m going to round it out and just say, 92.40, the dollar is still in trouble while it’s below that particular level.
Now, when we cross reference this, and we bring in those direct inner market correlations, we can assess the top correlated market is obviously the ProShares Euro and this is on the monthly, excuse me. So we’re going to go out and we’re going to look at the yearly. Let’s use the yearly because it’s the most reliable in these correlations, but the ProShares Euro, you can see, these are all positively correlated UX, Mexican pesos, Singapore dollars, Israeli shekel, US, Swiss franc, a US, South African rand. There’s a number of different markets.
Then you have inversely correlated markets that are starting at about 80% correlated, inversely correlated, which are equally is important and we can assess what those are. So if the dollar slips and continues to fall, then a number of these currencies will go with that, that’s what we look for. But the main correlations with the dollar index is going to be, believe it or not, Bitcoin is still at the top of my list. I’m watching that one very, very closely, but the inverse correlation to gold. So, as gold has rallied over the last several weeks, that’s been putting pressure on the dollar index, and this is what we want to make sure we’re looking for.
Now, one of the questions I was asked, a very, very good question I was asked last week, is there a difference between correlation and causation or cause and effect? I think that question is answered very effectively this week in the VantagePoint article on the US dollar index. So I will read a quick excerpt from that, which I believe answers that question better than what I could have. “Inter market analysis immunizes you from fake news reports in the media that offers scholastic opinions,” that’s the key word here guys, opinions, ” … disguised as facts. When you see the key drivers of price, you know that these statistical correlation puts the probabilities overwhelmingly in your favor with the trading decisions you make.”
Now that article was posted this week in The VantagePoint, it’s a US dollar weekly asset study. I think that was a fantastic article. That segment hopefully clarifies that question because I think it was answered better how than I could answer it. My view is that I am not interested in tracking any kind of impulse buying, selling waves. I’m interested in tracking repetitive patterns and institutional funds. That’s what has originally led me to study these inner market correlations because when the so-called experts repeatedly … or the academics, they’re basing it on a black and white, there’s nothing black and white about trading. There’s a huge gray area that us professional traders work in and we have to accept that, where the academic doesn’t always do that. He looks at the data and says, “Okay, this is going to be the outcome.” No, that very often is not the case.
So, I think that little excerpt from that very, very well-written VantagePoint article, answers that question. So hopefully that makes sense, but that was the question and it was a very good one, the difference between cause and effect in correlations. I think that that’s a very good starting point for us to get our head around. So the dollar to start the week again, the indicators are absolutely bearish in the VantagePoint software, but again, we’re starting to see a little activity in this trigger. This pink line is a trigger. When it crosses over that blue line, it gives us an early warning sign of a potential shift in sentiment, so keep a very close eye on that.
Gold
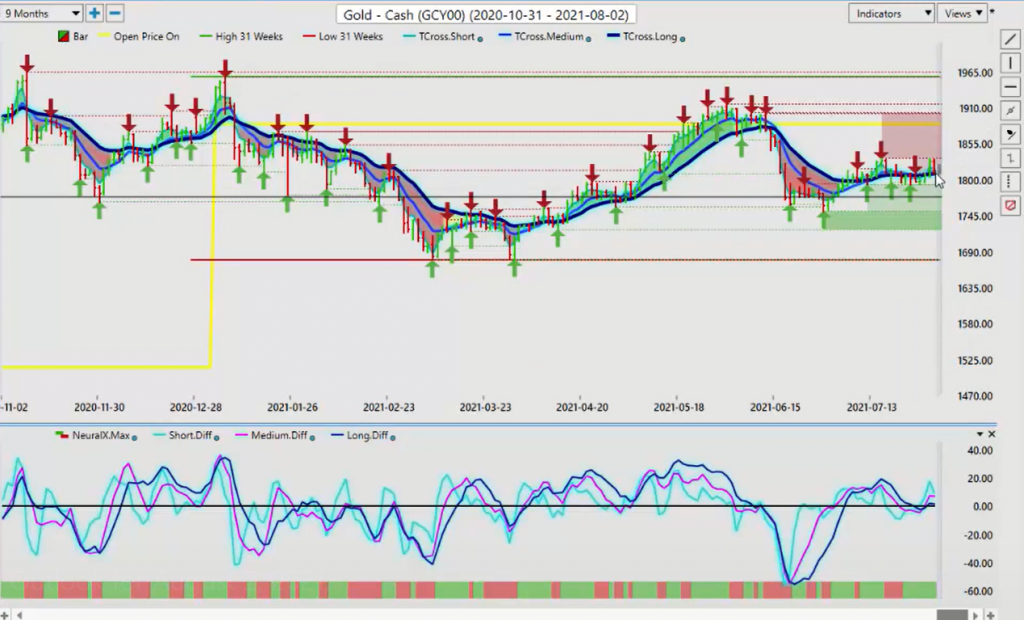
The other one we want to make sure we’re looking at very closely as gold. So when we look at the gold markets, once again, if I pull it out to a nine-month period, and the reason why I’ve used 31 weeks and not 52 weeks is because I tend … Each year, there’s a reset on January the first, that’s why I put in a yearly opening price and then I start gauging my ranges from there because that’s what the big funds base their performance on a year over year, and then of course they make adjustments to that, but every year it starts a new performance track record.
So when we look at gold, gold has not had a very good track record in 2021. That’s obvious by looking at this chart, we’ve been below this yearly opening price the bulk of the year, but we have recovered and we’re trying to recover again here, now. Now, when we break this down and we look at this, I can see that my price on open is 18.85 because I’m going to get as close to that yearly opening price as I can. My 31 week high, 19.57, my 31 week low, 16.77. That puts us almost smack dead in the middle of the range here. So again, gold is trying to recover, but what we’re going to do here now is again, then we bring it down into a shorter period to see where we’re at. We can assess that we have a verified resistance high at 18.32. I believe that we’re failing here because once again, this past week, there was an epic battle going on between two heavy hitters, gold and Bitcoin. I believe Bitcoin got the best of gold a little bit, but only on the Friday. So I’m not going to put a lot of weight on that. I truly believe that what the future holds is that both of these two will go up and down together because they’re very similar.
The difference is the payment systems and the amount of people, once again, when we talk about that fake news or academic opinion on things they’ve repeatedly told us, they’ve been just as negative to say not to buy gold, some of them too, but they’ve been extremely negative on Bitcoin and they’ve been extremely wrong. Warren Buffet, I won’t go into that. All I will say is, is that he has been adamant that he will never buy Bitcoin. Just remember guys, he said the same thing about the Forex market and that ultimately ended up making him a lot of money when those stocks didn’t. So, when I look at gold going into next week, we have heavy resistance here. My view is that if we can break through 18.32, that that is going to trigger a move back to the price on open, which is 18.85 That’s what I’m looking for, a bigger move back up to that area and then we can reassess from there.
The indicators from VantagePoint, we are holding above the T-cross long at 18.09. That is our immediate support for this coming week. Our additional support is the verified support at 17.92. That is then followed by 17.52. I would need a breakdown below 17.52 to take the pressure off the upside here. My view is that again, is that it would be perfectly normal for gold to continue to extend its gains into September. Then again, we will reassess at that time, the predicted differences have crossed to the upside, we are above the zero line. Once again, very important that we hold above that particular level.
Bitcoin
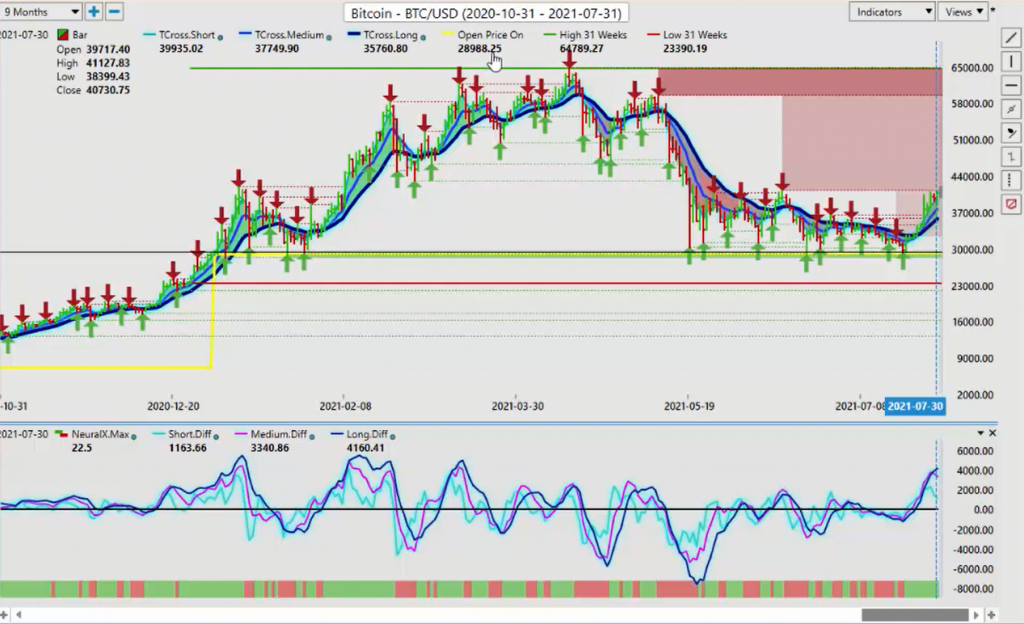
Now, if we do a comparative analysis while we’re hot on the trail of this, and we look at Bitcoin investment trust or Bitcoin contracts themselves. So what we’ll do is we’ll again, we’ll come out and let’s have a look at the actual market structure. The market structure here is a very interesting one because what we can assess is that our 32 week low is 23.390, but our 31 week high here guys is 64.789. The price on open is that area that I’ve talked about, the Coinbase yearly opening price at 28.9000. We’re coming off that, watching CNBC this past week on Monday, when they tried to explain this. Unfortunately, they asked Jim Cramer the question and he had no clue. He was stumbling and stuttering. He had no idea why this thing went up. He said, “It’s nothing more than a short squeeze.” Well, that’s an awful lot of short squeezes, isn’t it guys? So, let’s call this what this is support or demand.
People are buying this thing down here and those people include me and I will continue to do that, why this level particular holds. So again, if I’m looking at my price on open at 28.988, that is a basic supply and demand, or support and demand issue. So, the market is holding down here. I believe I discussed this last week when this move actually started by using that predicted moving average. This move actually started on July the 21st when we closed above that VP blue line, that very powerful predicted moving average. Our predicted differences were starting to rise. We had a solid neural index.
Here’s the problem this week, guys, we should expect some type of dollar strength because it’s a repetitive pattern that’s been identified. The resistance on Bitcoin is at about the 41,300 mark. So if we push above this on, say for example, early Monday trade, I would be very cautious about continuing to buy this because we’ve seen the markets reverse. Whatever happens on Monday, it often reverses on Tuesday. So the resistance area is up here. Once again, when we combine the verified resistance zone with the VantagePoint predicted indicators, the trigger here in my respectful opinion only, will be when that neural index goes from green to red. The MA diff has crossing down against a verified resistance zone. That is something we must be very cautious of buying around this area, despite the fact where if we have a good move down here, but I’ve often stated that the further the distance gets between the blue line and the black line, that’s not always a good thing, guys. That also could be warning that it’s getting overbought here and I’m not using standard indicators, stochastics, RSIs for gauging overbought and oversold. I’m going to use verified resistance, highs and lows. These are the areas that we want to watch and these predictive indicators.
So, basically what this is telling us right here is the medium-term trend is weakening against the longer term uptrend. So, we could be locked in this channel for, for another couple of weeks. If we fail to close above this level. To be clear, you get a lot of bull traps around areas like this. So, don’t think it’s a free for all buying up here. I think we need to stand down on this one actually, and wait it out until about Wednesday and see if we can actually penetrate through this very strong resistance level and clear it. I think there’s a strong possibility, but my optimism on that remains heavily guarded because of that crossover.
Now, once again, if Bitcoin does fall here, guys, then this makes these inner market correlations all the more interesting to us. So these markets that are highly correlated to Bitcoin, 96%, you can see these ticker symbols. There’s a whole bunch of stocks in here, who would think that TripAdvisor has a 95% positive correlation to Bitcoin? Not me. I would never have guessed that in a million years. Or Manulife, or the Aussie Swiss franc, or the VSH, I wouldn’t have guessed any of that.
Now the inverse correlation, meaning that if Bitcoin continues to extend, then this grouping here is likely to continue to move lower euro, Australia, there a bunch of different markets in here, but the main thing is, is that we can identify them in the yearly. I can look at it from a quarterly perspective where you can see they all changed. All of a sudden, those yearly correlations were replaced with a whole bunch of digital currencies. If I go down to the month, you see something very similar.
So again, with VantagePoint currently taking the correlation to 31 other markets, I’m actually cheating here. I’m going closer to probably 40 to 45 inner market correlations in the monthly, the quarterly and the yearly, it can be very, very interesting from a learning perspective. So for now, we know where that key level on Bitcoin is, and we must be very, very cautious of that.
S&P 500 Index
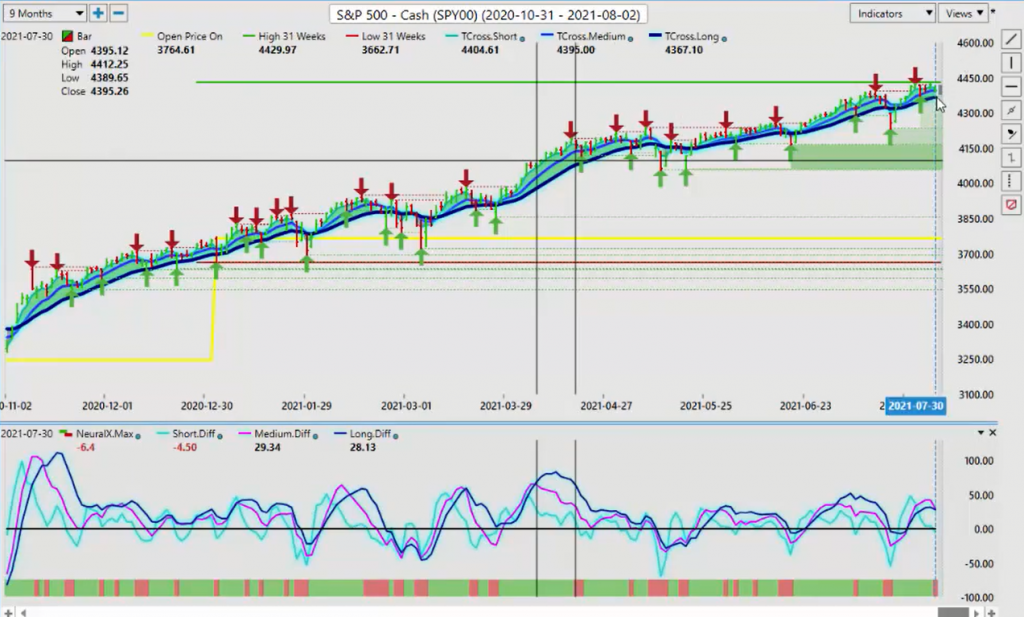
Now, as we look at the S&P 500 going into next week, once again, the S&P is relentless in its move higher. Now, when we look at this again, from the perspective of … This is what I don’t really … Which makes me a little bit nervous. The 31 week high, it keeps moving up. So, number one, it tells us that it is bullish still, but I prefer this thing in a lot of different markets to make them rather sooner. So, this high, they continue to make new highs and I don’t know how much longer we can keep doing this for. I’m not at this time going to try and predict it because you can see that my key level here, my price on open at 37.64, Here’s what I will say that I’ve seen almost every single year, is that the further we move away from the yearly opening price, the more likely it is we’re going to retrace to it. I’ve seen it usually later in the year, but just be mindful of that.
Now, our 31 week low is all the way down, 36.62. And again, that 31 week high 44.29. That’s crazy. But for this week, 43.67 is the level that we want to watch. Now again, when we break this down, we’re looking for indicators that are warning signs. Once again, there it is. The medium term crossing the long-term predicted difference that neural index, surprisingly has gone off first in this particular case. So if this cross completes, we could see a corrective move.
Now, here’s what I will share with you. What I have seen with this MA diff is that it has been highly effective with the S&P 500 on longs. On shorts, it has struggled to some degree, and that’s because I believe that this market is so heavily manipulated, or people are siding with the Fed, that they’re not going to raise rates anytime soon and it just keeps pushing stocks higher. This past week with the Fed, not a lot different. So it recovered, but we are getting a warning sign that yes, the uptrend is still in place. But what we’ve got to look at here is a potential corrective move back down to 43.67.
That’s what I would anticipate is likely going to happen to start the week into Monday and Tuesday, we’ll see where we’re at on Wednesday. But again, if that dollar gets a boost this week, as it normally does in the week of the nonfarm payroll number, because people are again, they buy the rumor, they sell the fact. They’re actually buying hope. They hope that nonfarm payroll number is going to be very strong and it’s going to change the Fed’s mind and that’s going to boost the dollar. That may happen here, guys, but this is one stubborn Fed, so I don’t think so.
I think that whatever that number is, the Fed is going to say it’s transitory. But again, we will see. For now, stocks are firm, 43.67 is the level we want to watch. If we click on our F8, you can see that we’re struggling to hold above this blue line. That key level, the VantagePoint level, 43.99. We have actually closed below that on Friday. So we’re going to be monitoring this level very, very closely at the … Let’s, just round it out to the 4,400 mark. If we start breaking down below that, then we’re likely going to get a bigger move to the downside. Of course the same thing when we look at the S&P 500, we want to make sure that we understand the main correlation, the big correlation that this one has, which of course is light sweet crude oil.
Crude Oil
Now again, with light sweet crude oil, we keep making new 31 week highs. Now I could go back in the VantagePoint indicator, the 52 week lookback, but that is modified. In the coming weeks, I will show you different ways again, to use that. Because again, if we go into our properties and we look at that 52 week lookback, there is some very interesting things you can do here.
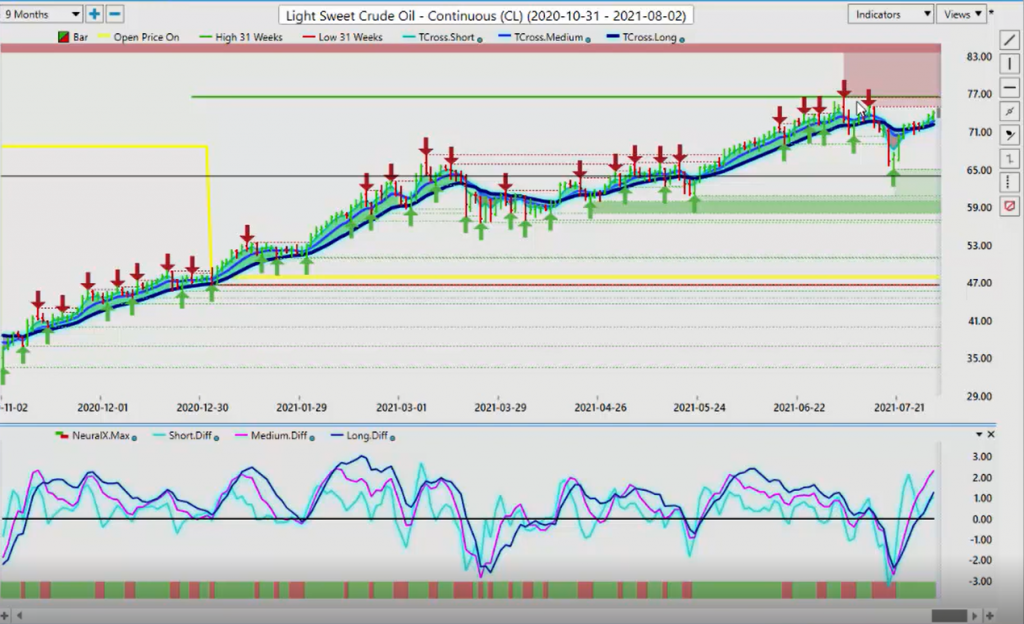
Now, when we look at that, you can see, I can set the number of periods to whatever I want, so I can go 52. I can go two, I could go one, to start the week. There’s a number of different ways that I could actually do this and it is extremely … I can also do that with, again, the point in time. One of the tricks I like to do with that is on the weekly. The weekly opening price is almost as important to me as the yearly opening price. I like to combine them both, but when we look at oil, oil is a fresh buy signal here, so we’re starting to extend higher. What we want to do is identify again, where we’re at here, guys. So 72.14, we’re looking for that level to hold. We’ve got a fresh buy signal on here. Our predicted differences are really moving and there’s good separation here. The slope is good, everything is good. But again, it’s the week of the nonfarm payroll number, oil will succumb to any sell off in the S&P 500, oil will likely follow.
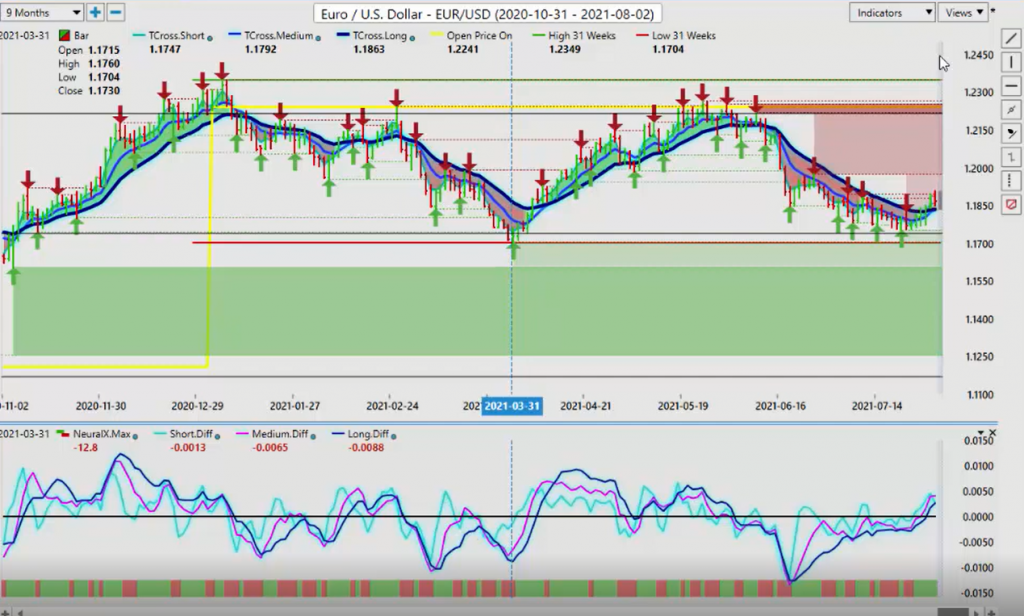
Now, as we move into some of our Forex pairs for next week, which is obviously my bread and butter, the key markets that I do, we look at the Euro, US, the number one traded pair. Now with my own direct client base and in the VantagePoint live training room, we’re really only been looking at longs on this for some time now, for a couple of weeks because I anticipate that this 31 week low is going to hold at the 1.17 mark, and there’ll be a buying opportunity.
Euro versus U.S. Dollar
But the direct correlation, when we break this down, that we really want to understand is that gold is always playing a part in this in some way, shape or form. Could be a gold stock, it could be a gold ETF, but you notice here on the quarterly, you’ve got Yamaha Gold, Equinox Gold, K stock. The common denominator here guys is gold. The inverse correlation again, is down here with the dollar index. Now, on a yearly that those inner markets change to some degree, but the dollar index is a constant. It’s always pretty much there. We see that this euro up here, once again … I really love the way that whoever wrote that VantagePoint article stated that these inner market correlations can immunize you from fake news, from academic opinion. The inner market correlation, this is a machine guys, there’s a 98.45% positive correlation between the euro and gold.
So with that 98% correlation, I’ve discussed this also in the VP room where we’ve done a form of naked trading, where we’re looking solely at these inner market correlations and the key VantagePoint pivot areas. Now, if the euro was going to come under pressure, it would be this week for a couple of days because of the nonfarm payroll. We have verified resistance and that resistance is coming up way up here. That’s coming in at or about this high of 118.95. We need to clear it, get above it, then we should easily be able to target the high of 119.75, but we need the support of gold.
So, we need gold holding the line. Gold is likely to come under a bit of pressure with a nonfarm payroll coming up. But the week after next, I would anticipate gold would extend its gains, regardless of that payroll number. So once again, we will watch these key levels, the VantagePoint major support level now on our T-cross long is 118.37. When we click on our F8, we want to get as close to price as we can and we can see that the long-predicted is 118.40. We know exactly where that is. So, for the start of trading on Monday, we then can look at the predicted low and it’s at 118.36. So, if we combine those two pivot areas with the predicted low, it tells us exactly where to pick up longs here, guys, when we connect the dots between all of these.
Again, the market structure or profile of this market, which I showed you in the nine-month timeframe, it favors the euro. One of the big things that is helping the euro is gold’s recovery.
Swiss Franc
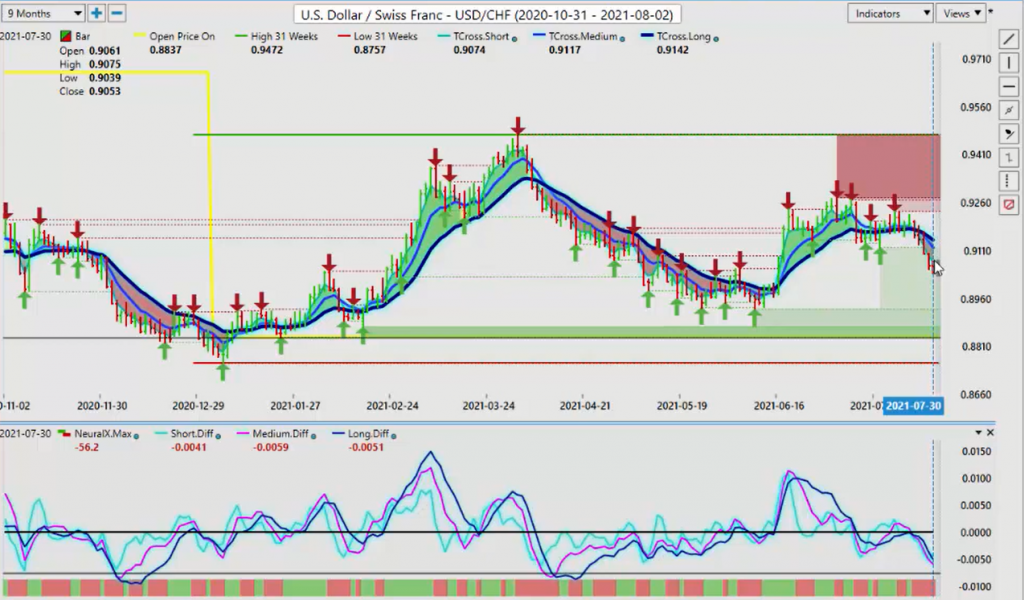
Now, the same thing inversely helps the Swiss franc, as gold goes up, that also puts pressure on the dollar and it benefits the Swiss franc. We see the exact same thing happening here. Now, we’ve got our … Again, we can bring up our 52 week high, or excuse me, our 31 week high and our 31 week low, I’m really stumbling on that one. And then our market price on open, which of course is 88.37. So an actual fact, as bearish as this chart looks, still, we’ve been above the yearly opening price for the entire calendar year. It’s actually been quite strong. We’re making a higher low here, so that looks pretty good. So again, we’re going to see if we can break down or even test this verified support low at 89.26. That is in the crosshairs right now, as we continue to move lower. But again, we need assistance from gold to continue to extend higher, to help push this pair lower. The KVP levels for this week, 91.42. That’s the level you want to watch. Short, we’re stay short as long as we’re below that particular level. If we break above it, that will likely come. You will see the medium term crossing the long-term predicted difference, and that will warn us that something else is happening here.
British Pound versus U.S. Dollar
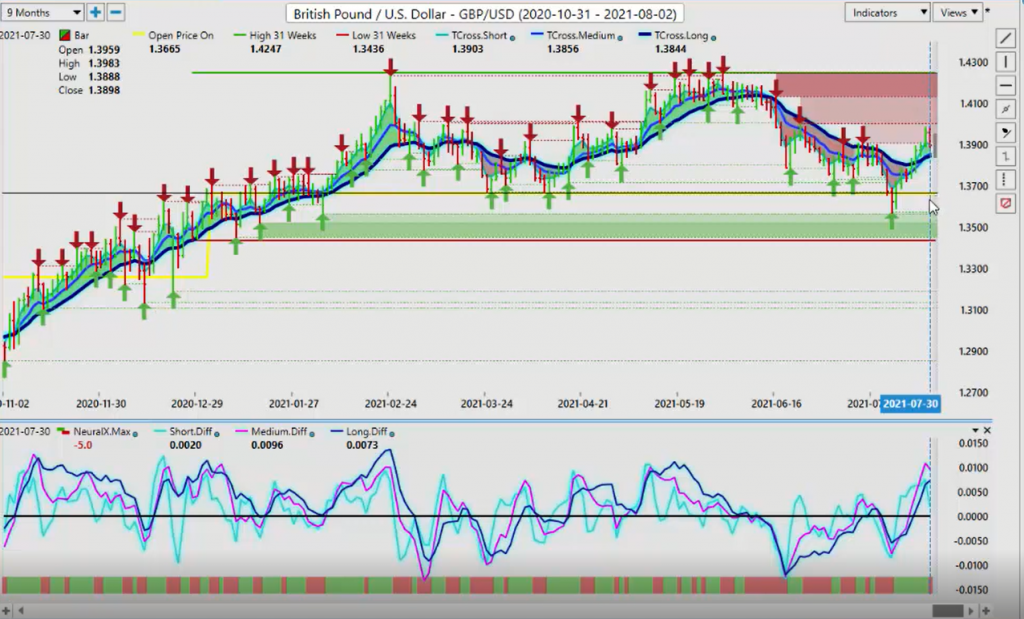
Now, with the pound, dollar, again, we can see the market structure of the pound, dollar on a nine-month basis. So when we click on this once again, we can see that our 31 week high, 142.47 and our 31 week low is 134.36. This yellow line, this price on open is as close to the yearly opening prices I can get. So, it can tell me that 136.65. Now you remember, I think it was last Monday or the Monday before that, where OPEC came out over the weekend and caused this massive two crash in the pound dollar. Now, what I’d stated on here, what I’d stated in the VantagePoint live room is don’t buy into this. The British pound has a very, very high inner market correlation to light sweet crude oil. Oil rebounds, which we know it will in summer driving season. There’s no way they’re going to give us a break at the gas pumps, guys. This is a repetitive pattern. You can call it a seasonality. I’m cool, I’m okay with that. Call it whatever you want as long as you identify it. So oil rebounds, stocks rebound, pound, dollar goes higher, US, CAD goes lower. That’s exactly what happened. But these inner market correlations are a form of naked trading that tell us that we should be focused on a rebound in those other markets. This is a buying opportunity and it was one heck of a buying opportunity.
So, when we look at this right now, the pound, dollar for next week, we can get our pricing right here, 138.44. We’re looking for the market to hold above that. When we look at the VantagePoint predicted low for Monday’s trading is 138.40, that’s a reasonable area to continue with longs.
Here’s where my concerns lie. As we zoom this chart in a little bit to look at this closer, we can see that predicted difference, that slope of that medium term predicted difference is not overly bullish. It still is, we’re above the zero line, but this is warning that it’s coming into corrective territory. Our neural index is picking up on that and it’s starting to slip again. So I would suspect that we are definitely going to come down to 138.44, but we need to hold above that level. So, watch that level very closely. You can also use your F8 and you can get in even closer. The long predicted, 138.78. These are two main pivot areas. If we crash lower, they will become your resistance for the week. That’s what you want to keep an eye on. But again, watch these predicted differences to see if we get across or not.
U.S. Dollar versus Japanese Yen
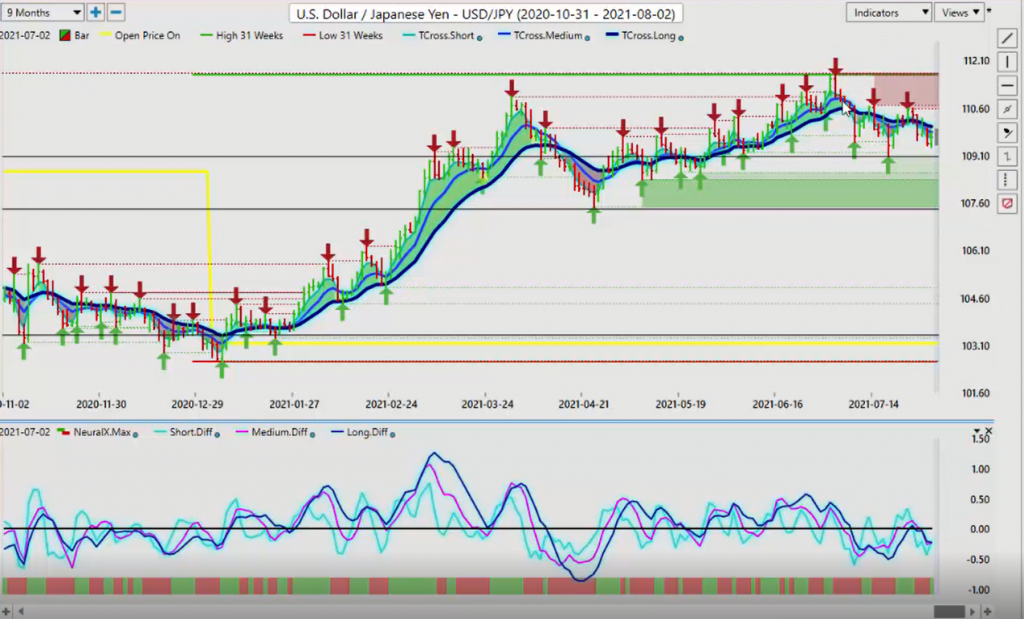
Now with the dollar, yen. Once again, the structure of the dollar, yen, the yen has not done well, but this again brings gold into play. There’s a very high correlation, positive correlation, between the yen and gold. So as gold tries to recover, you can see that the dollar, yen no longer extends. So, it really is going to be watching gold prices this pair. The currency traders should be watching gold very closely. If gold tanks, then the dollar, yen is going to reverse here, guys. But when we look at our 31 week high and low we’re playing a very, very big range on this thing. 111.66 to 102.59 with a price on open on the year 103.17. I don’t know if we’ll get down to 103.17, it certainly is possible, but we’re going to need gold prices moving. So once again, when we take a brief, deeper dive into this, when we look at some of these markets and we can go into the monthly, we can go into the quarterly. We can look at all through these and these inverse correlations, you can see that you’ve got Barrick Gold, you’re going to have a number of different gold and any kind of mining stocks tend to be in there. But the Japanese yen futures contracts obviously are big ones.
The treasury bonds play a part, but these inverse correlations are very, very important to us guys because they give us a lead signal as to which way this thing is going to go. Again, the structure inside the neural networks when we look at this from the futures side, these are some of the bigger ones. You can see gold, the euro, the dollar index, the Nikkei, the Japanese yen, the five year T-note, the 10 year T-note, natural gas, light sweet crude oil. This is what it looks like guys, inside of a neural network. Very, very important that we look at this.
So again, our resistance to begin the week is 110.02. We’re going to see if we can get back up above that. But in my respectful opinion, we would need a breakdown on gold below 17.90 in order for this pair to actually recover.
U.S. Dollar versus Canadian Dollar
Now, as we look some of our main equity slash commodity currencies, the US, CAD, we can see the structure of this, of this particular pair. Again, when we look at it from this perspective our high for the year period is 128.81, our low, 120.07. So a pretty big range here for US, Canada on the year so far, about 800 pips.
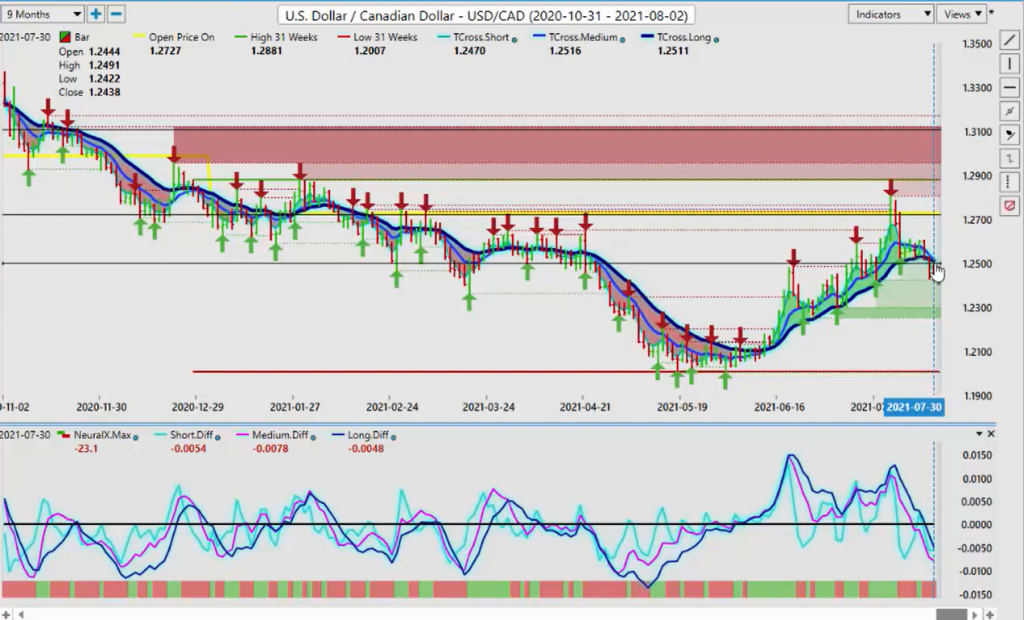
Now, our T-cross long is 125.11. We’ve broken down below that. That’s our resistance to begin the week. If we’re holding below that, then we can expect US, Canada to move lower. My forecast for the year end on US, Canada, it’s a little far out, I don’t like to do that, but I’m looking for around the 120, 122 mark, is where I would probably put US, Canada because Canada usually does well up until about November and then that’s the end of it.
So, we’ll watch these key levels at 125.11, our predicted differences are still firmly lower, so I would be expecting it. But again, even if the US dollar strengthens here with the payroll number, in most cases, that’s a positive for the Canadian dollar also. Remember, these two are the two biggest trading partners. So keep a close eye on this but 125.11 is a key area. We click on our F8, we have that additional 125.04. So all of our main pivot levels are there.
The high, we’re coming in the predicted high 124. 84, so if you’re … Just remember, there’s a holiday in Canada on Monday, so be mindful of that. Canadian dollar is notorious for reversing around, reversing on whatever move it made on Monday, it often reverses on Tuesday. So we’re going to move that out to Tuesday is the real trading day, Wednesday’s the reversal because of the holiday on Monday.
Australian Dollar versus U.S. Dollar
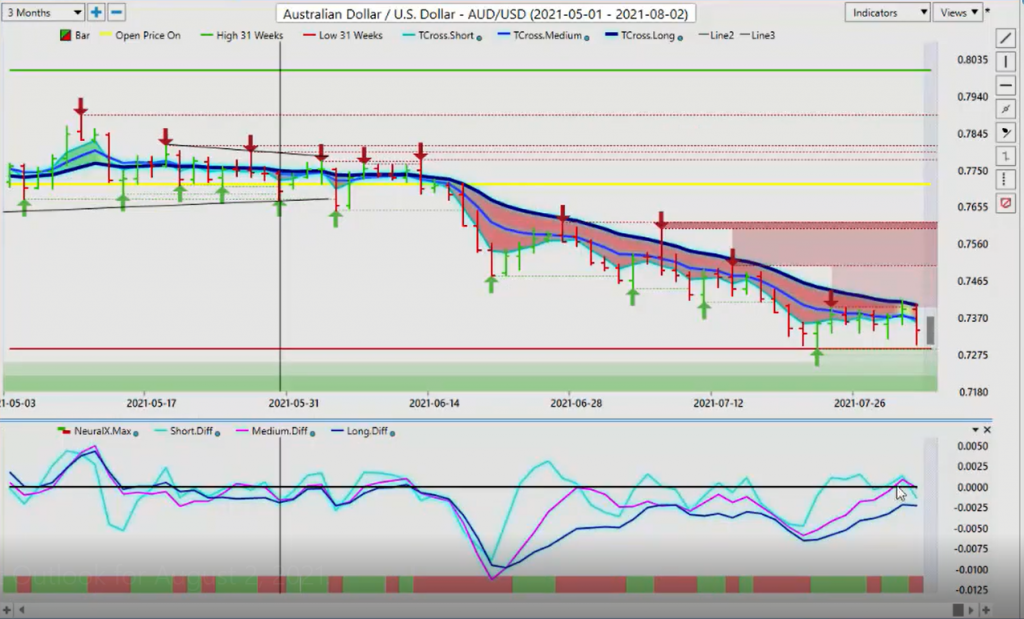
Now, when we look at the Aussie and the New Zealand, similar, almost identical trades. It keeps inching lower here. Now, when we look at this again on the broader market profile, the high 80, is around the 80 mark, the low 72.89 up from a 31 week period with the price on open around the year at 77.13. So again, still looking rather bearish. Here’s my concern with this pair is that our medium term predicted difference, we can now zoom in on this a little bit, excuse me, and we can see that we’re trying to get above the zero line with the medium-term predicted difference, but now we’ve got that reverse checkmark again, and it’s pushing back down below the zero line.
We’ve hit into the VantagePoint resistance area two days in a row, unable to get above it. So our resistance point, the T-cross long, at 74.03, is a major level for us. If we can break above that, and I’ve often discussed this in the past, what I will do is I will actually put limit orders just above 74.03, as soon as we get above it, it’ll click in my long trade and I’m good to go. Because I think shorts are a little dangerous down here, but we are coming off a corrective phase with the predicted differences but my bigger concern, also using that 31 week lookback, this new low was just set a matter of days ago. So, it’s a little difficult to make a bullish argument on this particular pair at this particular time, when we look at this structure, because again, the AI just simply finds that new low, and then marks it, so be cautious with this one.
New Zealand Dollar versus Australian Dollar
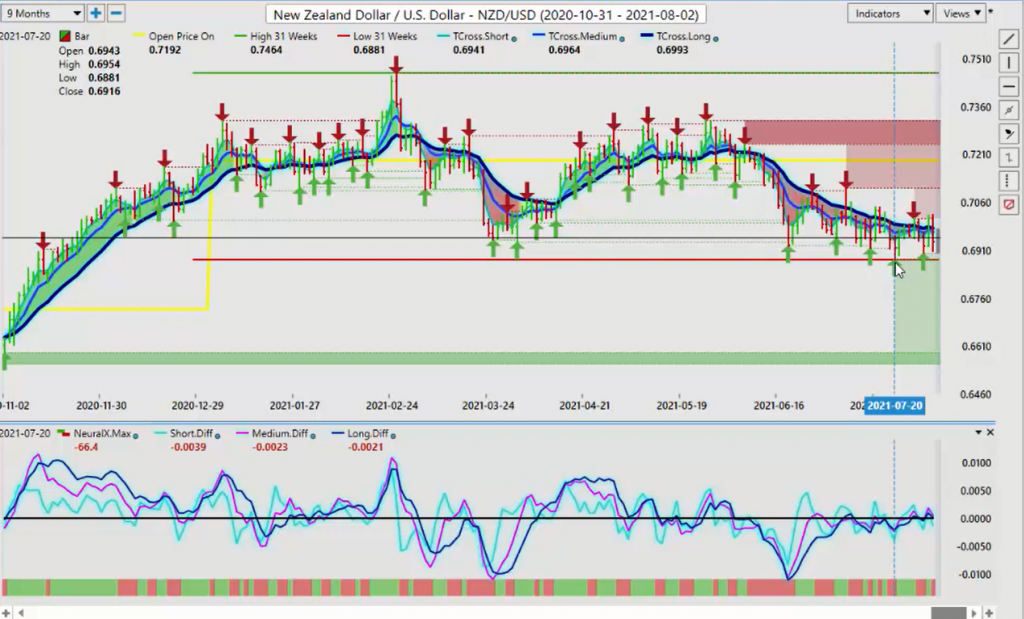
I would argue the same thing with New Zealand. You can see that our 31 week … Wow, I’m really stumbling on that, maybe I should have left it at 52 weeks guys, because that word keeps coming out of my mouth, but it’s 31 weeks. Again, why I chose 31 weeks is I’m just trying to get near January 1st, the end of the year. December 30th, January 1st, just to mark where I am in this trading year, and this is what it looks like.
So, we are making new lows on New Zealand and Australia. We have the RBA, the Royal Bank of Australia on, I think it’s Tuesday night, so be careful of that. It’s going to be volatile and it could boost the New Zealand. So if you get a very dovish RBA, believe it or not, New Zealand can actually benefit from that via the Aussie, New Zealand pair. But for now, again, our key levels that we need to get above is the 69.80 mark. I don’t put a lot of weight on Friday’s price here, guys. I really don’t because you’ve got a lot of profit taking. So we could see the Aussie recover, the New Zealand recover, and we could still see that broad dollar weakness, but I will be expecting some type of dollar strength this coming week. So, with that said, this is the VantagePoint AI Market Outlook for the week of August the 2nd …