


Register for a Free Live Training
The Hot Stocks Outlook uses VantagePoint’s market forecasts that are up to 87.4% accurate, demonstrating how traders can improve their timing and direction. In this week’s video, VantagePoint Software reviews forecasts for ProShares Short QQQ ($PSQ), Crispr Therapeutics ($CRSP),
Zoom Video Communications ($ZM), Cracker Barrel Old Country Store($CBRL), Haliburton($HAL), Texas Roadhouse ($TXRH)
Hello again traders, and welcome back to the Hot Stocks Outlook for January 28th, 2022.
Hope you all are having a excellent week out there in the financial markets, and as always, plenty to cover here in today’s Hot Stocks Outlook. Interestingly enough, we’re actually going to be starting today with a ETF.
So we’re actually going to look at the ProShares Short Qs, which is a inverse ETF that actually goes up when the NASDAQ goes lower. And why might we be looking at this ETF today? Well, actually it has to do with a lot of the stocks that we’ve been highlighting in previous Hot Stocks Outlooks and seeing a lot of this weakness throughout the tech space. We’re going to look at CRISPR and Zoom, and I really encouraged you to go back and watch some of the Hot Stocks Outlooks really all the way from mid-December, where we started to see this weakness and that’s where we start highlighting some of these short opportunities and things like energies being more bullish than some of these other high growth areas in the marketplace.
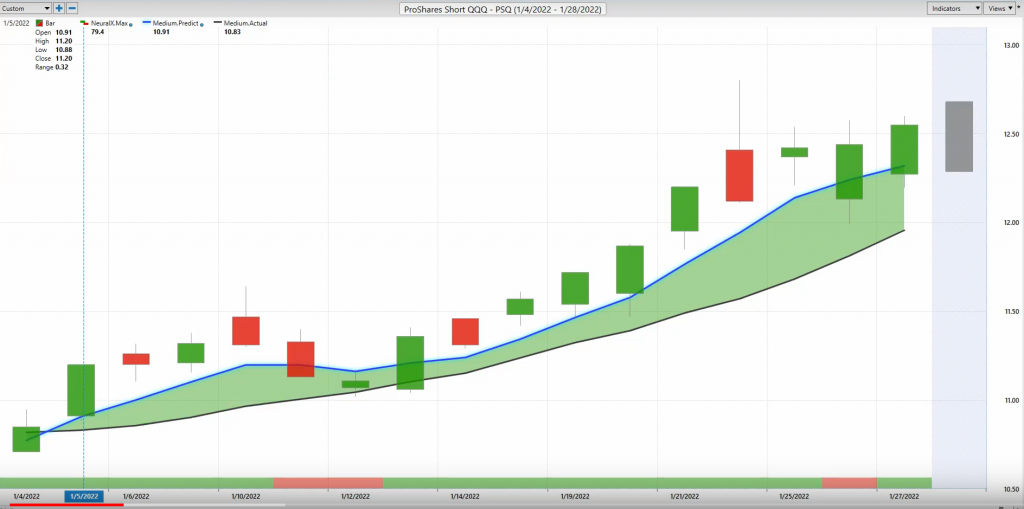
But as it pertains to the Short Qs here, what we have here is daily price action against the chart. And right up against that price action, you’re going to see that there is a black line there and also a blue line. Now the black line that you’re seeing there is a simple moving average. It’s a very common technical indicator. And in this case, it just looks back over the previous 10 closes. It’s going to add those all together and then divide by 10. And that’s very good to smooth out the existing price action and let us know where a market has been over a given period of time, but obviously the savvy trader needs to be ahead of the market and understand where are prices going next.
And so what we want to do is actually compare that black value or that simple moving average to this predicted moving average. And so for this number to get calculated and plotted against the chart for traders each and every trading day, this is where VantagePoint’s technology of artificial neural networks come in, and specifically they’re performing what’s called intermarket analysis. And what that means is it’s looking for relationships between markets that offer very important clues as to future price action. So when we’re looking at things like the inverse ETF for the Qs, well, what is that going to pertain to? Well, it’s going to look at things like, well, the NASDAQ and the S&P futures. It’s going to look at things like global commodities, like oil, gold, copper prices. It’s going to look at interest rates, the bond market. It’s going to look at ETFs around the tech space. It’s going to look at all of these individual markets that are known to drive and influence specifically this ProShares inverse ETF.
And so what the trader’s able to do is understand that, okay, well, not only do I see weakness coming in specifically here, but that has implications throughout the broader marketplace, and that can really help the trader understand broadly, where should I be looking for opportunities in the marketplace? And so we see that blue line crossing above the black line, and that’s all great, but there’s more to this forecast and more being derived from that inner market approach. So if you look at the very bottom of the chart, you’ll see that there’s a bar here that actually goes from green to red, back to green, and this gets updated each and every trading day at the very right-hand side of the chart. And every single day, it’ll be green or red. And that also is utilizing that technology of artificial neural networks, but it’s tuned differently not to forecast future prices, sort of like a predicted moving average, but really looking ahead very short-term over 48-hour windows, so short-term strength or weakness in the market.
So when the trader understands look, the overall trend direction is up, but maybe there might be some weakness here over the next 48 hours, well, that’s very important information for the trader to have. So they either hold onto the position, maybe accumulate more of a position with the help of tools like the predicted high and predicted low. So if you actually look at the very right-hand side of the chart here, you see every day you get a shadow candle. And what that is highlighting is a prediction for intraday high and low levels in the market where you can set limit orders, profit targets, and just factor that into your approach to the market, this overall forecast of overall trend, short-term strength or weakness, predicted highs and lows, to forecast trend shifts and changes in the market.
So what we have here is you see that blue line crossing above the black line, Neural Index, quite bullish for the duration aside from this little pullback you have here. And then we can look at those predicted highs and lows and what you’re looking at is how accurate all of those predictions were before the trading day occurred, right? So we’re going to have the actual market. Data’s going to fill in there and see how accurate today’s forecast was. But look at this moving forward. If you’re understanding, hey, well, there’s weakness in NASDAQ, where might I want to be accumulating shorts or potentially long via this ETF where you could use this in a retirement account and something like that to get that bearish exposure to markets? And you see this updated forecast where you’re not always going to pull back to the predicted low, but oftentimes you see that while the trend is up, very snappy pullback, and immediately moving higher. Again, here a gap down and trading up towards those predicted highs.
So tremendous opportunities throughout the tech space here to potentially short the ETF and get more of a aggregate exposure to that. But really through some of these individual stocks, we’ve seen some tremendous moves. You’ve seen about a 12 and a half percent rally there in the inverse bearish NASDAQ.
But let’s revisit CRISPR here. And this is just coming back to a stock and you see having this blue line or predicted moving average crossing below the black line all the way back in December. So this weakness currently coming in more aggressively on the index side, this is not very much of a surprise. And we see this more updated forecast for CRISPR, and I just want to highlight the accuracy of some of these short-term tools that we look at week to week from the predicted highs and lows.
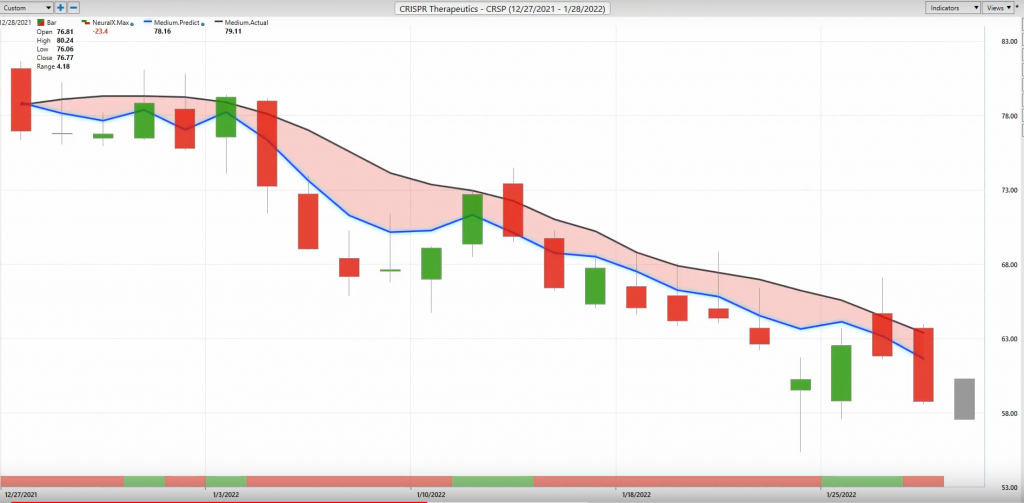
And we can go ahead and bring those up and you see that, okay, well, a lot of volatility in this stock. You see push up, but always closing down towards these predicted highs. And look at all of this. You have these predicted lows coming here. You gap down here. Even before this trading day, that predicted high is saying, “Look, the market’s likely to trade up towards that level. That’s where you should expect prices to move for accumulating what looks to be more short opportunities.” And you see it trade right down to that predicted low. So we’ve looked week to week at this long opportunity. It’s been happening for now well over a month here, and that’s been a tremendous move, but it’s more… What I’m trying to highlight here is the updated forecast, that short-term trader, whether he wants to add to the position, whether you’re just a day trader. You can use this information to understand where should I be focusing capital in the market, and then specifically use the tools and guidance from those predicted highs and lows Neural Index to make the most of those trading opportunities.
And so, yeah, 26% move lower here, but potentially even more profitable might be this 11 and a half percent move just over the past two trading days from those predicted highs. So there’s really tremendous opportunities where you know where to look and then have the short-term forecasting to really minimize the risk and help you drill down on what you’re trying to get involved in.
Zoom Video Communications ($ZM)
Here’s Zoom Communications. And again, very similar, this isn’t weakness that just showed up this past week, right? It’s been spread out and been very difficult to actually highlight, well, where that… There’s very strong opportunities in the market. Well, one of those things has been energies and defensive stocks, and that’s why we’re going to see Halliburton. We looked at Hess stock. Those are much safer areas if you’re on the long side, but as far as these high growth stocks like Zoom, well, here, you see very clearly that blue line crossing below the black line, and it doesn’t really get much more bearish than this, right?
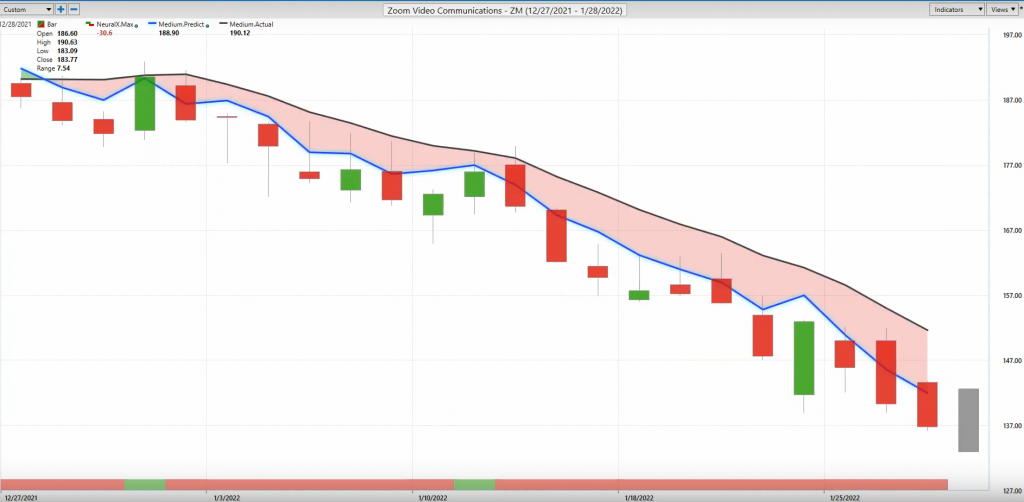
You get a little bit of a Neural Index bullish there, another retracement here. You get a little bit of gap up and then go lower. But this is clearly a very weak area throughout the market, and the predicted highs and lows over the past couple weeks doing their jobs as far as letting you know, hey, intraday, where’s a great place to go ahead and potentially hedge maybe some long positions you have in the market, just outright short the market, or add to some of these short positions that may have been in the portfolio now for well over a month here. So here in Zoom Video, a tremendous move lower, another 26% decline. But again, more recently seeing a lot of that really accelerate. Now, should that reverse and move to the upside? Well, we’ll be there to see a lot of this start reversing and we’ll likely see the ETFs reverse and the futures, but you’re not seeing that. And then the appropriate play here has been to short the market.
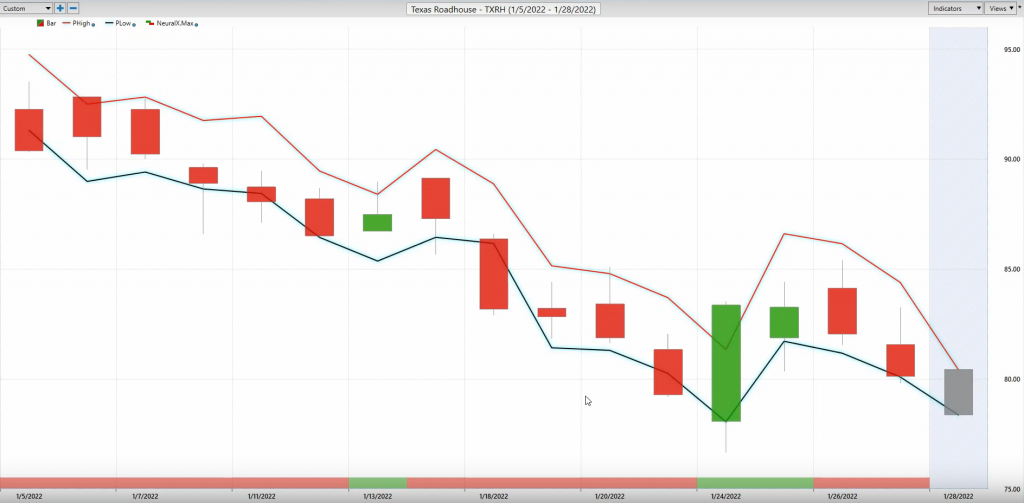
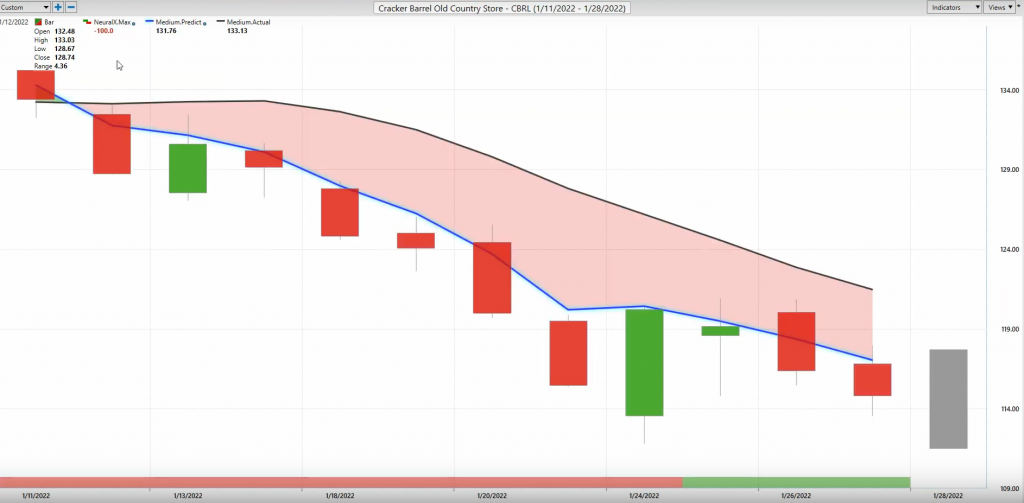
Now, if we go ahead and we looked at some of these restaurant stocks, again, some of this more recent weakness we looked last week with Texas Roadhouse, but here’s Cracker Barrel, and you see the same story, a tremendous amount of weakness with that predicted moving average well below the actual moving average. And when you get that, you tend to pick up as far as the overall volatility in the market. But when you have a tool like VantagePoint that’s going to say, “All right, well, you got this move higher here.” And you see these levels coming in and saying, “Look, if you want to remain short, that’s all fine, but expect the market to want to pop higher here, but still the overall trend to the downside,” and giving you that information to, again, understand that, look, there’s some weakness in many of these areas, Texas Roadhouse, just over the past week, again, looking at those updated forecasts.
Cracker Barrel Old Country Store($CBRL)
And I want to highlight things like this, where we have these sort of days. You get really extended to the downside and you see are coming up to this predicted high level from that previous day. But look at this trading day here, we’re actually… After the close of that day, which is a somewhat bullish day, you actually have your predicted high and low range is actually slanted lower. And well, what does that tell you? Well, look, the market’s rolling over and sure enough, the market rolls over and now, again, moving towards those predicted lows more recently here, as far as the most recent price action. So again, just updating these things, right? If you’re that trader that trades week to week. Well, where are those areas where you might be focusing some capital?
Lastly here, we got to find some bullish opportunities in the marketplace. And so again, the last of what was been left seems to be some of the energy stocks. And you’ve actually seen the futures market in oil remain quite bullish, and that’s been holding up some of the energy stocks, but stocks broadly are under so much pressure that it’s causing problems there too.
Well, here, you have Halliburton a little bit in the oil and need infrastructure and defense space. Here, you have this blue line crossing above the black line all the way back in mid-December, but remaining there and very straightforward here. There’s not a whole lot of areas to find some strength in the market and the most recent past here, but you see this Neural Index getting bearish, another little dip in the marketplace here, but having some pretty good guidance here that says, “Okay, well, if you’re going to be buying something, potentially Halliburton’s a good place to use those forecasts to try to get some of that bullish exposure to what’s been going on.”
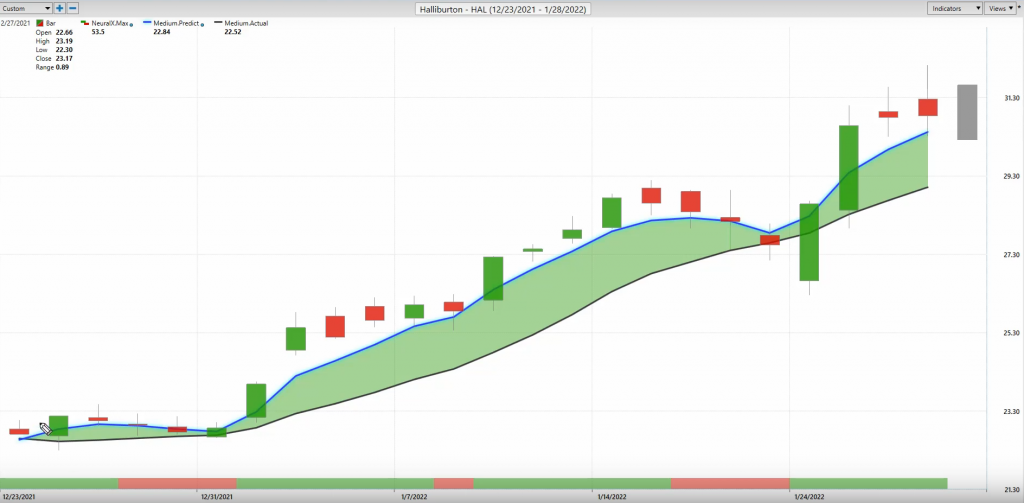
But be very careful on the bullish side and that’s been quite obvious, and we can really see that through some of the other tools found within VantagePoint software here, mostly referring to the VantagePoint Intelliscan. So here we have about a 36% rally in the past 23 trading days. But what I want to highlight here is some of these features with the scan that allows traders to sort via these predictive indicators. So you see here that these are all of the stocks I have added into looking for these fresh crossovers. We can really drill down on what we want to see here, but I just want to highlight things like we can say, okay, well, how many trends are currently in an uptrend? Well, you’ve got 1,500 markets. There’s only 147 that are currently an uptrend, which mean a very large number of those are currently in downtrend.
Additionally, we can do things like say, okay, well, what’s currently maybe shifting around? We’ve seen the dollar advanced tremendously. That’s pushing down silver and gold, some of those mining stocks we see here, some of those basic material stocks coming through. And so this is what the software is able to pick up on. And the trader can really tune this to cater to exactly their timeframe and the types of markets that they like to trade. But more importantly, having these tools is going to help you understand, where should I focus my capital? Where are different opportunities opening up? Because it’s not just related to that individual stock. These things are affected by other stocks, other ETFs, the broader market, crude oil prices, interest rates, and that’s getting, well, quite obvious more recently that markets are being affected. It’s creating a lot of volatility and there’s a way to be ahead of all that. So I’ll go ahead and leave it there. But once again, this has been our Hot Stocks Outlook for January 28th, 2022. Thank you all for watching. Best of luck and bye for now.


