Register for a Free Live Training
The Hot Stocks Outlook uses VantagePoint’s market forecasts that are up to 87.4% accurate, demonstrating how traders can improve their timing and direction. In this week’s video, VantagePoint Software reviews forecasts for Caesar’s Entertainment ($CZR), Cubesmart ($CUBE), L3 Harris Technology ($LHX), Caterpillar ($CAT), and Overstock ($OSTK)
Hello again traders, and welcome back to the Hot Stocks Outlook for September 24th, 2021. Hope you all are having an excellent week out there in the financial markets and as always, plenty to cover here in today’s outlook.
So we’re going to go ahead. We’ll start out with Caesars Entertainment. We also have CubeSmart, L3Harris, Caterpillar, and we’ll end with shares of Overstock. But what I really want to highlight here is if you’ve watched previous Hot Stocks Outlook, which I really encourage, just go back a couple months, watch these things as we walk forward through time, but we’ve seen a lot of volatility very recently in markets. And that is going to affect your overall portfolio. Maybe you’re long a stock over here, short a stock over here, you got some options, things going on. You have this eclectic portfolio of things and you want to know how to manage that and pull things in and add things to it and take things away.
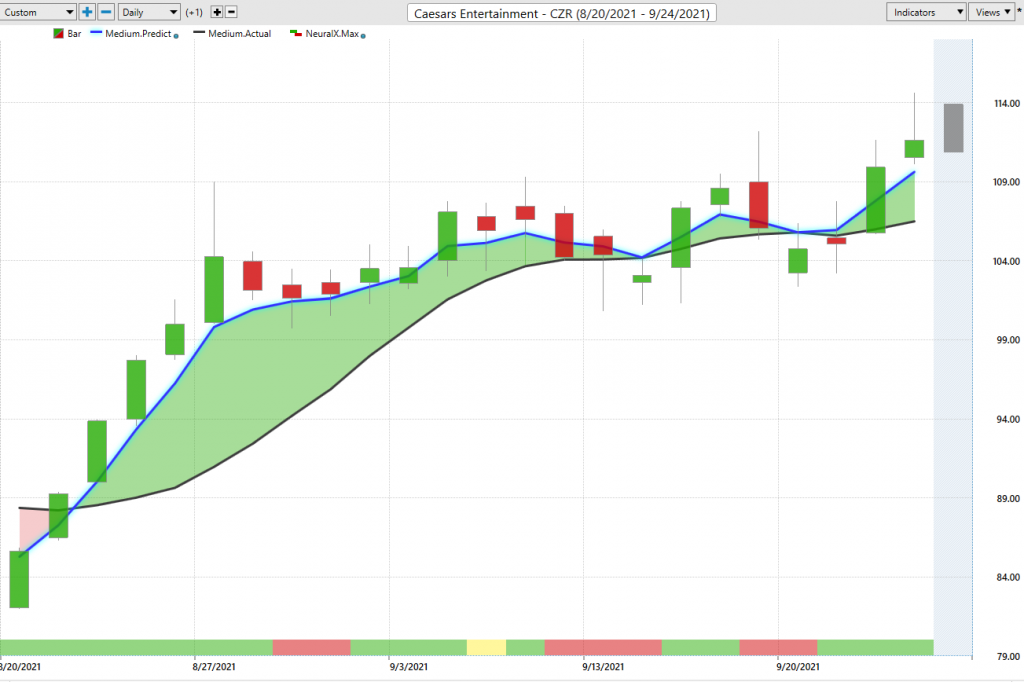
So when we’re looking here at Caesars Entertainment, what we have here is, let’s keep this very simple is daily price action like we do every single week, is daily bars and candles we can see going back all the way about a month ago. And right up against that price data, see that there is a black line and also a blue line. Now the black line that you’re seeing there is what we refer to as the actual simple moving average. And that’s what it is. It’s just a simple moving average, a very common technical indicator that in this case looks back over the previous 10 closed prices, adds them together, divides by 10. And most traders understand that that’s a very common technical indicator and all it really does is smooth out the price data to let us know where prices have been over a given period of time. But traders need to be ahead of the move.
We need to know where prices are likely to go moving next so that we can bring in our strategies, our risk management and make the most of that opportunity. So what we’re able to do with at VantagePoint traders is actually use some scanning features to actually identify when all of this happens. So we can actually use these indicators to really alert us to, okay, there’s a potential opportunity happening here, but if we are trading a market and we see that blue line crossing above the black line, it really just suggests that average price are going to start moving higher than where they’ve been. Now, this is very important. For us to plot that blue value, that numerical value against the chart, VantagePoint is doing what’s called intermarket analysis and it’s utilizing its technology of artificial neural networks to do that. So to explain what that means, it means that for specifically Caesars Entertainment, the neural networks have identified important market relationships.
Now that can be positive correlations relationships, inverse correlations, there can be leading and lagging relationships that traders looking at data, just eyeballing things are not going to be able to pull these things out. And so what it’s able to understand is how individual stocks that are related to maybe gambling and hotels and casinos, but also things like the broader equity markets, things like the dollar index, which if you saw recently, we’ve had a lot of moves in the dollar index and that’s rippled through stocks and that’s affecting the markets that you’re trading. But that’s also going to be things like ETFs, global interest rates. If you’re trading energy companies, the crude oil prices, the dollar index prices, prices of natural gas. So that’s what’s going on and that’s what most traders aren’t doing is understanding how intermarket global relationships are affecting every single day, the markets that they’re trading in.
And so what the software is able to do is understand all of those relationships and actually use that data to generate future price predictions of where prices are expected to move. And it’s that prediction that is used to generate the value of this indicator and really all of the predictive indicators and seeing that blue line crossing above the black line suggest average prices are going to start moving higher and you therefore would want to go ahead and get long. So we can see here in Caesars Entertainment that that blue line has remained above the black line for over a month now. So entire month saying, look, the overall trend is up, but let’s go ahead and continue on. If you look at the bottom of the chart here, you’ll see that you have a bar and this every day gets updated green or red, and this is a very short term indicator.
So it’s only looking ahead 48 hours. And I don’t like to get into too much of the details because you can dig into this stuff and use it in different ways, but it’s kind of like … Most people see artificial intelligence, they see an example of a maze and this computer or robot going through the maze. Well, in the same way, you can set these neural networks to figure out what is the end goal? What are we trying to get to? And so in that way, we have things like the predicted moving average where the overall goal is average prices. But here it’s only looking ahead 48 hours short term strength or weakness in the market and that is used in combination with things like the predicted high and predicted low. So again, not looking at 48 hours or two candles’ general strength or weakness, but you actually have a next day intraday predicted high and low again derived via that intermarket analysis neural network process is picking out all of these levels.
So when you look at the overall forecast for Caesars Entertainment, there can be a lot of different ways you may want to trade it. A trend trader may see the crossover and say, “Hey, it’s time to go ahead and get long.” But what I really love about the software is it’s consistent accuracy day to day. So regardless of strategy, short term, longer term, you can do the trade adjustments and the really money management that’s going to save you. It’s going to really reduce the amount of risk in a market, but also potentially have those position sizes larger when they’re working in your favor. So you see here how the trend breaks out and we get that nice move, but here’s what I want to highlight and this is what I want to highlight going through these subsequent charts here is we’ve seen a lot of volatility throughout the S&P 500.
Market goes up, it’s going down. It’s looking pretty good today, but here’s the thing is this market has gone through all of that and every single day, you’re getting these forecasts that say, look, Caesars Entertainment’s in an up trend. And if you want to be a buyer, even in the short term, even among all of this volatility, you have a roadmap because what’s happening is even on these days where the S&P is clunking down one or 2% somewhere in here, the software is taking that information, looking at the close for your market, looking at those inner market relationships, how did those markets close, what’s going on in there? What’s going on in the global commodity or currency markets? And then it’s able to understand and generate the next subsequent prediction.
So that as a trader who understands, look, I know this is a market I want to be trading. You may have other reasons or directional bias or whatever why you’re trading that market, but you have that roadmap that’s really going to help you take advantage of the short term market participants and help you make a lot of money, especially over periods like this where we see some markets moving up, some markets moving down. But that’s the whole point is you want to know where are those areas where you’re not going to get slammed when the S&P 500 starts moving lower two or 3% a day. And here in Caesars, you see, well, this thing has kept moving up 21%, overall that volatility, all it’s doing is pointing out levels where if anything, you’d be a buyer down at these levels and that overall trend continuing. So with that understanding of again, rehashing what’s gone on in the markets, how these tools work, let’s look at some more opportunities. And this is what you’ve seen broadly throughout the markets.
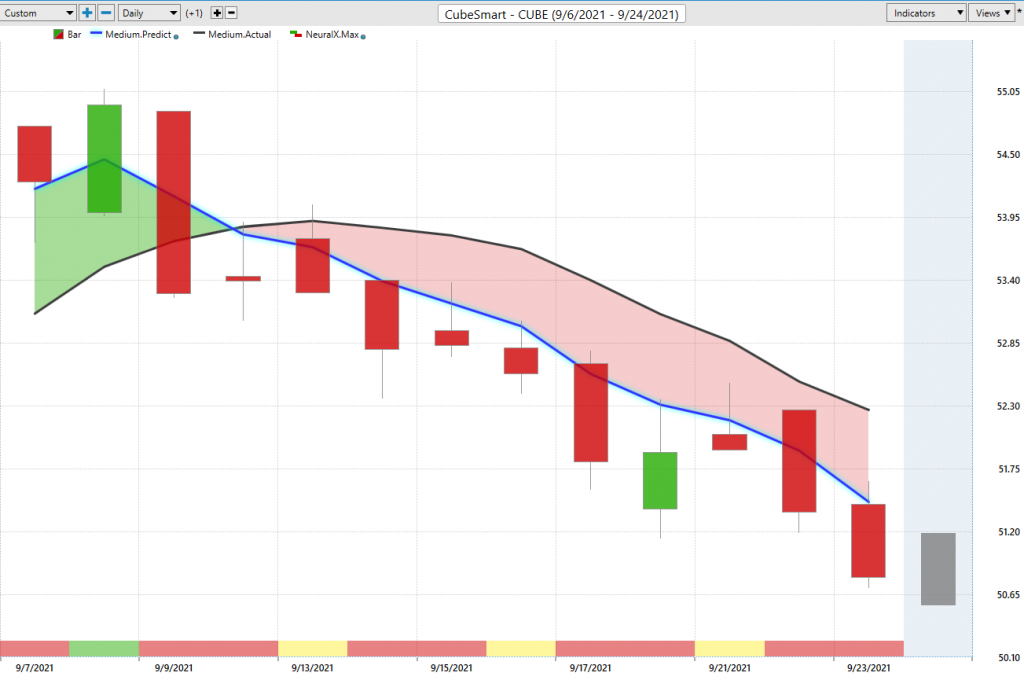
So it’s not like there haven’t been these big alarm bells going off, expect weakness, get out of the way, look for cheaper prices. I don’t know exactly what your strategy is, but if you’re trading CubeSmart at least, it’s very clearly said, look, this crossover’s to the downside. We see all the weakness in the S&P and the broader markets as well. So it makes sense that maybe you want to hedge that portfolio, maybe those longs in Caesar Entertainment, or longs somewhere else. There’s thousands of different markets that VantagePoint forecasts for, but understanding that if you’re going to short, which is difficult to short the market. We get a lot of volatility, but when you have management tools that have you shorting, taking profit, reshorting, maybe covering some of your position, shorting more, shorting more, covering.
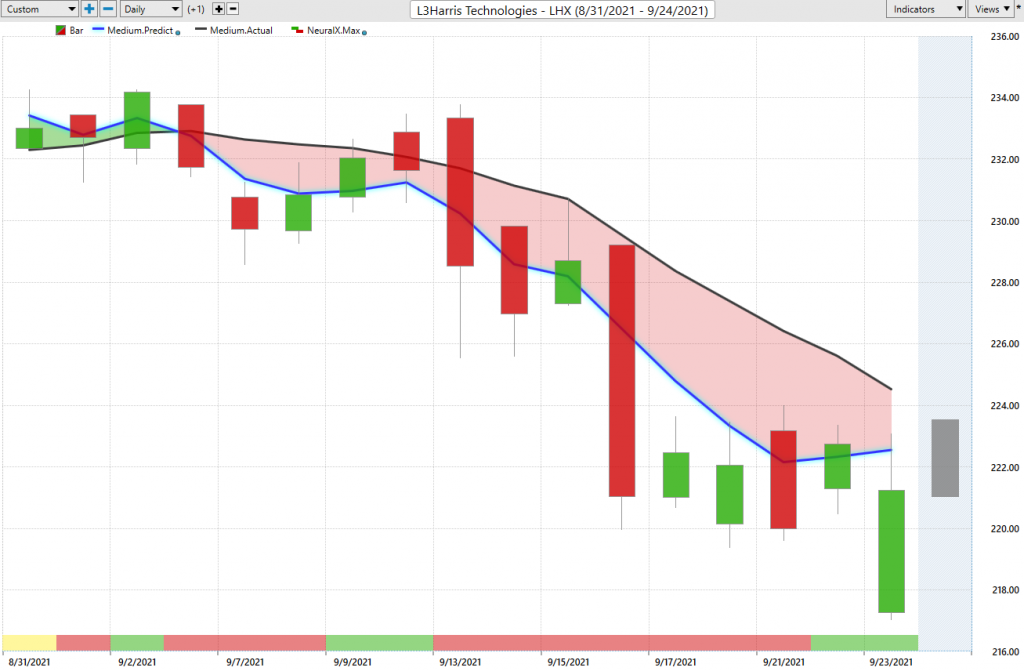
You’re doing one heck of a job of establishing that short position, pulling money out of it and doing a good thing for the overall portfolio, where regardless of where overall market volatility takes you, you’ve got these things in the portfolio skewed to work in your favor. And so we go over to L3Harris, we see the same thing. And again, I’m just pointing out that all this weakness you saw over the past couple weeks is just go back over the past couple weeks of Hot Stocks Outlooks, you’ll hear me saying, “Hey, this dollar’s moving. Stocks are moving. We need to be aware of that.” But depending on which markets you’re participating in, there’s different ways you may want to manage that. And that’s really the whole point of VantagePoint is it does this exceptional job with the short term forecasting on the individual markets that you’re trading.
The Hot Stocks Outlook uses VantagePoint’s market forecasts that are up to 87.4% accurate, demonstrating how traders can improve their timing and direction.
So here with L3Harris, we see again this similar picture. And when we ran the Intelliscan over the past couple weeks, we see a lot of these downward crossovers come through. And so you understand the areas where, hey, these markets are weak. How does that potentially compliment the existing portfolio here? And again, you see that you get these days where neural index gets bullish. You get a couple of bullish days here, but you don’t want to be long. And if any activity is being done, it’s shorting at predicted highs, shorting at higher levels and covering down at predicted lows. But see, we still have, again, these crossovers to the downside. We’ve seen some strength coming into the markets. Neural index gets bullish. We have this on the S&P500 and NASDAQ, the predicted high and low range moving higher, but that’s still a point is use the tools to help guide you moving forward, regardless of the markets that you’re trading and then you can take all this emotionality out of it.
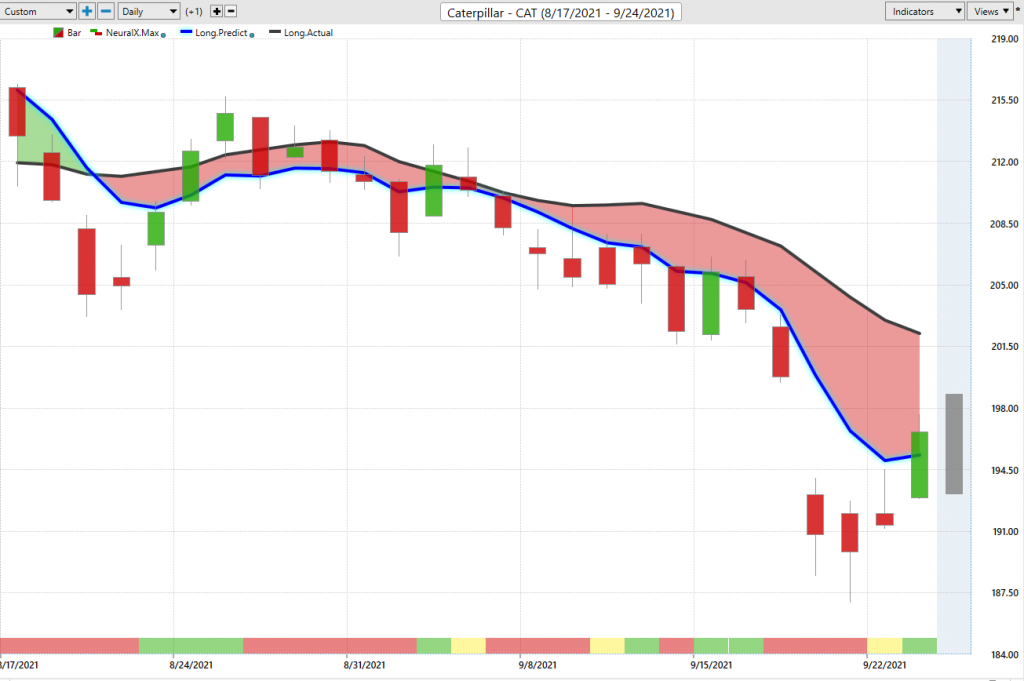
So here are shares of Caterpillar. Again, you see that crossover the downside, you run your scan. All of this is going to come through with plenty of markets during this time period alerting you of this oncoming weakness. You see that neural index goes bullish. You get a couple days where you’re trading at higher highs, but the blue line’s still below the black line, and you only want to take profits on shorts. Again, you see this neural index strength coming in and you’ll get that sideways action trading above that blue line there. But direction is down and you don’t want to be on the wrong side when volatility starts coming into the market and things start moving around here. Again, those predicted highs and low is to help you and before that big drop in the market, what are just chart after chart telling you? Short the market, short up near these predicted highs, and you’ve got a roadmap to benefit off of all that volatility that just came through. But what you really need to understand is you can run this scan every single night.
The Hot Stocks Outlook uses VantagePoint’s market forecasts that are up to 87.4% accurate, demonstrating how traders can improve their timing and direction.
So we can see as markets continue to the upside and are trending as they shift to the downside like they did a couple weeks ago, and as other markets shift to the upside and benefit off of markets recovering. And so while there may be areas where there’s market weakness, I don’t have to worry about getting long in those areas, VantagePoint’s going to alert you and say, okay, well here in Overstock, while we get this crossover to the upside, blue line over black line, and a much easier place to take a long position rather than these areas where VantagePoint is forecasting that continued weakness. So when you’re structuring that portfolio and then trying to decide, okay, well, where am I looking for bullish opportunities? And in this case you’re actually going to get filled at the open there. You got a trading day there. You get filled as well. Back here you see it pitting the predicted low, but clearly only want to be long taking profits on longs.
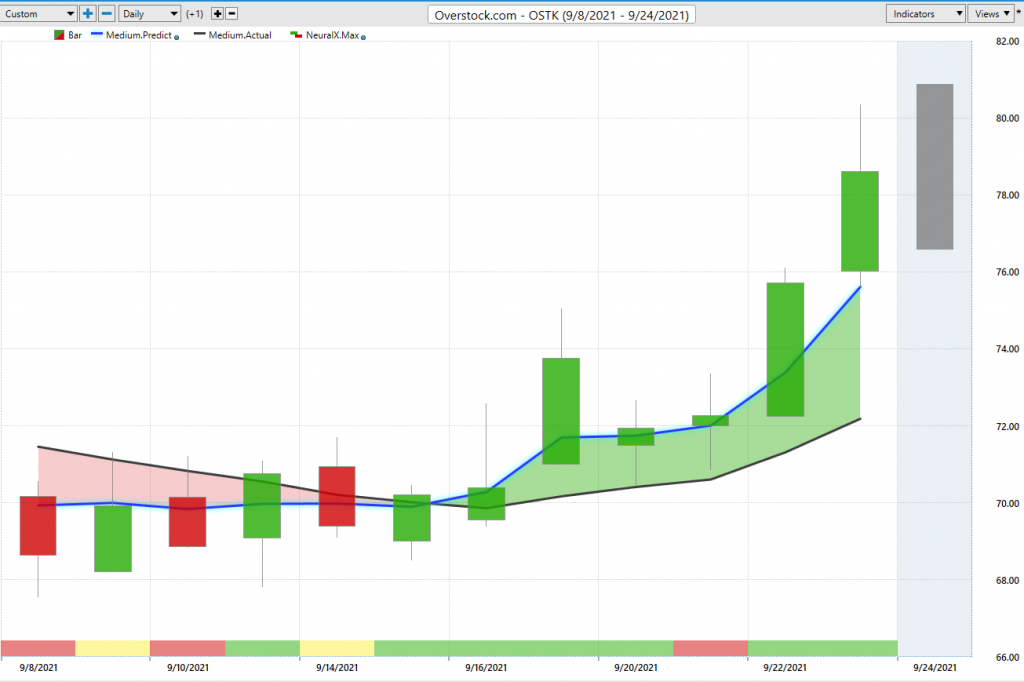
You see the extent of that blue line being well above the black line here. So even before as these markets were moving lower, it’s telling you, look, Overstock’s moving up. So you’ve got these areas of weakness, some areas that have stayed persistently strong, but a lot of these things you’ll see tie into what’s going on with that broader market and the S&P 500 because certainly your stocks are going to be affected by the volatility coming in there. But we’ve seen, again, things like oil move around, it affects oil stocks. Dollar moving around, affects broadly the stock market. And you want that roadmap that’s understanding those relationships and guiding you each and every day that says, “Hey, your game plan’s still intact. Your signals are still saying, ‘Go ahead.’ And you’ve got the levels to make some better trading decisions.” And that’s really the point. So once again, this has been our Hot Stocks Outlook for September 24th, 2021. Thank you all for watching. Best of luck, and bye for now.