


Register for a Free Live Training
The Hot Stocks Outlook uses VantagePoint’s market forecasts that are up to 87.4% accurate, demonstrating how traders can improve their timing and direction. In this week’s video, VantagePoint Software reviews forecasts for APPLE ($AAPL), Activision ($ATVI), NVIDIA($NVDA), Target ($TGT), Royal Caribbean Cruises ($RCL), and Norwegian Cruise Lines Holdings ($NCLH)
Hello again, traders, and welcome back to the Hot Stocks Outlook for September 16th, 2022. Hope you all are having a great week out there in the financial markets, and boy, do we have a lot to cover here in today’s Hot Stocks Outlook. We’re going to jump in. We’ll start out with shares of Apple really to highlight the bigger, broader themes have been going on throughout the broader marketplace. Then we’re going to move on, but this is really important to understand how these tools and this underlying technology can help you make better trading decisions.
So if you haven’t gotten a live demonstration, and learn more specifics of how this technology can help you as the trader make those better trading decisions week in and week out, make sure you click on that link in the description below, and get signed up. We’re going to start out again with shares of Apple. We’re going to move through a couple of the tech stocks to highlight that space. We’ve got Target and a couple of Cruise Line Stocks to really highlight what’s been going on there, and how a lot of these markets are correlated. We can really pull out these very important clues to help us as traders.
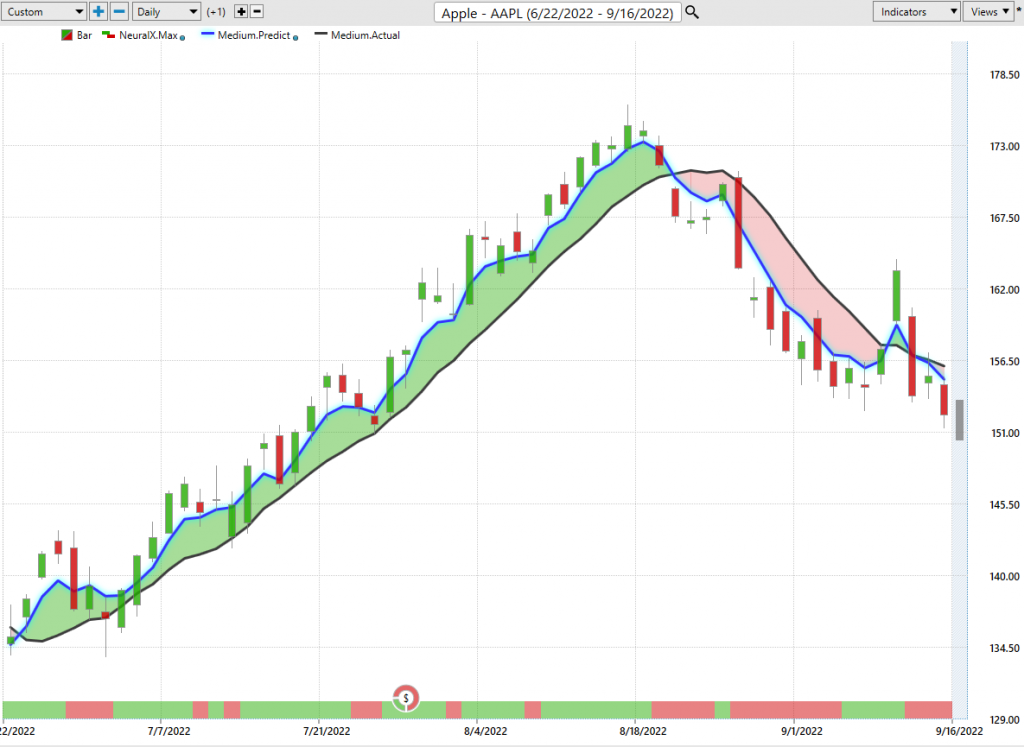
Starting out with shares of Apple, what we have is daily price action. We can see this is going all the way back to the end of June, really hiding this huge rally that we had in Apple. So just to get a highlight or a demonstration of how these tools work, what do they do? Well, what you have against all that daily price action is a black line and a blue line. Now, the black line that you’re seeing there is what we call a simple moving average, right? That’s a very common technical indicator. What it does in this case is it just looks at the past 10 closed prices. It’ll add those all together, and divide by 10.
So, it acts as a really good measure of where market prices have been over a given period of time, but traders want to be ahead of that next move, right? Get that position on as early as possible, so you can make as much money as possible. What we’re able to do is actually compare that black line or what you would call that lagging, simple moving average to this blue value. For that number to get calculated and plotted on the chart every single evening for traders, this is where the technology of artificial neural networks are coming in, performing what’s called intermarket analysis.
Now, what does that mean, intermarket analysis? Well, it means that rather than just looking at the past price of Apple, and trying to assume that those indicators will give you any predictive advantage, what this technology is doing is saying, “Okay, well, we know that there’s important market relationships that affect Apple.” Some of those can be pretty obvious, like the S&P and the Nasdaq. Some of those can be things like the dollar index or crude oil prices, which have been absolutely critical and having big effects on the broader stock market and of course the individual shares.
But within that, you’re going to have other individual tech stocks, so other individual stocks that share very important market relationships, and can offer some very helpful clues. We’ll take a look at a couple of these cruise lines together, but all of this gets factored in, and it produces a forecast, so a prediction of future prices that have not yet occurred. It’s actually that prediction of future prices generated via the technology, and it’s that data that’s used to generate these indicators.
So rather than having tools that look at the past, and really just get ripped and dragged around, this is a tool that’s going to be able to look forward, and make predicted decisions with an extremely high level of accuracy. So as it pertains to this blue line and black line, whenever that blue line is crossing above the black line, it’s suggesting average prices are going to start moving higher, and you therefore want to go ahead and get long. You can think of this as a prediction of future average prices if it’s landed up and above that black line while things are bullish.
This led to a very bullish period in stocks. If you go back and watch the Hot Stocks Outlooks, you’ll see me constantly coming in and talking about all the things that one might want to buy in a bullish period, especially within the tech space, Apple, and Nasdaq. But there was a very important shift that we could start to see really in the broader markets very early. So even before Apple started to turn, you could see that, “Hey, you may want to take some profits, look for lower levels, and then we can always get those lower levels, and actually reassess.”
The problem though is as those lower levels comes in, we got a lot more information that said, “Hey, there’s actually some weakness here, and it’s a very good opportunity to actually go ahead and take this 25 really plus percent rally here in the 42 trading days where Apple just advanced, and hedge your position. Go ahead and get short. Maybe even go ahead and short Apple. So when we combine all of these tools, we’re going to move forward now to this predictive neural index at the very bottom of the chart. It offers really a complete forecast so you can really identify these really big pivots.
When we have things like earnings reports, or in this case CPI, that offers a huge amount of volatility, there are some very important clues that you can use to navigate this very effectively. We get that shift to the downside, but let’s go ahead and move forward to the neural index, because this is very important as well. Now, that predictive moving average, it’s designed to predict future prices, and it’s using that underlying technology to do that. Well, at the very bottom of the chart, we have a very short-term forecasting tool. This is designed to solve a very short-term problem for the trader of strength or weakness over the next 48 hours.
So, you have that overall prediction of trend via the predicted moving average, and here with the predicted neural index, solving a different problem over the short term. You see that when you have that neural index bullish and the overall trend is up, it can help you with that short-term strength or weakness, right? You see the neural index gets bearish. There’s some weakness, but the overall strength is up. Neural index gets bearish. You run sideways, run sideways, but the overall strength is up.
What you get here is an indicator that over the course of all markets, bullish, bearish, earnings reports, CPI, this indicator gets things right with the accuracy of essentially 80% plus. right? Four out of five times, it can solve that problem correctly, but then we can take that and actually combine it with another predictive tool, these predictive highs and lows that are generated every evening forecasting for the next trading day. We look at this stuff every single week, and really, just what I want to bring through is that when you understand the markets are bullish, you have a very good guide to say, “Well, look for weaker prices. Look for these predicted low levels to be hit if you want to be a buyer.”
Within pretty much a couple of trading days, you’ve got that market advancing. Now, when the market pivots though, now we want to be looking to the short side. The market take profits on shorts. Now, this whole situation around CPI and this whole volatility catalyst, I want to show you how vantage point can help you navigate that, and hedge your portfolios. Really, regardless of what happens, you’re going to be able to make money. What I want to highlight too is the effectiveness of the software, right? There’s a vicious crossover here. I’m not going to gloss over that, but we know that that CPI and this technology isn’t going to count for fundamental events.
But look at Apple here as that crossover move to the downside, and you have a fresh move to the downside, neural index, bearish. Let’s look at that predicted high, that predicted high and low level, which is provided for the trader before each and every trading day. You see you move up, hit that predicted high, and then all that weakness comes into the market, and takes you to, well, where we are now. That’s really what I want to highlight is you always want to be in line with what’s going on in the market. That’s why when we look at these Hot Stocks Outlooks over these several weeks, you’re going to see bullish opportunities, trading the Nasdaq, looking at the markets in a very bullish way, but that’s really not what we’re seeing here.
Last week’s Hot Stocks Outlook, we brought in some stocks that were clearly still in down trend to highlight that point that not everything is perking higher. Last week, Thursday, Friday, we had really nice strong rallies in the market, but there are some problems, especially in the tech space.
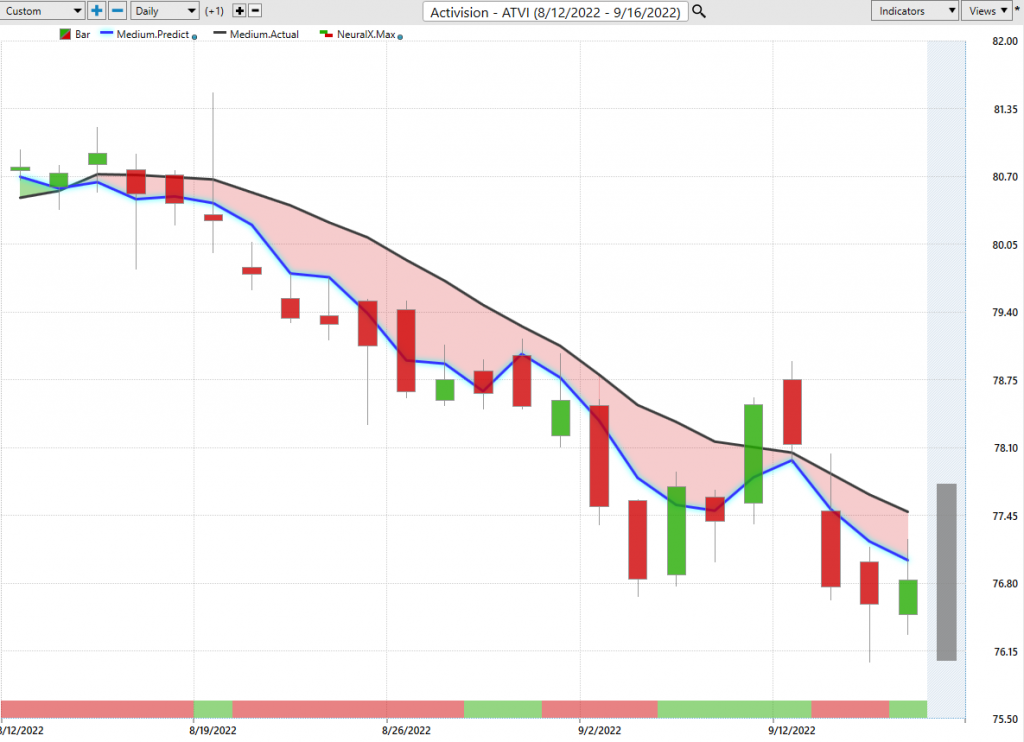
So here in Activision, we had that crossover blue line over black line, and again, specifically bringing this through because we don’t have that blue line crossing above the black line at all in this area. So, you get some volatility in the market perking up because of that strength coming in Thursday and Friday.
You actually see, “Look, you’re moving up to this predicted high, and some strengths coming in, but the bigger move is to the downside here.” You can see that, especially when you look at the broader markets here. Activision, this isn’t a huge mover, but it’s been very important to get a handle on where are things going here, and how much of the market actually even got to the bullish side here? Let’s take a look at Nvidia as well, so very important stock, right? Exact same forecast, exact same predictive indicators, blue line crossing the black line, neural index, bearish.
You get these little blips higher, where that’s some short-term strength over those subsequent 48-hour periods will come in. But are we getting that crossover blue line over black line?

Well, not only are we not getting that, but not even really close here in a very important market like Nvidia. This just keeps getting worse and worse, and it’s very indicative of the broader tech base of why you really don’t want to be net long here. You want to be net short taking profits on those shorts. When we start to see the whole market turn around, well, there will be good opportunities.
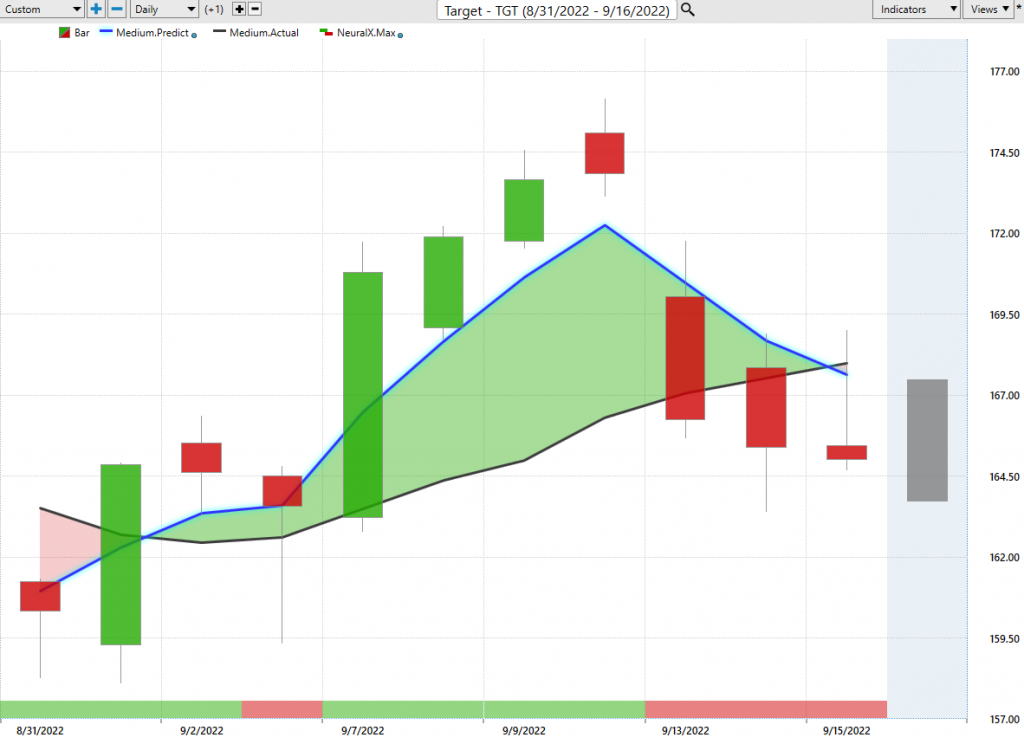
Target is one of these opportunities that we looked at over the past couple weeks, and it’s really for this point of when you have a tool that can get you really great entries in the market, you can even take on some of that volatility and some of that event risk, but really recognize that that broader shift is very bearish, and it’s not a great thing to really be long stocks right now. I mean, to put it quite bluntly, you might want to call it the not stocks outlook this week, because it’s a really rough time broadly, and it doesn’t feel like late June and July where everything’s going up.
There’s really good clues from the software. They’re just telling you, “Look, buy the market. Use these predicted highs and lows, and make some money.” You see that that CPI and just really how the markets were already structured around this has created some problems. You see that if you get a good entry, it takes a while for these markets to actually move to the downside. See, we get that move lower neural indexes bearish, and we are getting that crossover, but you see you’re actually still very close to the entry.
So, you can get out of the way, and understand that, “Look, this is very bearish, and there are some problems in the market.” You can just use these tools to navigate where specifically you’re taking on that risk. We also brought in Royal Caribbean. The point is we can use these tools to highlight where is the most strength? Where are these indicators skewing to the bullish side or skewing to the bearish side? That’s where you can then use the subsequent short-term neural index forecast and predicted highs and lows to manage that opportunity day to day, because those are very short-term forecasts.
Royal Caribbean Cruises ($RCL)
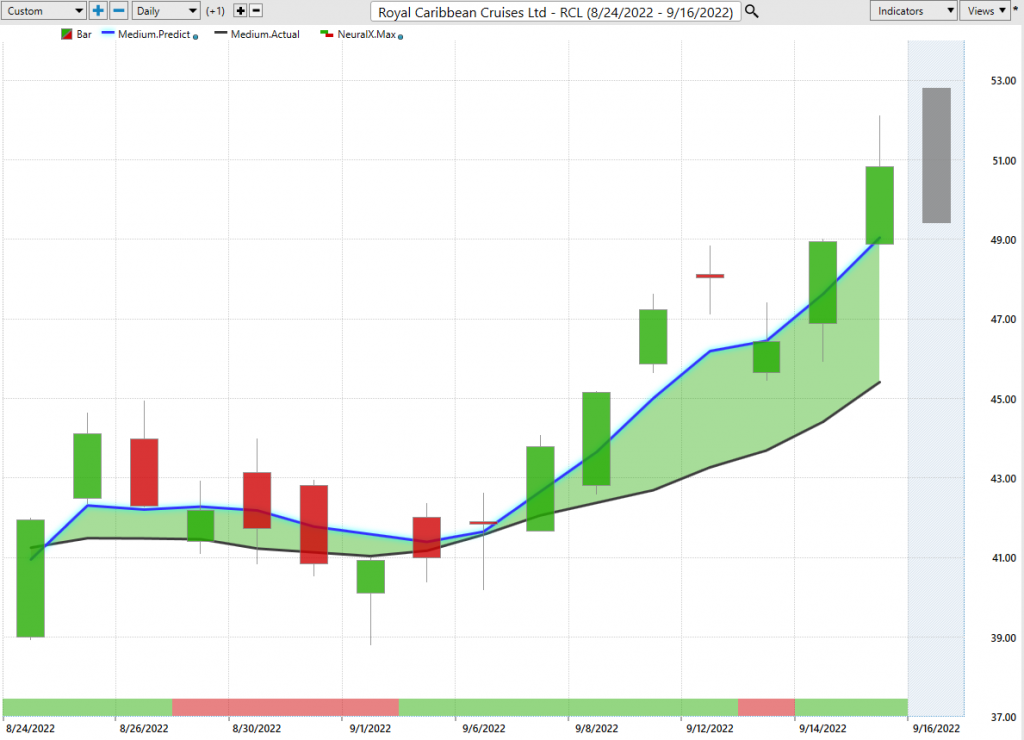
So here in Royal Caribbean, not a lot of places that have done extremely well in the market here, but these predicted high and low levels are really going to help traders make, again, those better trading decisions. Again, here, you see one of these gap updates. Next day, you’re moving to the predicted low, and this is moving high. That’s CPI actually just moving straight to these predictive levels and one of the more strong areas of the market, and actually seeing some strength over the past couple of trading days as you see, even things like crude oil and some of these markets weaken.
There are some very counterintuitive relationships here. We have about a 19.5% rally over the past 14 trading days. I mean, really, almost all of that just over the past week here in Royal Caribbean. Again, we can bring up tools like predicted highs and lows like we did here, and you can see that these tools are very helpful. It looks like we’re moving out of this area, but when you have these levels, oftentimes you’re just waiting that, “Well, all the price action was up today.” Well, you’re very likely to move to those predicted lows, and then the overall trend continue.
There’s Royal Caribbean.
Norwegian Cruise Lines Holdings ($NCLH)
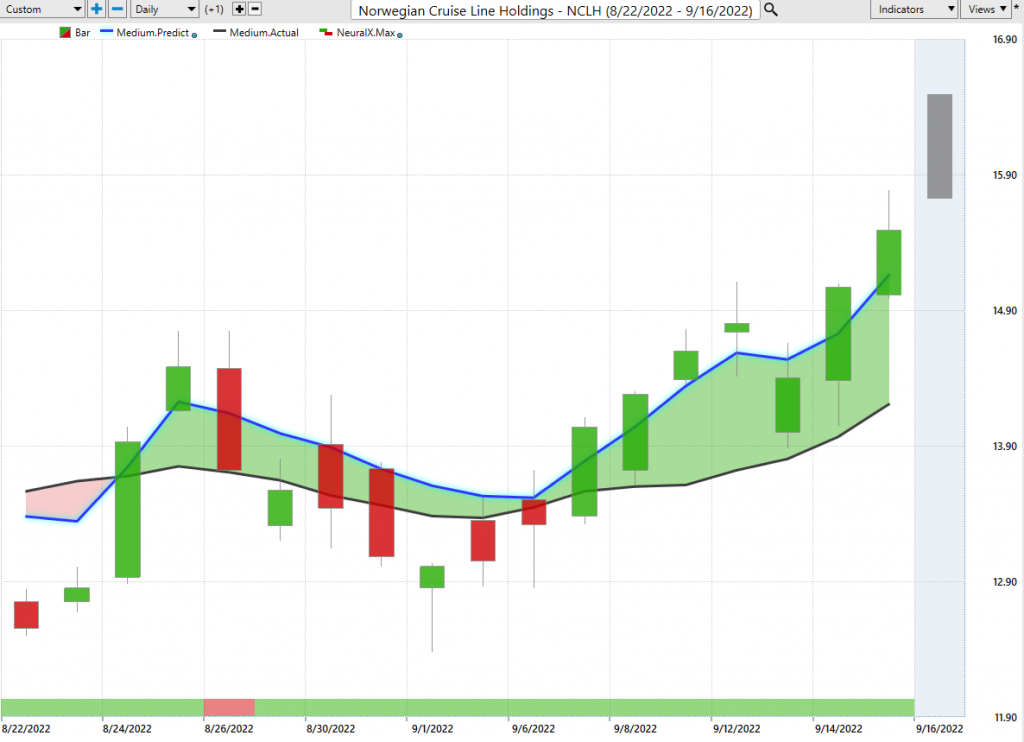
We can look at Norwegian cruise lines again, but if you’re running scans via the Intel scan feature, you actually see when these markets are pivoting, and then using the tools to manage the opportunity, right? Look at this neural index forecast here. So in a very bearish market, where dollar index has been shooting up, stock index has been shooting lower, here in Norwegian cruise lines, you’ve had a bullish crossover going all the way back to 8.24 one day, where the neural index is bearish, and you see that starts to that subsequent weakness. But very interestingly, that neural index stays bullish the whole way through.
I cannot think of one market outside of these cruise lines that has done really this well, but we have to just understand that there is some serious weakness going on here in the broader markets. That’s really the bigger point, to make sure you get that portfolio in line with what’s going on, and focus in on the opportunity. That opportunity opens up to the upside, but also opens up to the downside.
When you have the tools to understand where the probabilities lie, well, this is where you can set up that portfolio to make sure that you’re making money in the summer, and things like Apple or the Nasdaq, but really hedging those bets at that important inflection point that we identified not only in Apple, but the broader tech space. Again, you’ve got an excellent entry to get that bearish exposure on in the marketplace.
A little bit different of a Hot Stocks Outlook. I know we jumped around to a lot of different things, but this is the whole point is to have these predictive tools that are going to do what I would say is called skew in the direction that you want them to, right? These predictive indicators get more bearish. The neural index will stay more bearish. These predicted high and low forecasts will move lower, and they’ll detect where the aggressive strength or weakness is, so you can position that portfolio, and take advantage of those broader themes, weakness in tech, some strength here in some of the cruise lines, but broad base weakness in the market more generally.
We’ll go ahead and leave it there. Once again, this has been the Hot Stocks Outlook for September 16th, 2022. Thank you all for watching. Best of luck, and bye for now.

