


Register for a Free Live Training
The Hot Stocks Outlook uses VantagePoint’s market forecasts that are up to 87.4% accurate, demonstrating how traders can improve their timing and direction. In this week’s video, VantagePoint Software reviews forecasts for SPDR SPY($SPY), Amdocs ($DOX), Scott’s Miracle Gro($SMG), Salesforce ($CRM), Tesla ($TSLA), and Spotify ($SPOT)
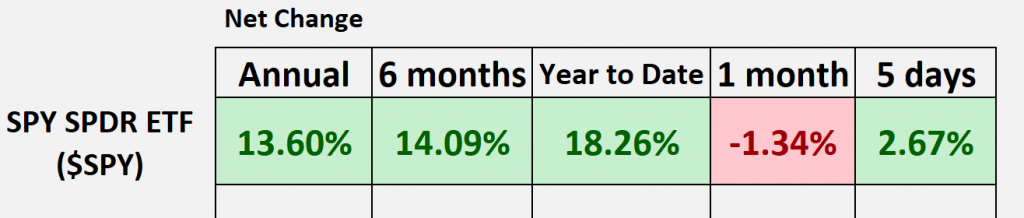
SPDR SPY ETF ($SPY)
Hello again, traders, and welcome back to the Hot Stocks Outlook for September 1st, 2023. I hope you all are having an excellent week out there in the financial markets. As always, we’ve got plenty of opportunities to look at today in our Outlook, but as we typically do, we’ll take a look at that SPY, that S&P 500 ETF. And if you haven’t already, make sure you go ahead and click on the link in the description below so you can get a live demonstration and learn a lot of the specifics about how these tools and technologies can really help you make better trading decisions each day in the marketplace.
So as we look back at the S&P, we can see that, going back a year, we’re up about 13 and a half percent year to date. This little perk up in the market has us up over 18% again, and what we want to highlight is this recent price action that we’ve seen. So we had a lot of weakness throughout August, and we are seeing some things shift around. So we want to be aware of that.
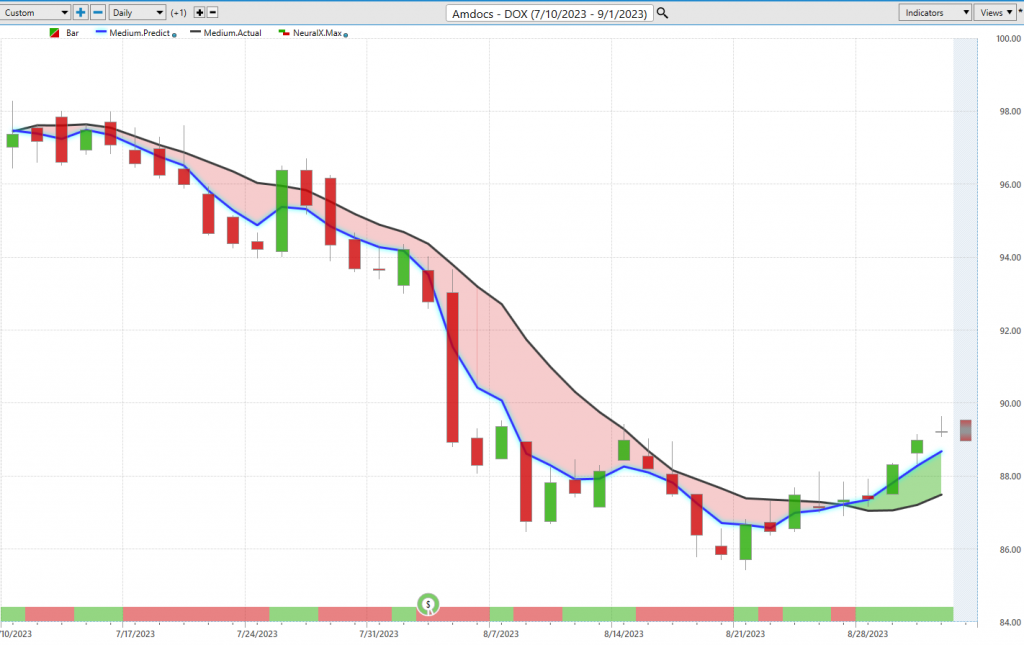
Let’s go ahead and go into the charts. And I thought it’d be really good to start out with this opportunity here in Amdocs. This was actually one of the markets that we highlighted, seeing a lot of weakness come into the market. We can see as August stayed very weak, certainly in this tech stock here in Amdocs, you had that persistence of weakness. But I want to update everything here, and also, you know, describe how all of these indicators work, right?
So what you have here on the chart is daily price action, right? So each one of these candles represents a full and complete trading day, and it’s right up against all that price data. What you’re going to see is there is a black line and a blue line value, right up against the price data. And what that is, is that black line value is actually a simple moving average. So that’s a very common technical indicator. And what it does, in this case, is it looks back over the previous 10 closes, adds those all together, and then divides by that number, so in this case, 10.
And so what that does is it smooths out the existing price action for the trader. But all of that data is coming from the past, so the problem with that is that indicators like that really just lag behind what’s already occurred in the marketplace.
And so what we want to do is compare that black, lagging moving average to this proprietary, predicted moving average. And for that number, essentially that price prediction to get plotted against the chart every evening for traders, well, this is where the technology of artificial neural networks come into play. And they’re performing what we would call inter-market analysis.
So when we think of the data sets used to generate, you know, predictive analytics, whether it’s any sort of generative AI or predictive AI, you need a lot of data to use, to generate the data, essentially the fuel to be used to generate the predictions. But you really want relevant data.
And so when we’re talking about what is inter-market analysis, well, it’s using markets that are known to drive and influence the future price of this target market. So very relevant data to the, you know, question at hand. And so it’s going to look at things like the SPY ETF, or maybe the NASDAQ Futures Market. But it’ll also look at things like individual stocks or individual ETF groups within the tech space that may share some very important correlations. And this goes all the way down to individual stocks as well as global commodities.
So, you know, I’d make the argument that the U.S. dollar index has been a huge factor in how we’re seeing the markets move, and the strength you’re seeing in just the general equity market. And so all of this stuff is critically important to understand when these big shifts are happening. It may affect the markets that you’re trading here.
So what it’s able to do is take all of this global information and use it to generate these highly accurate price predictions. And it’s those price predictions that are used to really construct these indicators. So rather than have, you know, rearward-looking tools that really just get dragged around, you know, what we have is a forward-looking, predictive tool.
So whenever this blue line, essentially a prediction of average prices in this case, crosses below the black line, well, it’s suggesting average prices are going to start going lower. And as a trader, you therefore would want to set up to, you know, short, take profits on shorts, and act accordingly.
And so we see, as long as that blue line remains below the black line, we see the market went down about 10.6% over the past 34 trading days, and especially got aggressive in that month of August. But the forecasts work the exact same way, whether it’s on the bearish side or the bullish side. And so, you know, last week, we made the Hot Stocks Outlook, things were looking still bearish. But that’s because this shift was coming in, right at the end of the week. So literally Friday afternoon, the dollar started to sell off, stocks started to shoot up, and you see how the software does a good job of picking up on all of this.
Going into this week, we see even shares of Amdocs, an area where we’d highlighted a lot of excessive weakness. Well, here we see that blue line crossing above the black line, and over the past four trading days, shares are up about 2%. So you know, even if you were on the short side, you recognize, “Hey, things are getting bullish. Go ahead, get out of the way,” or good opportunity to go ahead and get long, as we’ve seen in the short term, at least, seeing prices recover and do fairly well.
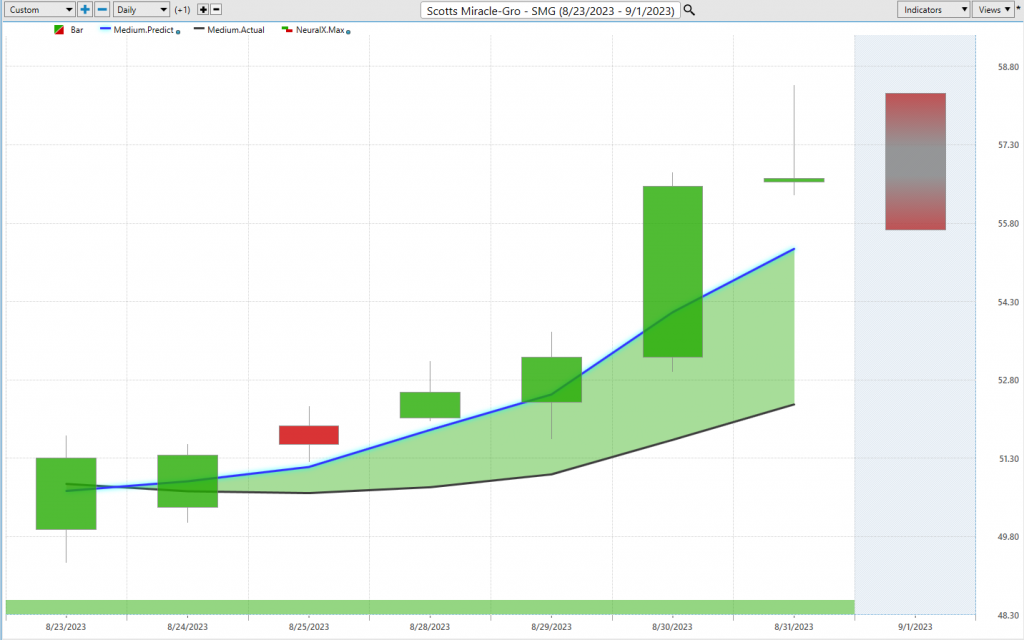
Here’s Scott’s Miracle Grow. So, a lot of the marijuana, and uh… you know, just the marijuana stocks have done really well here, right? So, um, Scott’s Miracle that really plays into that shares a lot of these correlations. Well, here you see, going back to the 24th, so this being Thursday going into Friday’s trading, you see that blue line clearly above the black line signaling that, look, the trend is up. You definitely don’t want to be on the short side here or if you want to balance out the portfolio, this might not be a bad place to go ahead and get long because the shares are up about nine percent in just the past five trading days here.
And so, what we also do is we take a look at this neural index at the bottom of the chart, and this is a highly accurate short-term indicator. It’s tuned to solve really short-term strength or weakness, really this problem of, ‘Hey, is there short-term strength or weakness over the next 48 hours?’ or you can think of it as two trading days. And so, especially where you see that blue line crossing above the black line, strength out of that neural index persisting, it can really help you manage the opportunity and make the most of it.
Lastly, in addition to a predicted moving average and neural index at the bottom, we have our predicted high and our predicted low ranges. So those are really intraday levels provided for traders and really provide, you know, limit orders and take profit points so traders can really fine-tune how they want to exploit this market opportunity. So you see here in Scott’s Miracle Grow, you get that crossover coming through. A couple of days where you don’t get down to these predicted lows, but you see that’s about one of the best entries you can get over this set of three days before we get this pop higher and shares moving higher there. So again, really nice move out of Scott’s Miracle. Really the whole sort of sector, as far as again, some of those marijuana companies are shooting up or shorts covering, or something’s going on there.
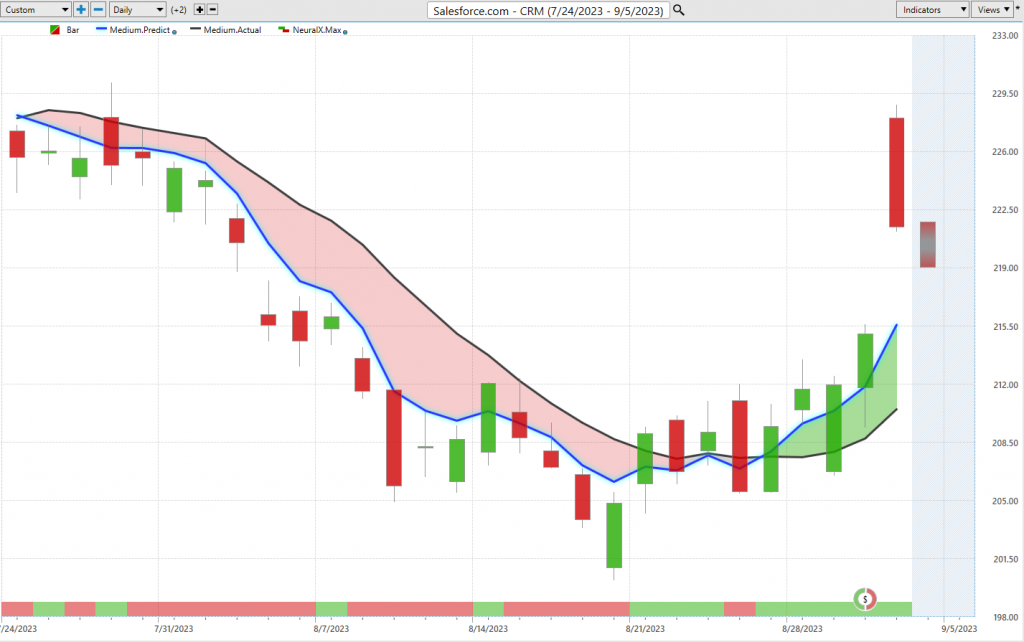
Here’s Salesforce, and this is just a good general example to highlight some of this broader market behavior that’s been going on. Here you see, going into August and highlighting a lot of this weakness coming into the NASDAQ and broadly through the tech space. We see how clearly the forecast is – blue line below the black line, neural index quite bearish over those, you know, moving forward, those 48-hour forecasts, and you get this huge movement lower in overall prices. So, we see that we’ve recently seen this crossover move to the upside, and this is really just what I want to highlight over this session – a lot of these shifts that we saw really towards the end of last week and going right into the beginning of this week. But you see, shares off about eight percent over the past 24 trading days through that month of August as that blue line remains below the black line and the forecasts are quite bearish. But here you see that blue line crosses above the black line, and so it’s very clear that, look, the trend is now the upside. Neural index remains bullish through the duration here, and we do have earnings. So a little catalyst to move things along here, but look how accurate these forecasts are. So even on a day like this, where you get a little bit of a gap down, it’s really gapping down just to this previous predicted low that wasn’t hit, and the trend is very much to the upside. So a really aggressive move there in shares of Salesforce. We can see here again just a little bit of a pop here, about six percent, just in the past five trading days, and again, after that, you know, almost a month and a half where the market declined about 10.
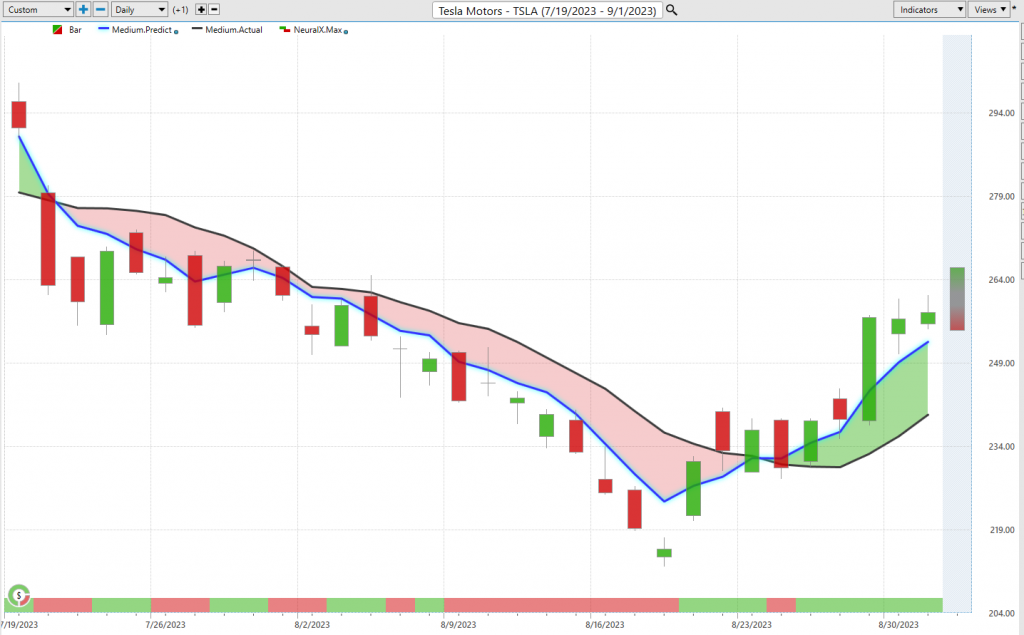
Right here, shares of Tesla. And this was a little bit of a tell of some of the strength coming in, especially on the tech side. So again, back to this weakness through the month of August, we even highlighted soon after that crossover came through that we are seeing a lot of weakness. You may want to get out of the way. But what have we seen more recently? We can go ahead and zoom in a little bit here. Here we see that blue line crossing above the black line, neural index gets bullish here, and you see that over the past, you know, really the entirety of the week here in shares of Tesla, you’ve had a really nice pop. And a lot of that is, again, you’ve had this bullish forecast here, that blue line clearly above the black line, neural index bullish here for the past five trading days, and shares up about 11 and a half percent again, just in those past five trading periods.
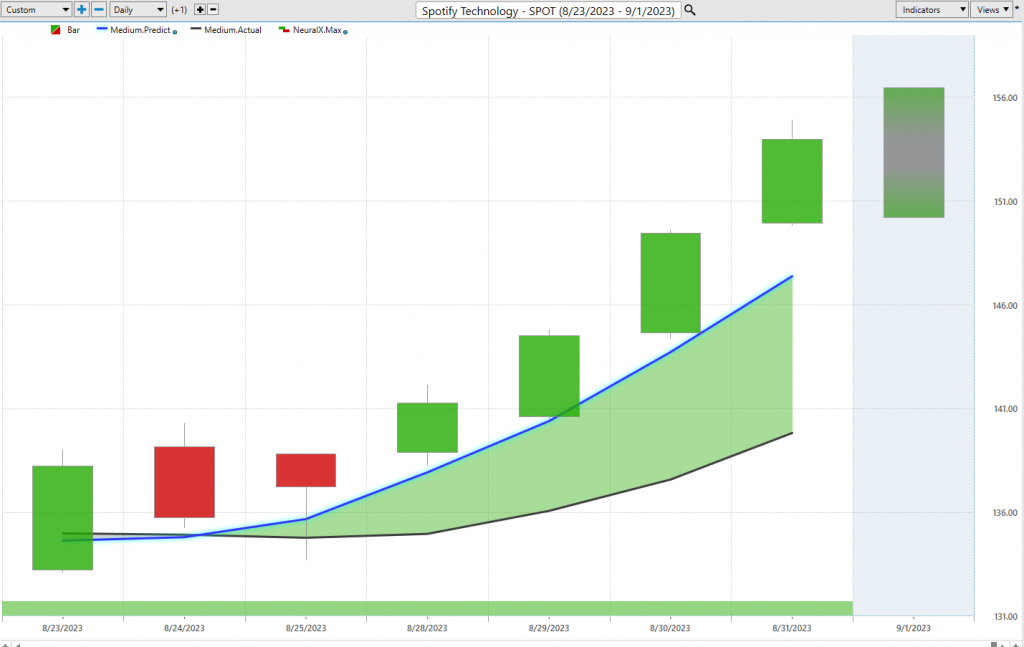
Lastly, here, shares of Spotify. So again, back to the tech space and seeing a lot of these fresh shifts and pivots in the market, and this is about as clean as it gets here, right? So if you’re looking at tech stocks, doing your analysis, running your intelliscan, that’s going to help you actually identify, you know, how much and where are these fresh crossovers coming through the market. Here you see shares of Spotify, you get that blue line crossing above the black line, neural index very, very bullish here, and we get a really nice rally here. And so, you know, if you’re on the short side, you really get those indications that say, ‘Look, go ahead and cover your position. Take those profits off of those, you know, declines that we had in August.’ But we are seeing a lot of these predictive moving averages move above the black line, and subsequently, we get some very aggressive rallies in the price action shortly thereafter. So again, some really exciting opportunities opening up, some really important shifts. This is why it’s really helpful to have this sort of information every single day. So really, as we get those, uh, you know, really forecasts coming through at the end of Friday right? So you know, coming through Thursday and Friday and going into the beginning of the week, really highlighting that, ‘Hey, there’s actually some strength here, and some important shifts going on in the marketplace.’ And you really might want to go ahead and get ahead of that or balance out the portfolio, or, you know, get yourself positioned to make some profit here. So again, a really nice move here, about 11 out of Miracle Grow. Again, just 500 shares, about a 3,000 move just this past week. So, once again, this has been our hot stocks outlook for September 1st, 2023. Thank you all for watching. Best of luck out there, and bye.”


