Register for a Free Live Training
The Hot Stocks Outlook uses VantagePoint’s market forecasts that are up to 87.4% accurate, demonstrating how traders can improve their timing and direction. In this week’s video, VantagePoint Software reviews forecasts for NVIDIA ($NVDA), AMD ($AMD). Chewy ($CHWY), Home Depot($HD) and Tesla ($TSLA)
Hello again traders, and welcome back to the Hot Stocks Outlook for October 29th, 2021. Hope y’all are having a excellent week out there in the financial markets, and as always, plenty to cover here in today’s outlook. We’ll start out with shares of Nvidia and AMD, so a really good example of what’s going on in semiconductors, but broadly speaking the markets, a really good example of how we we’ve seen the markets turn higher. We’ll look at Chewy, Home Depot, and lastly, take a look at shares of Tesla.
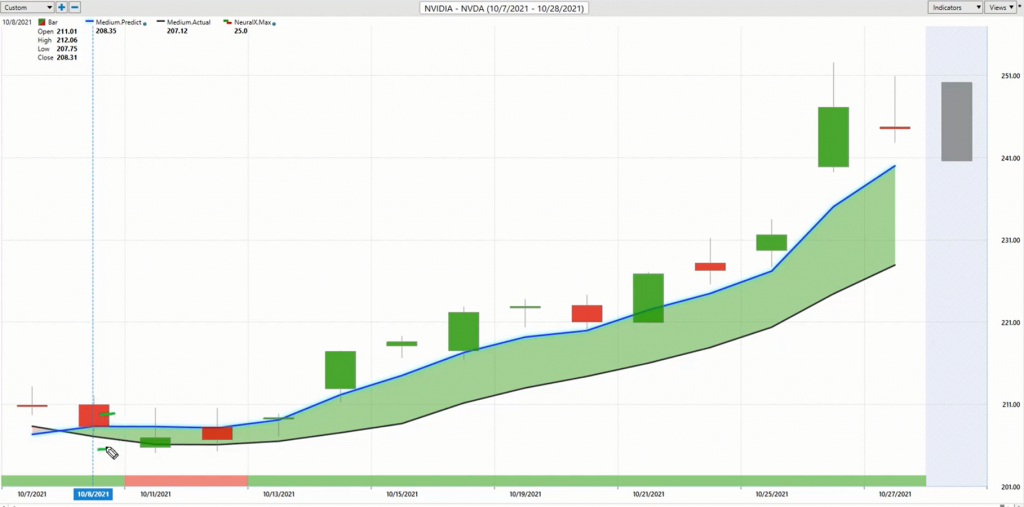
So what we have here with shares of Nvidia, we can see daily price action, going back really to the midpoint here in October, and what you have right up against those daily bars and candles is a black line and a blue line. Now, this is very important to understand that that black value that you’re seeing against the chart, that is actually a simple moving average, or what we refer to as the actual simple moving average, and all that’s really happening there is that it’s looking back at the previous 10 close prices in this case, adding those all together and dividing by 10.
And simple moving averages are really good at smoothing out the existing price data and letting you know where a given market has been over a given period of time, but obviously a trader needs to know ahead of time, where’s the market likely to go next? So what we’re able to do is actually make a comparison of that black, what we’ll call a lagging moving average, to this blue value that gets generated each and every trading evening, before the next trading day. So what is happening and how that blue value is generated is VantagePoint is utilizing its technology of artificial neural networks, a type of artificial intelligence, to perform what’s called intermarket analysis. So this is the huge amounts of data that artificial neural networks are good at analyzing. So it’s looking at all of these market relationships that are happening, not just within, Nvidia and the S&P, but a lot more subtle relationships, like the other indices, like the NASDAQ, individual stocks, global currencies, interest rates, global commodities and futures markets. And what it’s able to do is understand those relationships, whether they be leading, lagging, inverse correlations of positive relationships.
And what it’s able to do is actually use that information to generate a true price prediction. And it’s that price prediction, generated via the technology, that is used, and those values are used to generate and construct things like the predicted moving average here that you see against this lagging moving average. So whenever you have that blue line crawl above the black line, it’s suggesting average prices are expected to move higher and you therefore would want to take a long position. Now at the very bottom of the chart, you’ll see that there’s a bar here, and this in a very yes, no, binary way is going to be green or red, and this is also derived via that technology of artificial neural networks, but it’s tuned to only look ahead 48 hours at a time. So it’s very short term strength or weakness just over the next 48 hours of trading.
And what you’ll see is situations like this, where you see after the trading day here, the neural index goes bearish. And while the overall trend is up, the blue line’s still very much above the black line, you tend to get some lower lows over the next couple of trading days. And how I like to look at this is you’re likely going to trade below that predicted moving average, whatever that value is going into the trading day. Now you see once that neural index gets bullish, things start moving higher, but that’s not the end of the entirety of the forecast here, as you’re actually provided every trading day predicted high and predicted low. So intraday levels, not the overall trend, not 48 hours. Now we’re down to intraday what price should you be willing to potentially accept for whatever trade you’re taking?
So you can see here that this happened in a lot of places throughout the market.
We’re going to take a look at AMD and these other stocks, but this is what we’ve been highlighting over the past couple weeks in these hot stocks outlooks is that things were moving lower and they’ve shifted. So you see how when you have tools like this, not only are you potentially setting a limit order right there, but you’re actually going to be getting filled at the open, almost at the bottom of the market. And every single trading day, you have an updated forecast to guide you on how you might want to make trading decisions in that market, but keeping it very simple and in line with the predictive indicators to help guide you and execute that trading style and timeframe that you like to trade in.
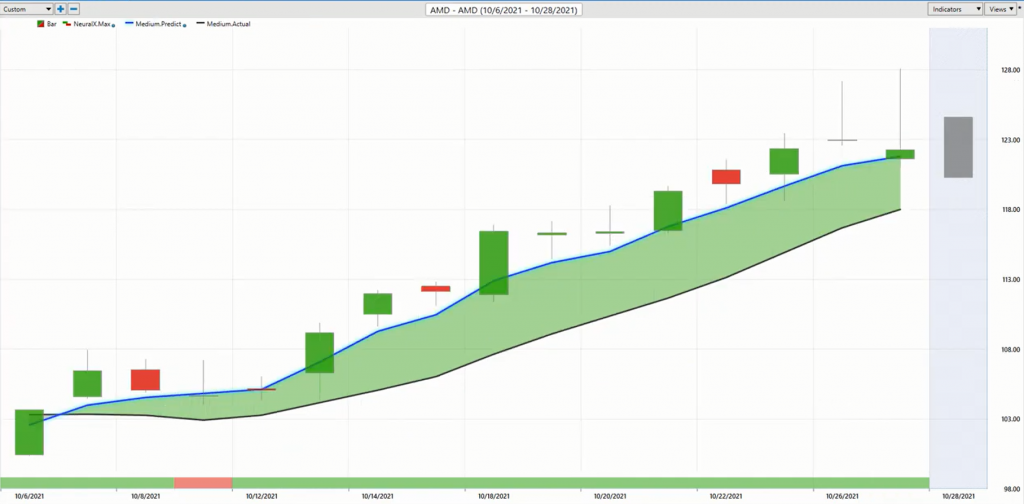
So here we have shares of Nvidia here, and we can see that this is already up about 19% in just the past 13 trading days. But if you’ve been paying much attention to the broader markets, this is not just Nvidia here. So many markets shifted after that sell off in stocks, and VantagePoint here has done a fantastic job of highlighting areas where you can now take advantage of that strength that’s been coming through the markets. So here you have AMD in a very similar way. Well, we’ll what you’re able to do with VantagePoint is actually run scans that actually scan for these predictive indicators. And really the beauty of that is that it’s going to alert you right when those crossovers and signals occur from these predictive indicators. So you start saying, “Hey, Nvidia, seeing a crossover to the bullish side from those predicted moving average. AMD also. Well, maybe I should take a look at these semiconductor stocks and really be prepared to trade them with these forecasts.”
But the thing is, when you get that forecast on the 8th of October, you don’t know what these subsequent predicted lows are going to be maybe a week, two weeks later, but you can see how effective they are at guiding you during the course of that trade. And this is really what it comes down to is the overall trade management, how you’re able to improve your overall position, take profits along the way, and really minimize the risk, but open yourself up to some of these tremendous rallies that we’re seeing, especially on the side of stocks.
Now here’s shares of Chewy, and this has come through a little bit more recently, but exact same approach of blue line crossing the black line here are on the 18th, and the neural index remaining bullish every single day from that point forward. Now, in addition to that, you get these predicted lows and we can see exactly what those predicted lows were before the trading day.
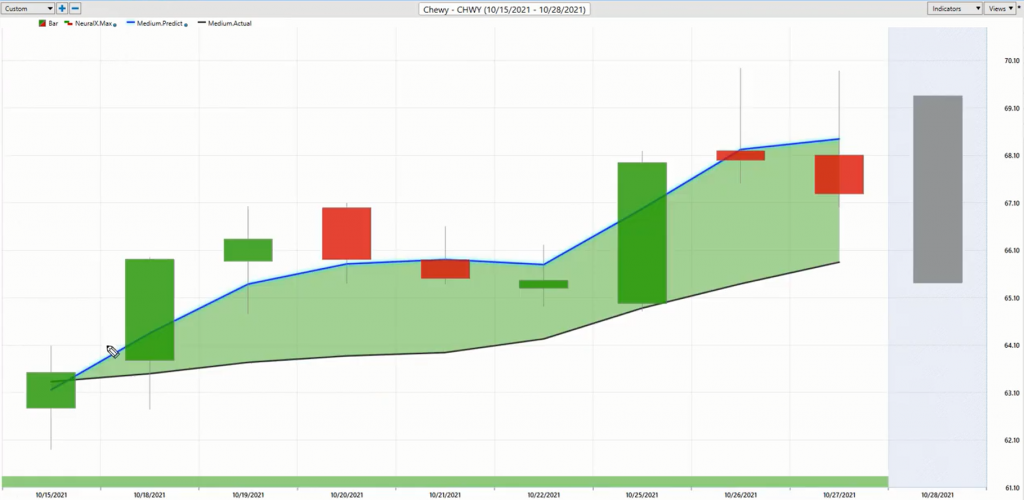
Now this had a huge spike, and I know this because I’ve been watching this stock and we’ve had this crossover moving higher, but you’ve had these tools that have said, “All right, look to start taking positions after this trading day, but potentially add to those positions as things move forward.” And you see how effective this is of… We don’t get down to these predicted lows, well, maybe you actually don’t want to be accepting prices there, because sure enough, on this day, you’re certainly getting those predicted lows hit and the market continuing higher.
But we’re just seeing a lot of strength in a lot of different areas of the market, and of course, it’s very helpful to have a tool like VantagePoint which is going to help you get ahead of these things and really recognize where is this strength coming through the market? I don’t know how much this is up, but it certainly popped quite a bit today. But this had come through back on the 18th, along with a lot of stocks that have certainly shown that, look, the trend is up and the equity indices are certainly moving higher in agreement with that.
So here’s shares of Home Depot, very similar forecast. We see all this strength coming through. Really, this is that pivot where stocks, so often things move higher here in October, but very clearly a lot of strength in many of these very big, large, popular names here. So very clearly we can look at these predicted highs and lows, and again, get that guidance that when you have an end of day trading tool, you’re going to come in before this trading date even occur, and if this is a market you’re interested in, you’re setting a limit order down at the predicted low. Would make some basic logical sense, right? We expect the market to trade at that level.
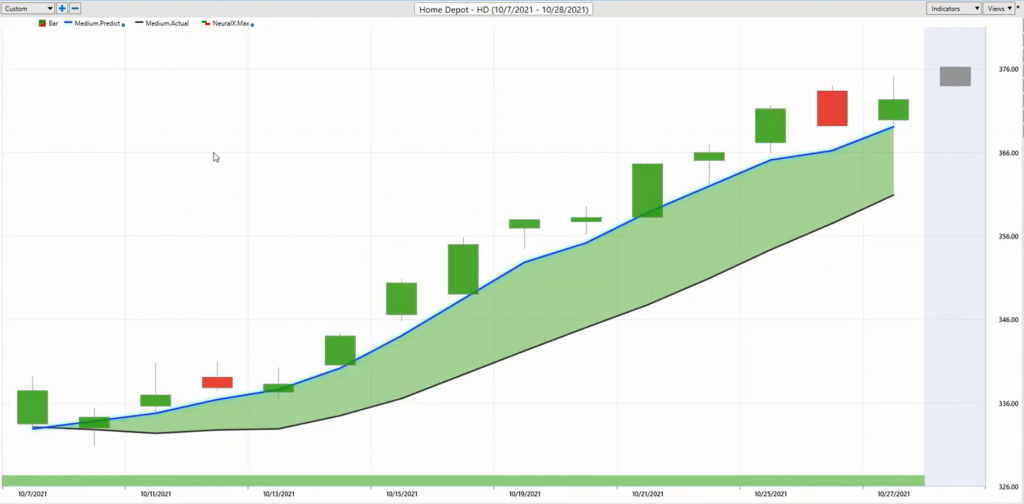
And same thing, it gets a little gappy and weird sometimes, but sure enough, that’s where you want to be buying. This is the trading day where you want to be prepared for this market shift. And you see how subsequent trading days, you may get down there and hit those predicted lows, and those are great levels to add to your position or take profits on the upside. So shares of Home Depot here doing quite well, but many of these charts look very similar, and this really gets to the heart of what VantagePoint does in a very effective way of highlighting that, “Hey, if the S&P’s going to start moving higher, that plays into all of these important market relationships, and it’s going to play into the accuracy of these forecasts to let you know that there’s been a very important market shift that occurred here, and at least over the past couple weeks, the appropriate play has been get long, take long positions and use these management tools from VantagePoint.
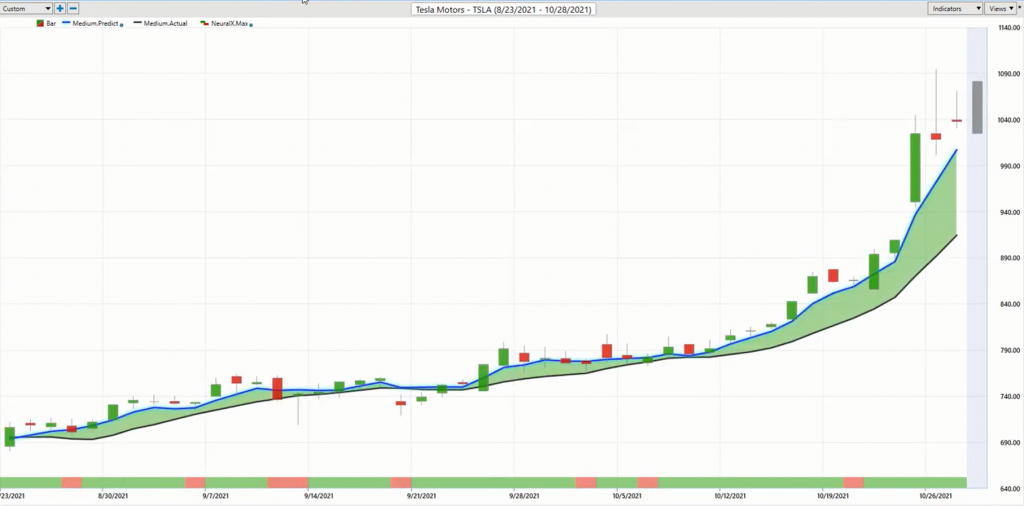
Now here’s Tesla, much longer sort of situation, but you see, as the S&P improves and markets do well, well, the markets that we’re already doing well do extremely well, and this really starts to expand to the upside, but this crossover to the upside, as far as the last blue line crossing the black line is all the way back here on August 24th. And subsequently you’ve have pretty much stayed in that up trend and had VantagePoint predicted lows here to help guide you on where you might want to come in and be a buyer. There’s a little gap down here, but every single trading day, getting some pretty good queues here on how to manage that opportunity, and very clearly only get long, take profits on long positions, and that has clearly been a very nice trade in the market recently.
So we can highlight this, just this last opportunity here. Shares up about 47.67%. I haven’t seen how much up or down this is up today. Obviously a lot of volatility potentially in shares of something like that, that move so much, but this is the key is just recognizing these market shifts that are happening and really understanding where is the best place that’s going to benefit from that individual stock, the overall sector doing well, and then just the broader markets doing well, and generally when the S&P and the NASDAQ are moving up, it’s going to raise all boats and you can really find those quality spots to take positions and manage them with the help of these predictive tools from VantagePoint. So once again, this has been our Hot Stocks Outlook for October 29th, 2021. Thank you all for watching. Best of luck out there, and bye for now.
Hello, again, traders and welcome back to the Hot Stocks Outlook for October 29th, 2021. Hope you all are having a great week out in the financial markets. And as always, plenty to cover in today’s outlook.