Register for a Free Live Training
The Hot Stocks Outlook uses VantagePoint’s market forecasts that are up to 87.4% accurate, demonstrating how traders can improve their timing and direction. In this week’s video, VantagePoint Software reviews forecasts for NASDAQ INDEX , Cubesmart ($CUBE), Facebook ($FB), Light Sweet Crude Oil ($CL), Laredo Petroleum ($LPI), SM Energy ($SM), Southwest Airlines ($LUV)
Hello, again traders and welcome back to the Hot Stocks Outlook for October 1st, 2021. I hope you all are having an excellent week out there in the financial markets and as always a lot to cover here in today’s outlook. So we’ll do things a little bit differently. We’re going to start out here with the NASDAQ futures and take a look at Facebook shares and in the same theme of looking at some of these Intermarket relationships and highlighting what this offer is able to do for traders, we could look at light sweet crude oil, some of these energy stocks we’ve highlighted over the past few weeks. We’ll also take a look at Southwest Airlines and just airlines generally doing fairly well recently here. And lastly, CubeSmart. Just an example we’ve looked at last week, I believe and can update those forecasts and see how these short-term tools are working to help guide traders moving forward.
But the big thing here is let’s take a look at the NASDAQ, and what we have here is the futures contract, and you can see daily price action right up against those bars and [kindles 00:00:56]. And just like in all our previous video and content, all this is about saying, okay, well against that daily price action here on the NASDAQ index, we have a black line there and also a blue line. Now, that black line that you’re seeing there, that is a simple moving average. So it’s a very common technical indicator, we’re just going to look back over the previous 10 close prices, in this case, we’ll divide it by 10. And it does a great thing as far as smoothing out the existing price action and letting us know, hey, where’s market price been over this given period? But obviously traders, we need to be ahead of the move and understand where is market price likely to move going forward so we can be in front of those movements.
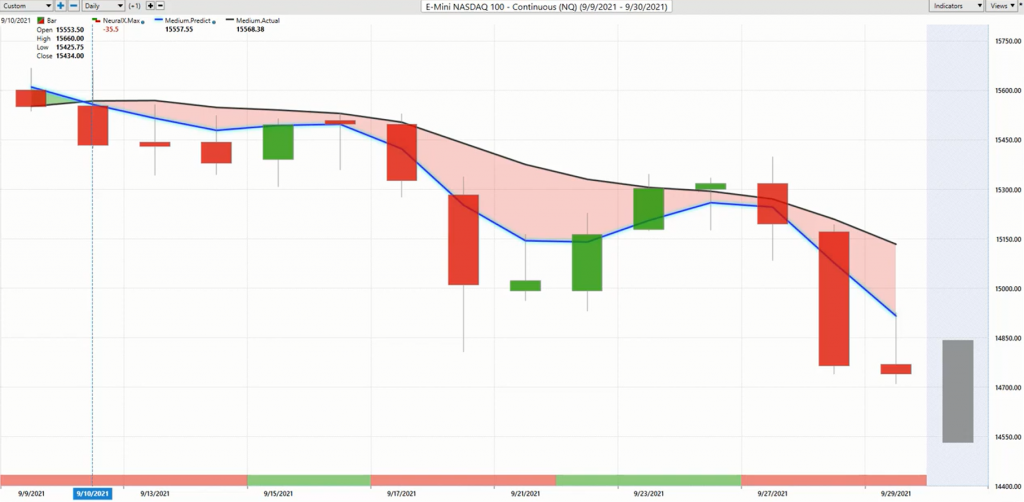
And so what we’re able to do is compare these values as far as that black, what we’d call the lagging simple moving average, and compare that to this blue predicted moving average. Now for that number for the really predicted average prices to get plotted against the chart, the vantage point is utilizing its tool of artificial neural networks or artificial intelligence to do what’s called Intermarket Analysis. And that’s very important because we know obvious things like the NASDAQ shares relationships with the S&P 500 and the Dow Jones Industrial Average, but there are very important relationships that are taking place within currencies, within the bond market, and interest rates, within individual ETFs, and individual stocks even. So this is why it’s very important to have a tool that’s able to understand those market relationships, account for them, and really extract this extremely valuable information out of this inner market data.
But what happens is it’s taking all of that information and actually using it to generate future price predictions. So rather than your indicators just being based of on rearranging price from the past, this is a forward-looking tool that’s using that technology, not only to create what we call this predicted moving average that gives us the overall trend direction, but these other predictive tools. So if we look at the bottom of the chart, you’ll see you have this bar that can go from green back to red, and every day that gets updated. But this neural network or this part of the technology is tuned to only look ahead 48 hours. So it’s just looking ahead two trading days strength or weakness, and is giving you again, that short-term strength and weakness within an existing trend. In addition to that, you’ll notice you have a predicted high and what we call the predicted low.
And these are provided before each and every trading day occurs. And the key is that we can look at this and say, okay, the blue line crosses the black line and we’ve got this move. And that’s how many trades may play out, but where things get a lot more nuance is having these daily predicted high and low levels so that if you’re trading the NASDAQ futures, well, clearly these are the levels that really stand out as far as they shift in the market and a new opportunity to look to short, you see these predicted highs as well, doing a great job as this market progresses moving forward. You see your neural index, you get short-term strength coming in subsequently, again, short term strength, but the overall trend to the downside and this type of stuff is extremely helpful for traders who might be trading tech stocks, and need to understand that, hey, you’re really pushing your luck if the NASDAQ is up at these highs, and you’re still long many of those tech stocks, and it certainly is going to weigh across equities just generally, we’ve seen the S&P, the Dell pull back.
And this is what we mean by these Intermarket relationships, that this is certainly going to affect all of those stock trades that you’re taking. And we’ve seen it just ripple through the marketplace. And this is why we really want to pick those spots as far as where to take longs and where to take shorts and recognize which sectors we can focus on. So when we move over and say, okay, well, how are Facebook shares looking? Well, at the exact same time that you’re seeing the NASDAQ roll over it’s telling you, look, you’re seeing this broadly. It’s not like you’re just seeing a one-off here. And this is where tools like Vantage Point and Telescan are extremely helpful to really help traders see these shifts as they happen and be well ahead of them.
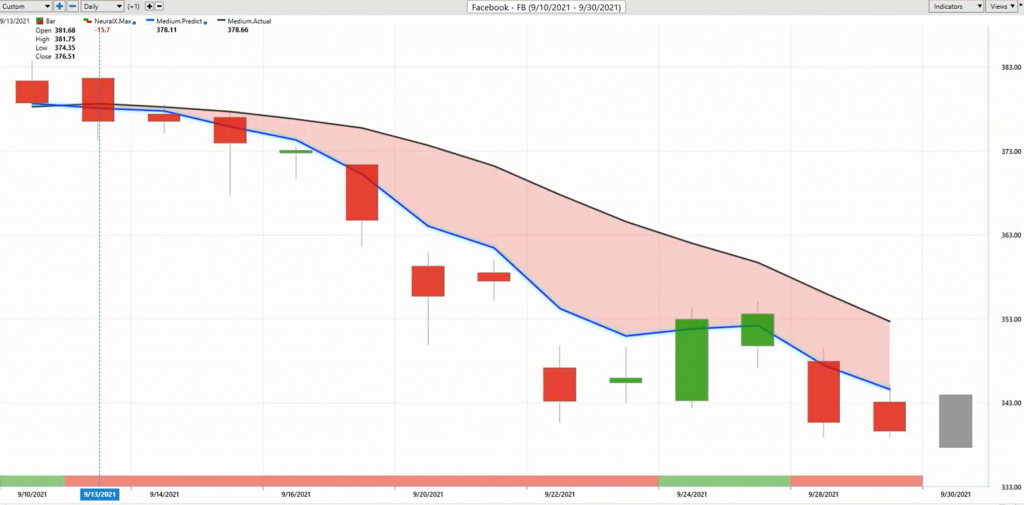
So we see here in shares of Facebook, a very similar forecast, but then we can look at the nuances of, look, this isn’t the NASDAQ, right? This isn’t another tech stock, this is Facebook. And we have these individual levels that are derived via those neural network processes that are going to help you manage this market in particular. But you can always get that context as far as, hey, do you want to be buying tech stocks? Well, certainly not in an environment where your forecast is as straightforward as it can get telling you to look, this market is moving to the downside, you’d only want to short and take profits on shorts and that has certainly been the appropriate move. And we are seeing a lot of volatility in shares and the equity market. We’re seeing volatility in commodities. It’s certainly a time to recognize what’s going on.
And if this is hitting you by surprise, this is the whole point of having these tools, it really gets you ahead of some of these bigger shifts in the marketplace. So shares are off about 10% there, but let’s move forward and go through something that we covered several weeks ago.
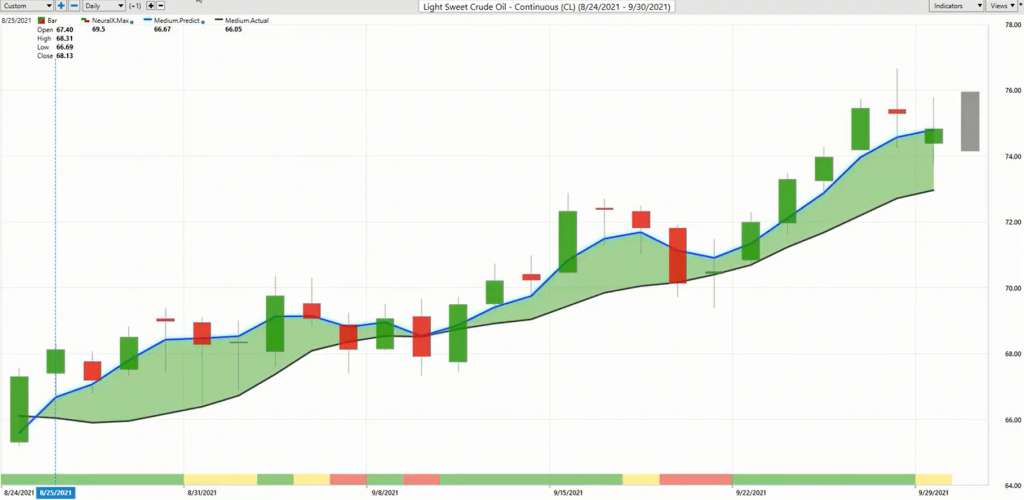
And this gets to the heart of this light sweet crude oil. So we talked about shares of Callon Petroleum and all of these stocks starting to turn higher, that what was previously in a downtrend as far as energies had been really chunking and lower tons of volatility around the crude oil market and energy stocks, well, that all reversed, and there was a new opportunity to potentially start taking long positions. Callon Petroleum is up over 50% from where that video was made around the beginning of September. So it’s very significant to understand these shifts like what’s going on with crude oil over this period and what recently has happened with NASDAQ and tech shares and how you’d be trading those if you’re managing those markets at all.
So you see here, you get these predicted lows early on, some volatility hits up, but you only want to be long taking profits on longs here quite clearly. And so what does this affect? Well, it’s going to affect energy stocks. So if you’re a stock trader and you’re looking and trying to figure out, well, where’s the best place to be over this time period? Well, when oil starts clicking up, that is affecting those Intermarket relationships. And it’s cluing into these indicators to let you know that, hey, this predicted moving average is going to start creating that separation so you know that you’re in an uptrend but the neural index, for the most part, is accurate upwards of 80 plus percent of the time. Well, it’s going to remain bullish when you’re likely got all those factors in agreement and that’s where you see the market really start to accelerate as far as a trend.
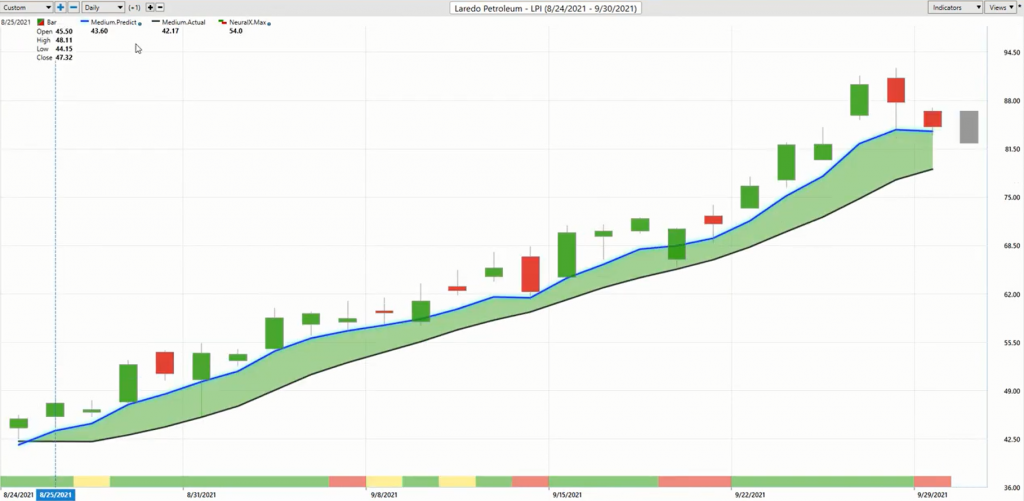
But it’s the combination of all of these things letting you know that there’s something going on in this area of the market. And while this market moves up 85% over the last 25 trading days, I of course, want that guidance that says, okay, well, how can I use these short-term daily levels to manage this over this huge window? And you see that, okay, well, you’re only going to be takings longs, profits on longs, and you’re not always going to hit that predicted low every single day. I mean, in this case, you see a lot of volatility get filled with the open if you’re buying there. But as far as managing a position, taking profit up at predicted highs, however you want to approach it but clearly the trend very much to the upside, the forecast being very bullish here, not just potentially among the market that you’re trading Laredo Petroleum or wherever it might be, maybe it’s a bigger company like Hess or wherever. But some of these other markets.
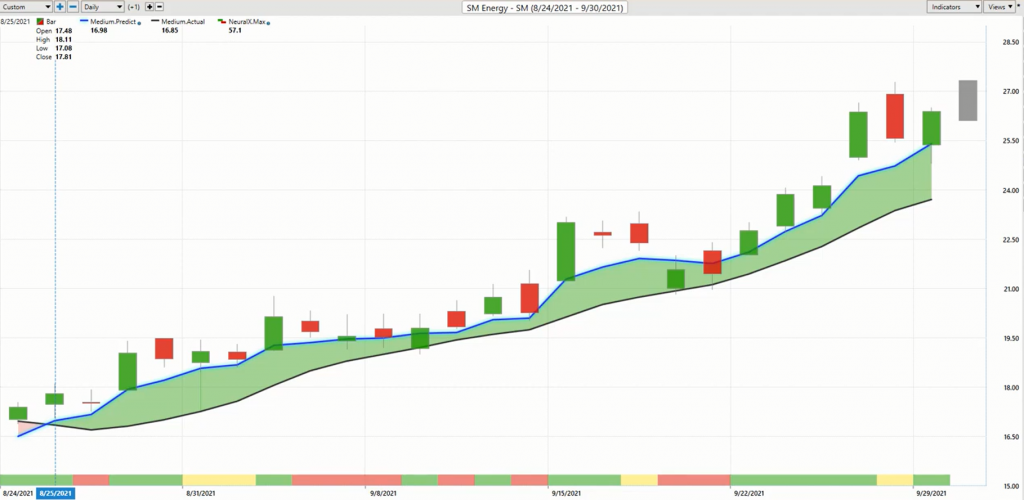
So you can see that look, energies, the commodity is strong. The stocks are strong. You’re getting this separation between the moving averages and regardless of which stock you may want to trade or where you want to get exposure to that, you’ve got a very good roadmap for that particular market to let you know that look, if you want to be a buyer, you can have these limit orders waiting in the market. But knowing that there are clearly places that you do not want to be long, right? You’d want to be shorting the market and clearly, places where there’s at least an easier road here if you want to take long positions throughout equities. Now, outside of those obvious broad sectors of the marketplace, there are other things happening. And we’ve seen pick-ups in a lot of the airline companies, seeing a lot of crossovers here mid-month, but it really gets back to who knows where this might go.
You see here a predicted trading range moving down here quite a bit. But the point is that if you’re trading it at all, where you’re recognizing this very early on, and that’s where the predicted moving averages are there to give you those signals as early as possible, and then have these tools that are updating every single trading day to let you know what to expect based on how you’re trading, what your strategy is. Well, you may adjust that position and adjust your expectations for where that market’s expected to move. But here we have again about a 7% rally there.

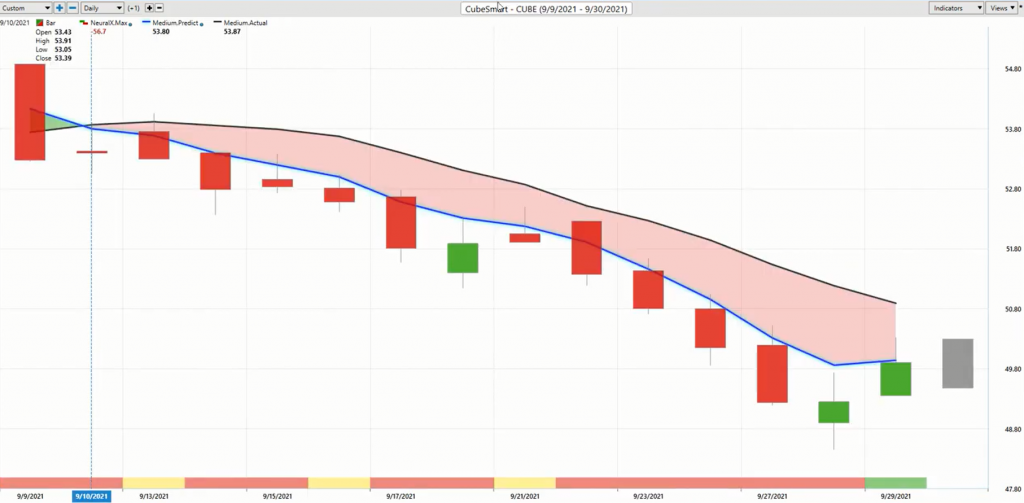
And lastly, we’ll just come over to CubeSmart. So you see the weakness in the NASDAQ, you see weakness, it makes sense to use the vantage point to get some exposure to that. But, of course, you want that guidance that says, okay, well, how should I manage that? Should I remain short? Should I keep expressing that trade idea?
And so typically when these crossovers come through, vantage point gets you in really early and you can get some nice entries and you should expect volatility to really increase the further and further you get from that market reversing trend. But this is where things are really effective, where you see that you really get into this big downtrend. You’re seeing things pick up, but this is not a market where you want to be long and we have these clear signals of areas where this is just not the place to be taking positions, things like Facebook, the NASDAQ, CubeSmart, there are some real issues and if that shifts as we saw with crude oil that led to this big move, well, then the portfolio shifts, the trader behavior shifts. And you work that into your approach to the markets and your timeframes, and what you’re doing to express your strategies on the marketplace. So I’ll leave it there. Once again, this has been an honor. Hot Stocks Outlook for October 1st, 2021. Thank you all for watching, the best of luck out there. Thanks again. And bye for now.