Register for a Free Live Training
The Hot Stocks Outlook uses VantagePoint’s market forecasts that are up to 87.4% accurate, demonstrating how traders can improve their timing and direction. In this week’s video, VantagePoint Software reviews forecasts for American Express($AXP), Microsoft ($MSFT), Pfizer ($PFE), Gilead Sciences ($GILD), and Franklin Resources ($BEN).
Hello again, traders and welcome back to the Hot Stocks Outlook for May 27th, 2022. I hope y’all are having a great week out there in the financial markets. And as always, plenty to cover here in today’s outlook, we’re going to take a look starting out with American Express. We also got Microsoft, Pfizer, Gilead and Franklin Resources and a very important Hot Stocks Outlook, and a very important week in the marketplace.
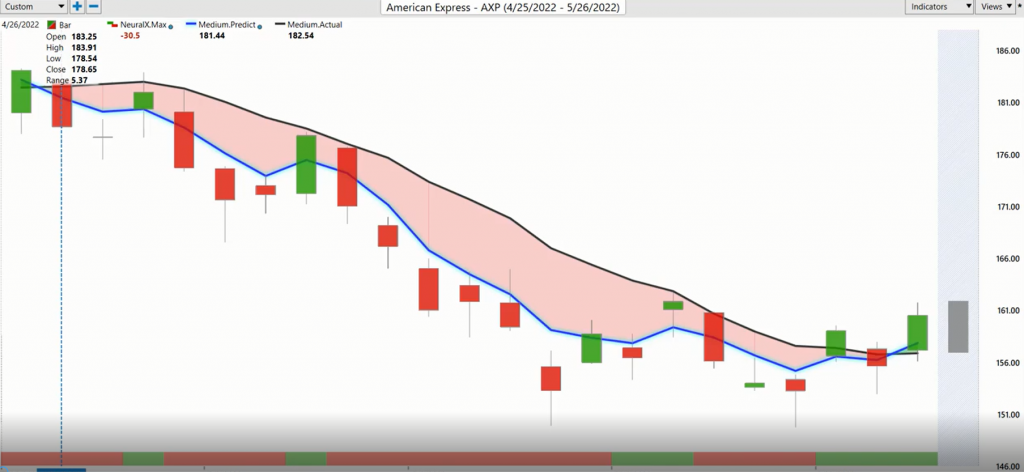
I definitely want to show you what vantage point is forecasting here. So what we have here with American Express as always is daily price action here. So we can see all of these trading days going back really to last month in April. And we can see clearly that the market has been in a very strong down trend, but right up against all that price data, you’re going to notice that there is a blue line and also a black line.
So the black line that you’re seeing right up against all that daily price action is a simple moving average. That’s actually a very common technical indicator. In this case what it’s going to do is just look back over the previous 10 closes and add them all together and then divide by 10. And so that’s a very good tool that looks back over the previous price action and smooth things out to let us know where market price has been, but obviously, traders need to be ahead of the next move in the market. And so what we’re able to do is actually compare that lagging moving average to this blue line on the chart and for that number to get calculated and plotted against the chart, this is where the technology of artificial neural networks come into play. So before that number gets plotted, vantage point is utilizing the technology of artificial neural networks to perform what’s called intermarket analysis and understand how relationships between markets are affecting your trades.
So in the case of American Express, well, this is going to be driven by things like the big ETFs, financial ETFs. This is going to be driven by individual stocks, things like the dollar index, global interest rates, global futures, commodity prices, dollar index, oil prices, gold prices. So all of these things are factoring into your portfolio and those individual markets you trade. But more importantly, when you do that approach of intermarket analysis, there’s some extremely important clues that can be pulled out of this data and used to accurately forecast future price. And so it’s that technology that’s being weighted into the value of these indicators, turning what we’re lagging indicators that are just going to lag behind price into a forward looking predictive tool.
So we see with American Express here, and this getting back to many of the previous Hot Stocks Outlooks over the past couple months here. We keep showing these bearish opportunities because as you run your in tele scans and you’re looking for new shifts in the marketplace, well, you just see that most of the market is in a down trend. And you see here in shares of American Express, you see that quite clearly. Now, while you’re in a trade, though, you have this other indicator at the bottom of the chart, and this can help you over the course of a certain trading period, but this is also derived via that neural network process, but it’s only looking ahead 48 hours at a time. So it’s solving a very short-term problem for the trader, and it’s looking at just 48 hours short-term strength or weakness, And it gets that right with upwards of 80 plus percent accuracy over the long haul.
So when we can combine that predicted moving average, get the overall expectation of trend, and also come in here to help us with this short-term price action as far as when some short-term strength is coming into the market, you sometimes want to be prepared for that and really game plan for what’s going on there. Now, we’ve seen that we’ve gotten a lot of weakness in the market here from blue line to blue line crossover, we see you have a bullish crossover here. We’ve had a really nice move lower, but this is what’s critically important for traders to do is understand those periods where the portfolio potentially needs to start shifting, right? Getting out of short positions, putting in some long positions, and having a portfolio that’s really structured to benefit almost regardless of what happens out there because it’s consistently benefiting from these predictive forecasts on those individual markets that you decide to get involved in.
So here you see American express a 13 and a half percent decline cross over to cross over, but there’s something going on here in the market. So we need to pay attention to it and understand, okay, well, if we want to get that exposure, where should we be looking, and where’s the safest places to go ahead and do that?
Now here’s shares of Microsoft, very similar to the S&P 500. And again, you see all of this weakness in the market, but the neural index starts to pop higher here, and most recently actually seeing some crossovers to the upside. But over the past few weeks, you just keep getting signals that the market is extremely weak and there’s still a lot of markets that don’t have bullish crossovers here yet. So you need to be exceptionally cautious, but understanding it’s that taking of the individual opportunities and incorporating these individual forecasts into your trading decisions, that’s going to help you consistently make better trading decisions. Right?
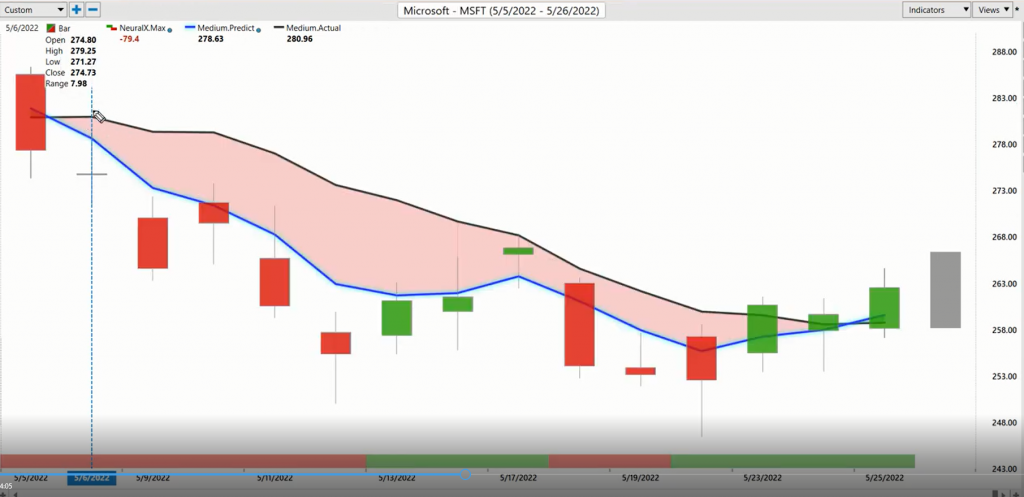
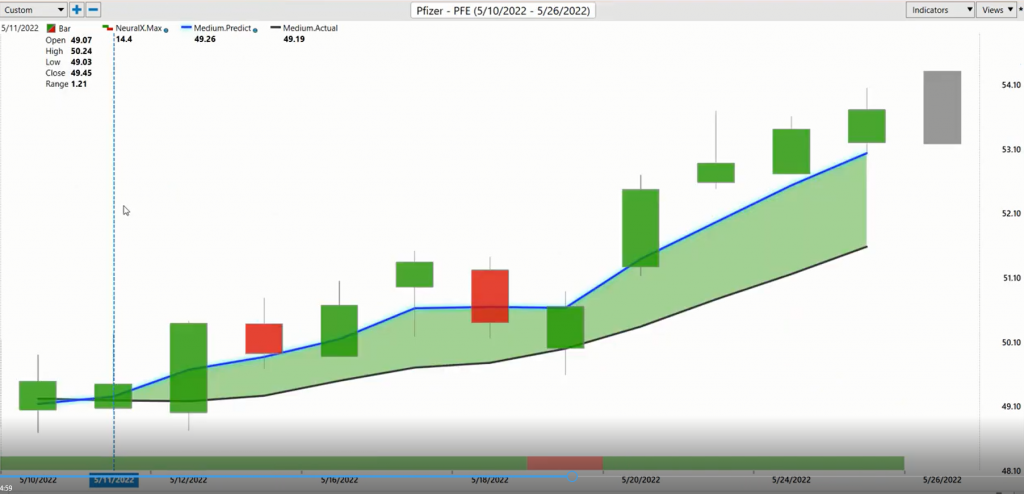
So understanding that, okay, well, if you’re looking to short the market, well, up here at these levels would make more sense for a short, but then again, recognizing that things are shifting here, strength is coming into the market, and if you have been short sorting shares, you probably want to transition that portfolio over and get things a little bit more neutral, if not bullish here. Now, there have been some shares that have actually been quite bullish here. Here’s Pfizer and Gilead. And I just want to highlight this that over the past couple of weeks, while markets have been going lower and lower and lower, you have the tools to understand, okay, well, if there is some strength in the short-term, well, where might I want to focus in on that? And so you see here shares of Pfizer getting across over all the way back on May 11th.
And then again, you can come in with the help of not only that neural index, but this predicted high and low range. And we look at this every single week to help traders with that intra day where should I put a profit target? Where should I put a limit order? To really get the best price possible and take advantage of the current market participants over that time series that you’re trading in. So here again, we can bring up those predicted highs and lows. And again, you see that if you’re looking for areas in the market to get bullishness and get bullish exposure to the portfolio, well, this would make a lot more sense over the past couple of weeks. And again, you know how you can structure that portfolio of longs and shorts, but consistently understanding that if you want to get long, over the past couple weeks, this has been in a bullish up trend.
These levels have stood out at better levels to stake out a position, and now we see if the markets do shift, well, you may have some really exciting entries in markets, right? As the markets start moving higher here. So, of course, we’ll have to walk this forward every day, but that’s really the beauty of the vantage point software here is it’s taking in this information every single day, looking at those other related markets that are going to influence the markets that you’re trading, right? If the S&P starts moving around, the dollar starts moving, gold prices or oil starts spiking, it’s going to factor into all of those positions in your portfolio, and you need to be able to make those adjustments when those shifts in the marketplace are happening. So there’s Pfizer there. Here’s Gilead. So again, just highlighting that not everything has been bearish despite the fact that we’ve been bringing in just bearish opportunities, but that’s because the broader markets are bearish.
And it just makes the most sense to get net short over these past couple of months, and just go with the flow of things where all these forecasts are highlighting these trends breaking out.
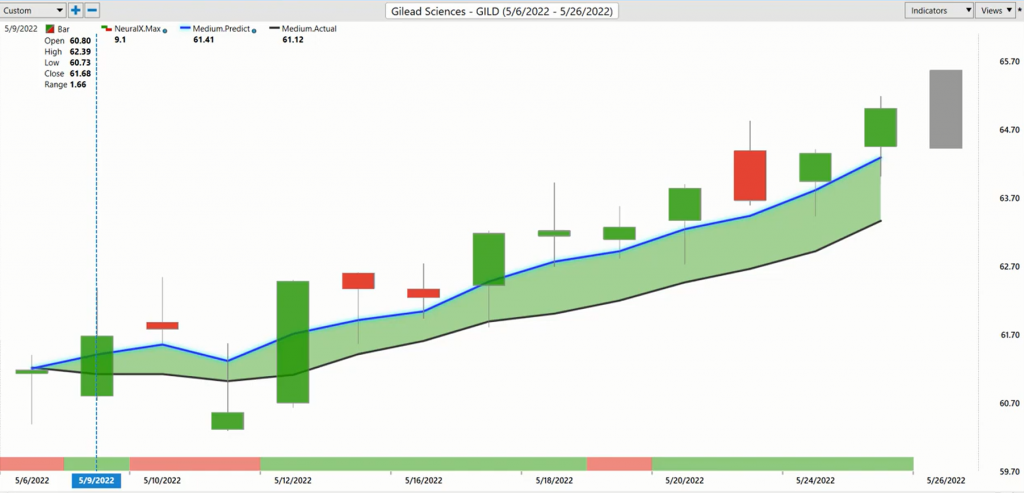
So here in Gilead, you see a very similar picture of blue line over black line, but very clearly here the past two weeks, right? If you’re looking for an area where to you want to get bullish exposure, and there haven’t been many areas where you might want to do that, well, you can use these tools and say, okay, well, I’ve got vantage point predicted highs and lows even before these trading days occur, you just set limit orders down at these levels. It’s not as though you even need to be there during the market trading day. But understanding that look if Gilead gets down here, you want to go ahead and scoop up shares, take profit up towards the upper parts of these ranges, if possible, but that’s the guidance there, right?
A very strong forecast. And even over the past four days, up trend, strong neural index, it’s about as bullish as things get here.
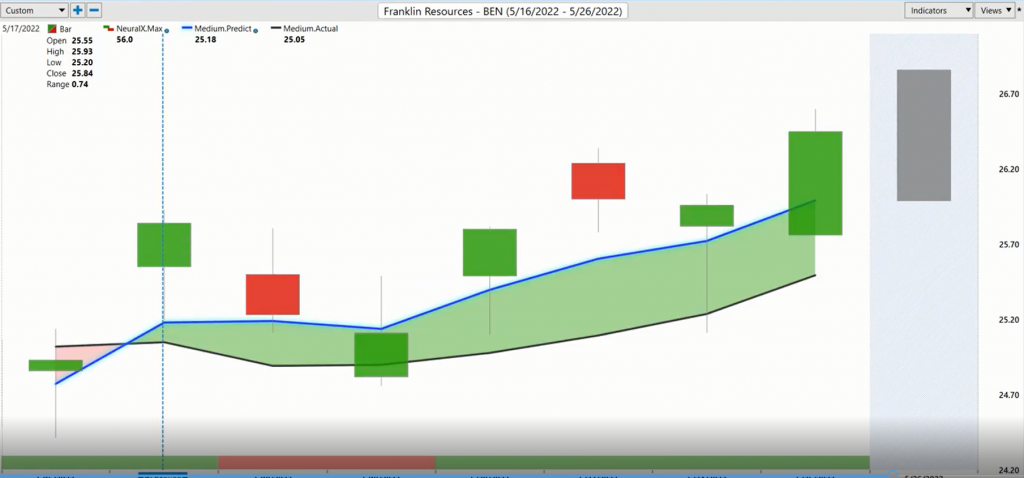
Lastly, here, Franklin Resources, I just want to bring another financial crossover of the upside, and then just highlighting how helpful these predicted highs and lows are. Right? So if we go ahead and bring up these levels, even where you get all of this volatility and you see this crossover come through, this is really the magic of artificial neural networks is they’re able to take in all of the daily information, do perform that inner market approach and then make highly accurate predictions about where future prices are heading. But this is the key behind this technology.
It’s adaptive. It’s able to take in that info, make the appropriate adjustments, and as long as you as the trader can understand, okay, well, let me make sure that I stay fluid and make these market adjustments when the software is highlighting these shifts in the marketplace, well, it’s going to make a big improvement on not only where you’re looking, but how you’re managing those opportunities that you decide to get involved in. So you see just a little bit of a rally here. We have a very interesting market here, right? Very strong down trends. Everyone’s trying to figure out where’s that bottom going to set in, which stocks are the best opportunities to get involved in, and that’s exactly where a tool like Vantage Point can really help you understand how to manage things as efficiently as possible. So we’ll go ahead and leave it there. Once again, this has been the Hot Stocks Outlook for May 27th, 2022. Thank you all for watching. Best of luck, and bye for now.