Register for a Free Live Training
The Hot Stocks Outlook uses VantagePoint’s market forecasts that are up to 87.4% accurate, demonstrating how traders can improve their timing and direction. In this week’s video, VantagePoint Software reviews forecasts for SPDR SPY($SPY), AMD ($AMD), NVIDIA ($NVDA), Charles Schwab ($SCHW), McDonald’s ($MCD), Equity Residential ($EQR), Baxter ($BAX), West Pharmaceutical Services ($WST), American Electric Power ($AEP)
SPDR SPY ETF ($SPY
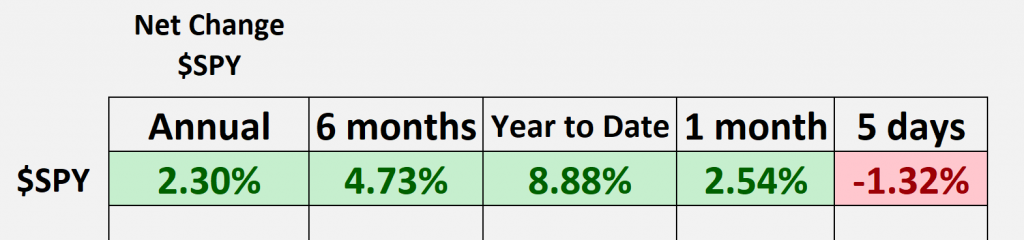
Hello again traders and welcome back to the Hot Stocks Outlook for May 26th, 2023. Hope y’all are having a excellent week out there in the financial markets, and as always, we’ve got plenty of opportunities to take a look at today within our Hot Stocks Outlook. So as we’ve been doing each week, before we jump into the most recent forecast, let’s take a look at the broader S&P 500. So if you are new to the Hot Stocks Outlook, make sure you go ahead and click on that link in the description below and you can actually get a live demonstration so you can learn more of the specifics about how this technology is really going to help you make better trading decisions day in and day out in the marketplace. But as we look over the past year through the SPY, so the SP 500 ETF, well we can see now that if we look back over the calendar, actually a full 12 months, 365 days, we’re actually up about 2.3%.
And as we look at many of these time periods, I mean really what stands out is this move at the beginning of the year. It really started right at the beginning of January. And you see we’ve had a really push since that beginning of the year, but more recently we’ve had some issues. So over the past month, really almost two months now, we’ve run really flat on the S&P 500 and over the past five trading days, well, there’s been a whole heap of volatility and this is why it’s critical to make sure that you’re identifying the right markets to get your attention. So where have we been focused on in our Hot Stocks Outlook? Well, last week we looked at Nvidia, Google. Well, here’s shares of AMD, we’ll take a look at Nvidia again, and there are some places that are recovering in the marketplace, but we need to be quite careful here and I really want to go ahead and highlight this for you guys.
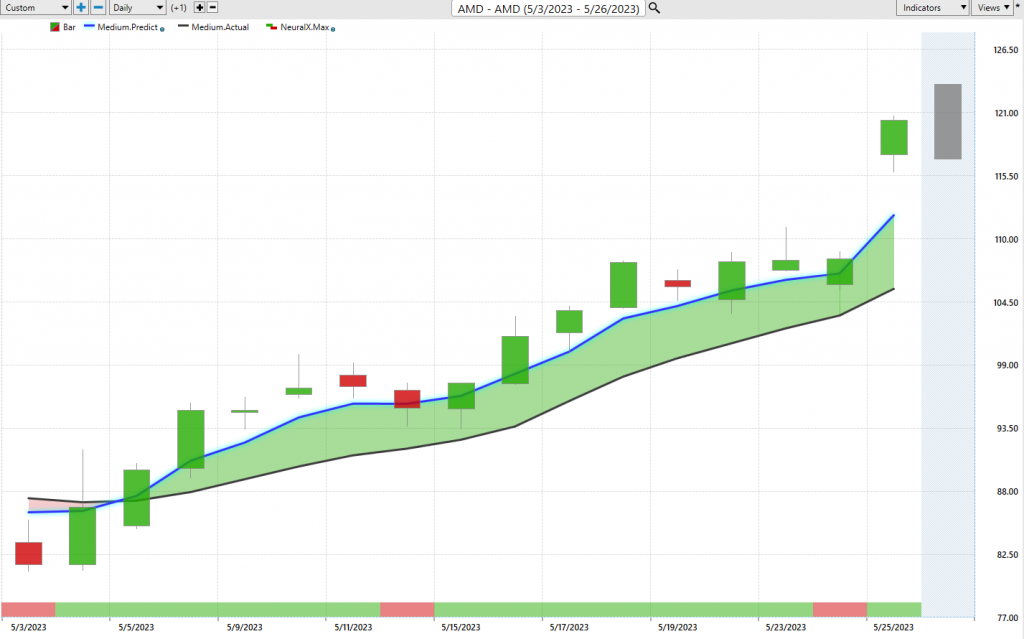
So here with AMD, what we have is daily price action. So all these forecasts work exactly the same way. So right up against that daily price action, what we have is you’ll see a black line and also a blue line value right up against the chart. So what that black line value is a simple moving average. So this is very common in technical analysis. This is a very simple indicator which is just going to look back over the previous 10 closes. It’ll add those all together and divide by 10, or that number. So what that does is it smooths out the existing price action for us as traders. But a trader needs to be ahead of that next move in the marketplace. So what we’re able to do is compare that black lagging moving average or where the market has been to this proprietary predicted moving average.
So for this value, for this predicted moving average to be plotted on the chart for traders every evening, well this is where the technology kicks in. So what’s going on under the hood is that specifically known for AMD, there are markets that are known to drive and influence the future share price. Now these price clues can be found in things like the S&P 500 itself, or things like the NASDAQ. But it’s also going to be able to examine things like technology ETF groups, all the way down to individual stocks like perhaps Nvidia or Microsoft, some of these other companies which can share really important market relationships. But it takes it all the way down to things like global interest rates, so the value of the dollar index, or things like global commodities, like oil or gold prices. I mean imagine if you’re trading ExxonMobil or Hess that we’ve looked at over the past few weeks.
This is critically important and it’s affecting your portfolio value and the individual markets found therein. So what happens is the artificial neural networks are able to take in all of this information. Essentially this is the data set used to generate those future price predictions. So that’s what’s going in to the analysis before any of these values are plotted. So it’s essentially these predictions of future price that are used to construct these indicators. So rather than having traditional technical analysis that’s always going to look at the past, now we have a predictive technology that’s going to forecast with a very high rate of accuracy. So whenever we see that blue line value, essentially that prediction of average prices move above the actual moving average, well it suggests that you should expect prices to start moving higher as a forward looking forecast.
So here at AMD, well naturally we’ve seen a lot of advancement in the tech space, here about a 36% rally over the past 15 trading days, and a big pop there from shares of Nvidia that had earnings the other day. So we can come back to the Nvidia chart here and examine some of these predictive indicators. So what we looked at over the past couple of weeks and really every week is that, aside from that predicted moving average, when that blue line crosses above the black line, that’s that average prices really picking up by that technology and saying, “Okay, things are skewing to the bullish side.” And you also see about a 38% rally here.
But traders have all different sorts of problems that they need to solve. Maybe you want to add to your position, maybe you’re just a very short term trader. So the VantagePoint artificial intelligence software here, it has some additional features. If we look at the bottom of the chart, we see this bar that goes from green to red and back to green. And this is also constructed utilizing the technology in that same way, looking at those competing market relationships and then generating future price predictions. But this is tuned to solve a different problem. And the problem that what we call the Predicted Neural Index here at the bottom of the screen is solving, is very short-term strength or weakness just over the next 48 hours. You can think of that as really two candles on the chart.
So when we combine the overall strength of the overall market with that short term forecasting, well this can get us really be prepared to say, “Okay, well the overall trend is up. Maybe want to be buying on the dip, maybe want to be using some of this price weakness to actually go ahead and accumulate a position.” And we see here with earnings getting that big pop in the marketplace. But that’s not it. So we also get the overall trend Predicted Neural Index, but we’re even provided a daily predicted high and low. So essentially an intraday prediction, again derived via those neural network processes to pick out a high and a low for the trading day. So again, we have another tool here to help solve these difficult problems as far as where should we be looking to add into the market.
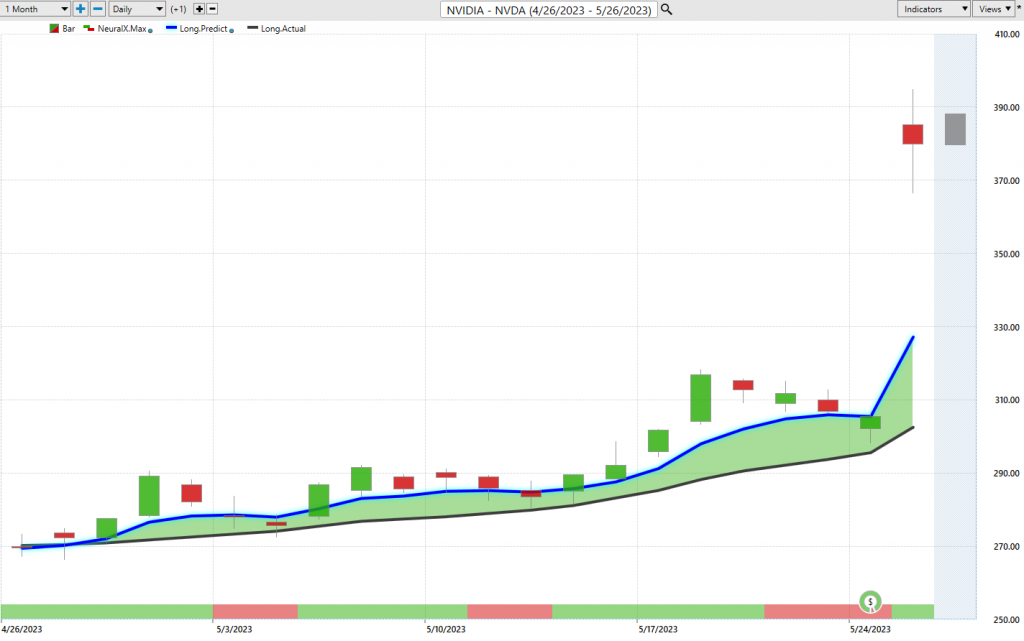
So this is why over the past month here in Nvidia, well the trend has been up, if you want to accumulate a position, you can do it down towards these predicted lows would be a nice way to go, and you see getting this huge blowoff move here as earnings come through and creating that almost 40% rally here and the overall tech space doing well. Another space that’s done well this week has been some of the financials. And you have to be really careful here because we’ve got a market where there’s a very select markets that are doing extremely well and that’s allowing the indexes to do quite well. But if you’re positioned in some of the wrong stocks, well there can be some real pain up ahead here and maybe continuing here.
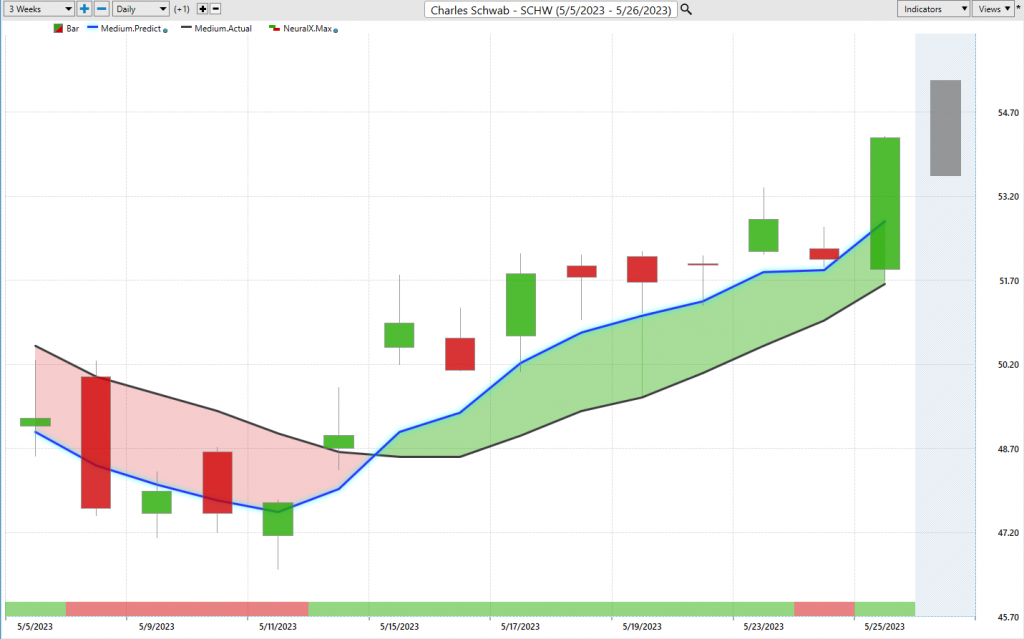
So here we have Charles Schwab. You see we have our predicted moving averages, our blue line crossing above the black line. Neural index extremely bullish here. And we see that over the past week in the market there’s been Charles Schwab, Raymond James is another one of these, it looks quite good. And we can utilize these short-term predictive indicators to say, “Okay, where might I want to accumulate a position to benefit from actual strength coming into the market?” Got a very sideways S&P, and like I said, you really need to be in the right things because you’re in the right things and they’re moving in a tremendous rallies here. Here’s Charles Schwab up about 5% just over the past week here of trading and a little bit more, as we see about seven or eight trading days here, market has been clearly forecasted in an uptrend. You see about an 8% rally there over eight trading days in Charles Schwab.
This is what I want to get to here. Now, it’s not all smooth sailing out there and there’s been a lot of markets that had been doing really well. We had that really great rally a couple months ago in the S&P, but now what we’re starting to see is more markets where this blue line is crossing below the black line, indicating that the expectation is for average prices start going lower, and as long as that blue line remains below the black line, well that might be some places where you may want to short, take profits on those short positions.
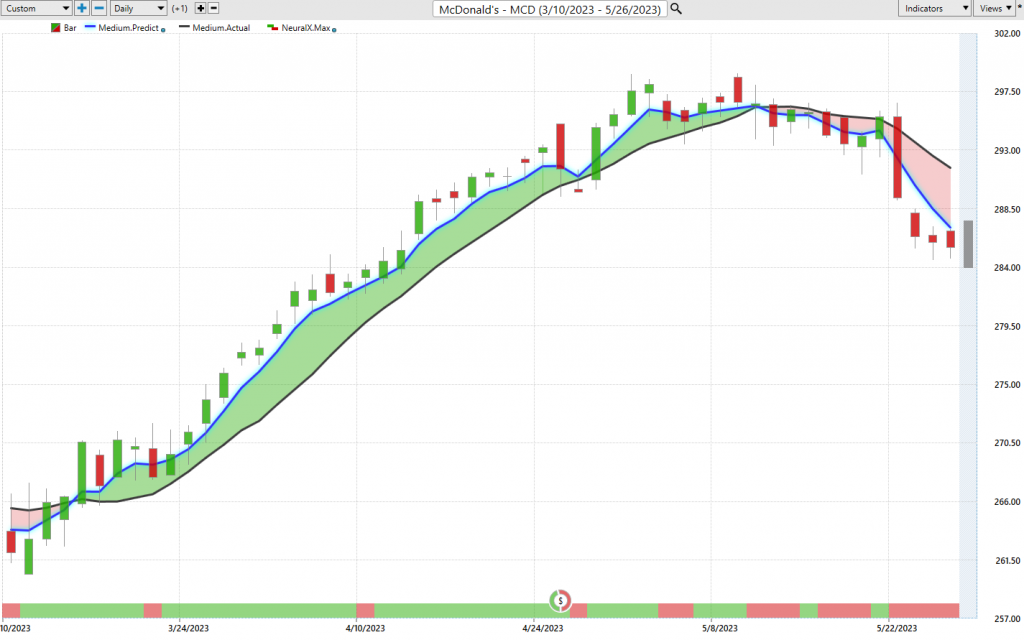
So again this week, as we look at the market here for shares of McDonald’s, we can see, what is the software indicating other than a short up towards these predicted highs and target the predicted lows, and expect the overall trend to continue lower here.
So we’ve had, again, so many markets that did extremely well, but you’re really having a separation here. So some markets are starting to recover, do well, other markets are actually starting to turn lower and you’ve seen about a 11% rally over 39 trading days. But that can quickly flip and you see how quickly you’re off about 4% just over the past 11 trading days in a very large stock here with McDonald’s.
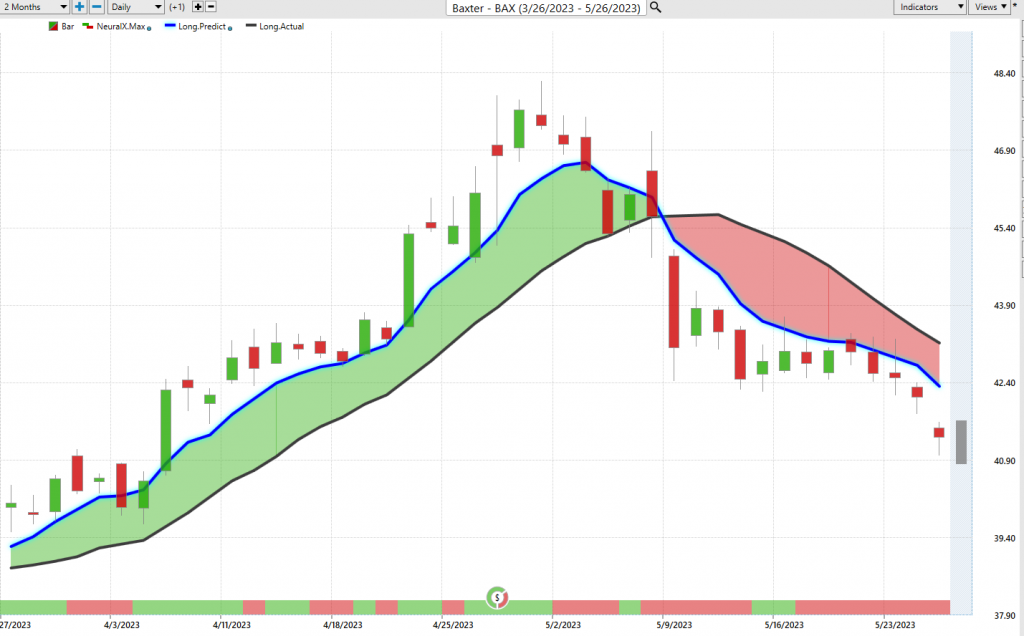
Here’s shares of Baxter, another market that very similarly we looked at on the way up. Really nice opportunities, forecasts showed a lot of strength, but the most recent forecast we highlighted that there is a shift here, and you really need to pay attention to that shift and where those shifts are occurring.
We see a lot of the medical device companies and the ETS doing very poorly. So this is where, again, the VantagePoint forecasts are used to say, “Okay, well all you want to do here is short, take profits on shorts.” You can certainly be long the market in other areas where those forecasts are getting bullish, but we’re seeing some warning signs spread out throughout the marketplace, and even now we see about 11% move over the past 14 trading days, very clearly here not a place where you want to be positioned in the market, how quick some of those markets can snap back and give back a lot of the gains if you’re not taking profit and aware of those important market shifts.
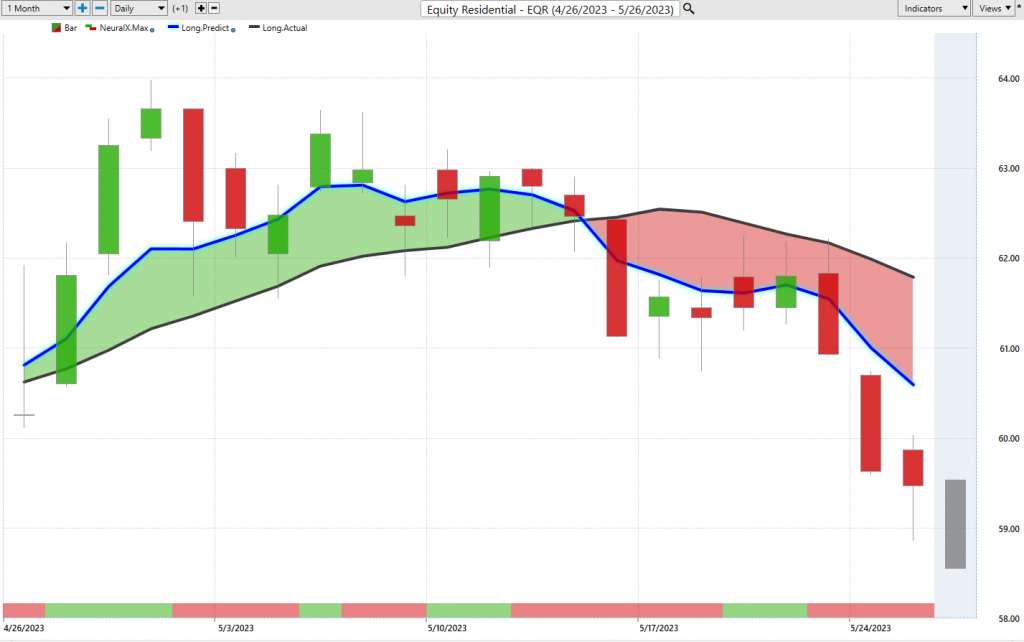
Here’s equity residential, and I wanted to bring these in. These are markets we just looked at last week on the bearish side, and the reason being that you may want to go ahead and hedge that portfolio and identify areas of weakness where you can have the longs in the portfolio but have things that are also short in the portfolio to balance things out if we start to see a lot of volatility. You see that volatility coming to the S&P 500, well the good stuff stays doing really good and the weak stuff really keeps having some problems. So here in equity residential, we can look at those predicted highs and lows, and just over the past five trading days, I mean this is from Friday from last week, essentially I make the videos on Thursday going into Friday, and you see here, look towards these predicted highs to do what? Short the market and take profits on short positions.
So equity residential, continuing on that weakness that we identified pretty early on here as far as highlighting some of these warning signs coming into the market. Shares off about 5% over the past 12 trading days.
West Pharmaceutical Services ($WST)
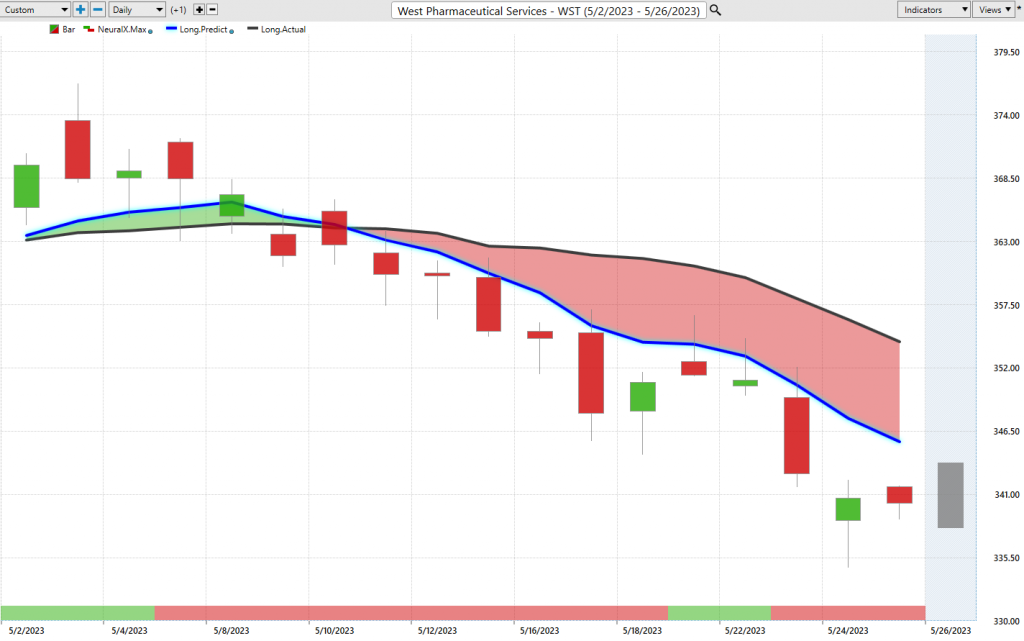
West Pharmaceutical Services, another one of these markets we looked at last week, crossover to the downside. You see this Neural Index gets bullish and you get a little bit of a sideways price action. But again, over the past week here since the last Hot Stocks Outlook, what do you want to be doing? Looking towards these predicted highs to short and take profits on those short positions. So nice move here again, just over the past week, getting a little bit of more of a move, about 4%. And this is the thing, is you’ve got some of these shares really popping and doing well, but very clearly here, 4% in just the week in moving lower. So we need to really separate which markets are doing well, where there’s that weakness and make sure we’re not getting caught up in the wrong things.
American Electric Power ($AEP)
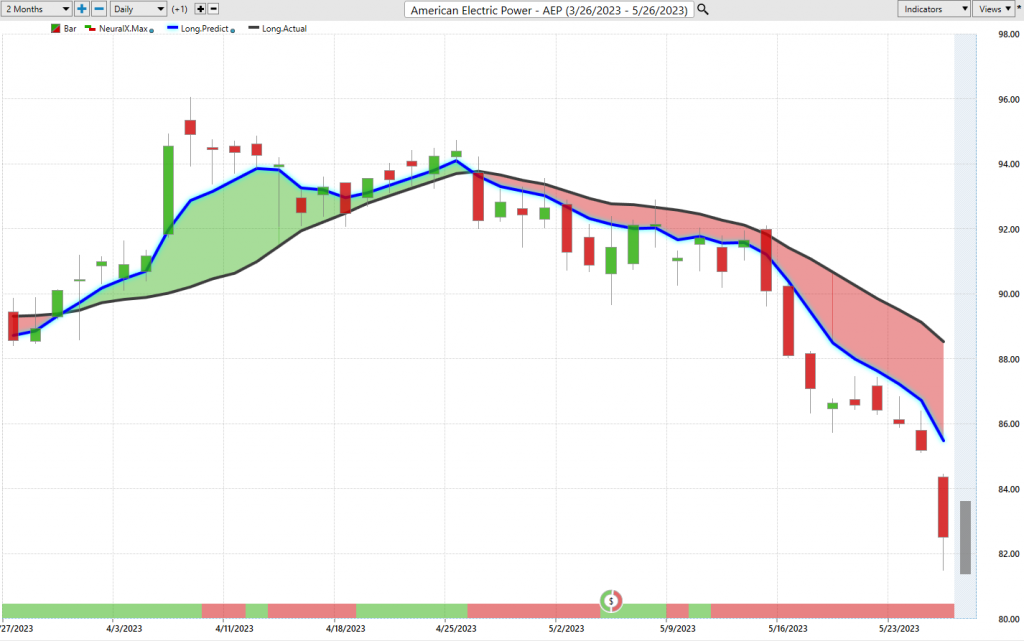
Utilities as a sector has been extremely weak here. So here you see that blue line crossing below the black line, Neural Index very bearish. Again, we get those periods where you see as the Neural Index goes bullish, you get that conflict. The overall trend is down, but expect some strength over these subsequent 48 hour periods. But if anything, those 48 hour periods are areas that offer opportunity to short on strength. Short near the VantagePoint predicted highs, understanding that this market is still in a down trend. So really nice opportunities early to position yourself on the short side, and again this past week, very clearly here, understanding that utilities is actually very, very weak here. A great place to go ahead and short the market, hedge some of those longs that you may have. And there you see a utility stock off about 11% in just the past 21 trading days. So very important to make sure you don’t have things in the portfolio really set up in the wrong spot. So this is really where tools like the VantagePoint Intelliscan are extremely helpful.
I meant to show this last week, but let’s take a look at it this week. So what we can do here is you see this is actually the S&P 500. We can fill up this entire view here of whatever markets we want to look at, futures, commodity stocks, and we can actually sort some of this and say, “Okay, well are we looking for markets that are at least showing an uptrend from that VantagePoint predicted moving average crossover?” Then we can sort through some of these opportunities and really identify some of the better places where there’s that real strength in the overall marketplace. So here we see technology space. There’s really very few markets where there’s been these really strong trends, and actually as we go ahead and we can sort this by our days category and see where are the markets that have been in the strongest trend, well, these are the markets we keep highlighting in the Hot Stocks Outlook. There’s Copart, Microsoft, Google, Nvidia. And it’s a very small basket of things that are actually doing very well.
So as a trader, when you can say, “Okay, I can identify an area of the market,” come in and say, “Okay, well here’s some strength in the marketplace. Well, how might I want to manage that day to day? Well, that’s where tools like the Vantage point Neural Index, the predicted highs and lows, can help you as a shorter term trader manage these opportunities day-to-day and week to week. But it’s critical that you utilize tools like VantagePoint’s Intelliscan to really see where those big shifts in the market that’s coming in for new opportunities, like we saw actually with some of the financials this week, and really where those danger areas are, where there’s whole sectors really looking bearish, or just those individual opportunities that you really need to get out of the portfolio and get off the radar. So we’ll go ahead and leave it there, but once again, this has been our Hot Stocks Outlook for May 26th, 2023. Thank you all for watching. Best of luck and bye for now.