


Register for a Free Live Training
The Hot Stocks Outlook uses VantagePoint’s market forecasts that are up to 87.4% accurate, demonstrating how traders can improve their timing and direction. In this week’s video, VantagePoint Software reviews forecasts for SPDR SPY($SPY), Eli Lilly ($LLY), Huntington Bancshares ($HBAN), HESS ($HES), Hewlett Packard Enterprise ($HPE), Molson Coors ($TAP), Northrop Gruman ($NOC), L3 Harris Technologies ($LHX), Pepsico ($PEP), Baxter ($BAX), COPART ($COP), PFIZER ($PFE),
SPDR SPY ETF ($SPY)
Hello again traders and welcome back to the Hot Stocks Outlook for May 12th, 2023. Hope y’all are having a excellent week out there in the financial markets. And as always, we’ve got plenty to cover in this week’s Hot Stocks Outlook. So if you haven’t already, make sure you go ahead and click on the link in the description below. You can sign up and get a live demonstration, learn more of the specifics about how this technology can help you make better trading decisions in the marketplace.
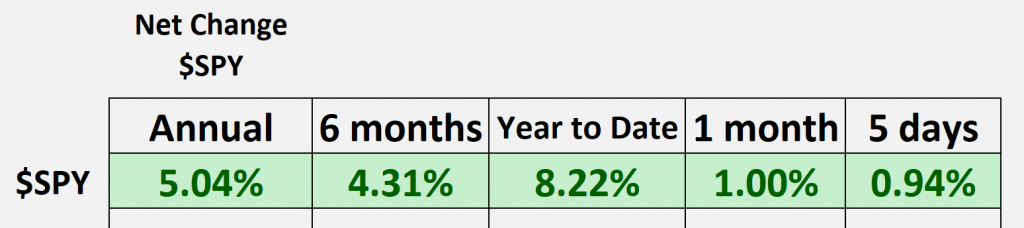
But as we typically do, let’s take a look at the broader markets and the SPY ETF. And what we can see is over the past 12-month period now, we can see we’re actually up about 5%. But really the bulk of that story has been this rally that started at the beginning of the trading year, that’s when we had Tesla and Amazon and Disney, all these stocks doing really well.
And what we’ve seen more recently is a lot of earnings come through a lot of chop and volatility in the marketplace. And this is especially why it’s important to be in the right stocks and focused on the right thing. So what I want to highlight today is how we can utilize those tools to identify better trading opportunities. And this is going to be a bit of a review episode. I’ve brought in a ton of markets that we’ve looked at over the past several weeks and months, and again, highlighting how critical it is to say, okay, well what is my trading style? What is my timeframe and how can I utilize the best tools to exploit some of these market opportunities?
So we’ll start out with shares of PepsiCo to act as an example, and then we’ll go through many of these charts pretty quickly as we’ve covered them already over the past few months. But let’s cover how these indicators work and then we can cover these forecasts quite easily.
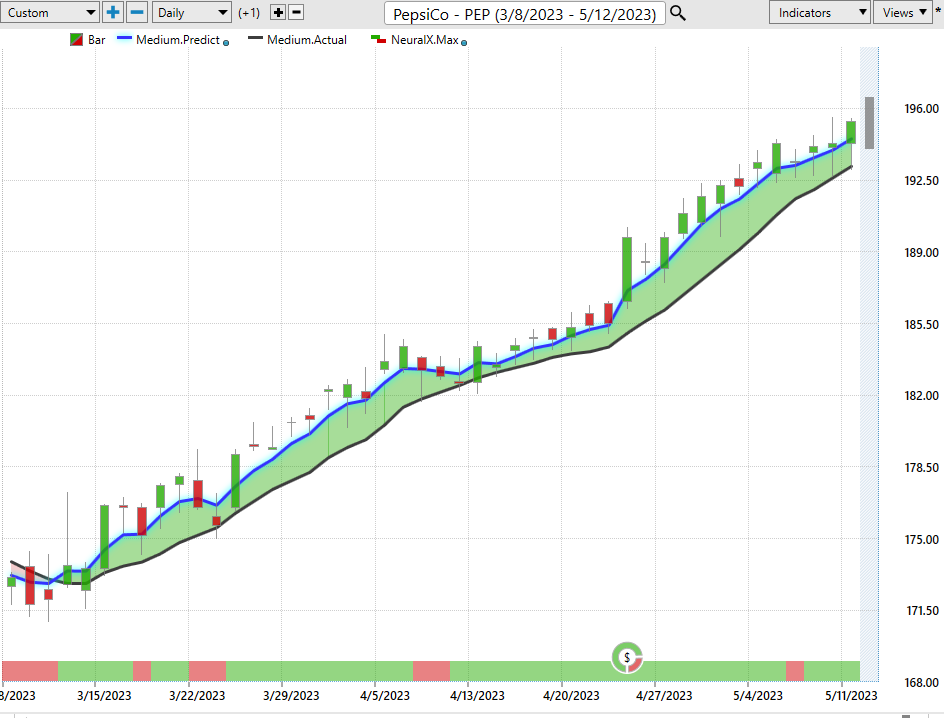
So what we have here is daily price action. So each one of these candles that you see against the chart here is a full trading day and right up against all those daily candles, what you’re going to notice is that there is a black line and also a blue line. So the black line value that you’re seeing on the chart, that’s a simple moving average. So you can think about that, that’s a very common technical indicator. In this case what it does is it just looks back over the past 10 close prices, it’ll add those all together, divide by that number. And what this does is acts as a good really measure of where market prices have already been, but traders need to be ahead of that next move in the marketplace.
And so what we’re able to compare that lagging, simple moving average to is this proprietary predicted moving average and for that number to get plotted and calculated for the trader every evening. Essentially it’s a price prediction, a prediction of future average prices moving forward. Well, this is where the technology of artificial neural networks come into play and they’re performing what’s called intermarket analysis.
Now what we understand is there are very important market relationships, markets that are known to drive and influence the future price of PepsiCo. Now, that can be things like just the S&P 500 and the SPY ETF. That can be things like Coca-Cola, maybe other beverage companies, other ETF groups in the consumer staple space. But it’s able to find a lot of these very subtle market relationships that traders wouldn’t be able to identify or understand. And this is where it can be in individual stocks, it can be in the broader commodities and futures markets.
Maybe you’re trading something like we looked at Hess and is going to be affected by the movement in crude oil prices. And so this is what’s going on behind the scenes. But for the trader, it acts as a very helpful tool to say, okay, well let’s round out all that information and say, well, what’s going on here? As long as that blue line crosses above the black line, it’s suggesting average prices are expected to remain up. And so as long as again, that expectation of future prices remains above that lagging moving average, that black value, you can expect the market to move higher. And so you see over the past few weeks as the markets have had a difficult time, well here very clearly Pepsi shares are up. Okay, well maybe we can look a little bit more short term and fine tune how we might want to trade in that environment.
But let’s go ahead and now look at these other predictive indicators to help understand really round out the forecast here. Now, if you look at the very bottom of the chart, you see this bar that goes from green to red, back to green. This indicator is also utilizing that predictive data and that inner market approach, but it’s solving a different problem for the trader. And this is short-term strength or weakness over the next really two trading days or 48 hours. So you’ll see that as the neural index in this case goes bearish, you might get some sideways price action, but as long as that blue line is above the black line and your overall trading strategy is, in this case a trend trader, well the overall trend is still up. You don’t want to get out of the market entirely, but you may want to expect some sideways or weakness over those subsequent 48 hours.
But as we go through many of these charts, what you’ll recognize is notice that when the market is extremely bullish, you get a very straightforward forecast. And when we look at, let’s take a look at this overall here, if we look at how many trading days this market has traded. PepsiCo, we can see here this market’s up over 43 trading days. That market’s gone up 12 and a half percent and it’s pretty much grinded higher every single day. Look how few days that neural index is bearish indicating any short-term weakness and therefore how many days the overall trend is up with a ton of strength out of your short-term indicators. And then to really round out these forecasts like we do every week, is we’re given a actual prediction for the next day’s high and low. And this is where it gets down to intraday price levels and setting up for your trading day.
And you can see how accurate all of these predictions are against the actual market data. So if you understand that, Hey, Pepsi, there’s a lot of strength here. Well, where might you want to be accumulating a position in Pepsi and where also might you want to be taking profit in the short term? And so there’s obviously been some nice percentage moves in this gap over the past couple weeks.
But I want to get to a lot of charts because this is where we can really understand, okay, well over the past couple of months, what have we been focused on in the Hot Stocks Outlook and where have been some easier places to trade?
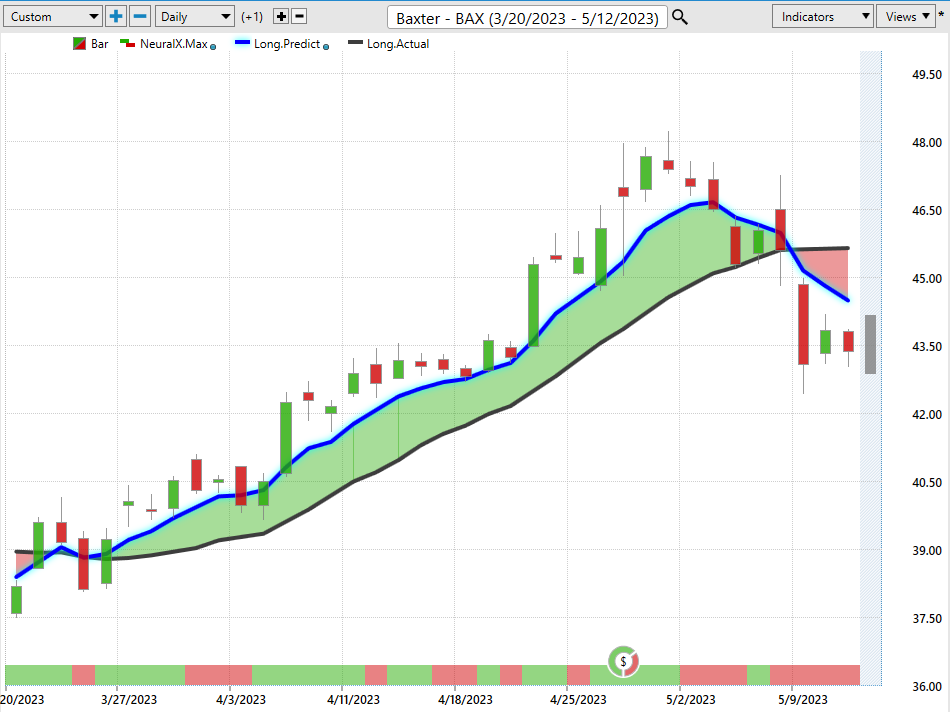
Well, here’s Baxter, and we kept highlighting that this is a very strong market because we got this crossover to the upside. You’ll also see as we bring in those predicted highs and lows, you get an excellent entry early on in the trade to start participating in that move. We highlighted this here and then we brought it through again to sort of update the forecast.
Well look how the recent forecasts have shifted here. And so over the past couple of weeks, you’ve seen a neural index that’s gotten bearish. Now again, you can see here out of one, two, three, four, five, six, seven, eight trading days, the neural index is bearish seven out of eight of those. Additionally, that predicted moving average shifted very strongly right here indicating that, hey, this is now in a downtrend. If anything, you want to use your vantage point predictive tools like those highs and lows to get out of your longs or short and take profits on short positions. And you see how this market shifts.
The exact same logic that says, okay, we’ll get long back here down at this predicted low, cover your position, look to go ahead and get short or just take those profits on the long side and get out of the way. And so we see here with that same approach of getting into the market, that gets you out of the market about a 20% rally here over the past 32 trading days in Baxter. So I wanted to highlight how these things shift and how traders can recognize these shifts, and we’ll get to more of that as we look at Northrop Grumman and L3 Harris here. But let’s move on.
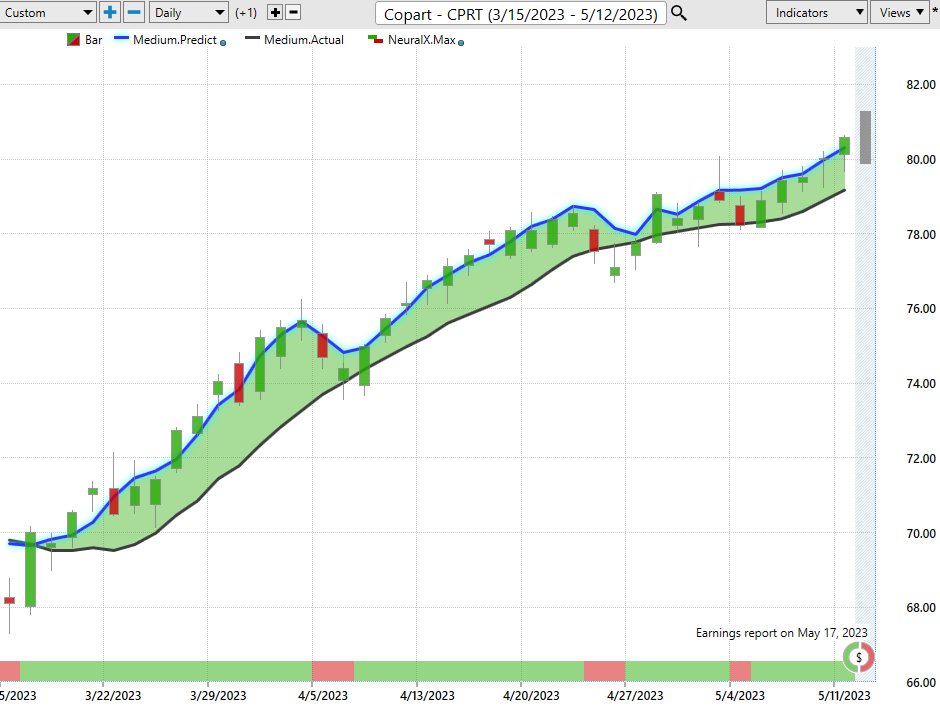
Now, here’s Copart. It’s a market that we brought through a very strong trend. Has that trend shifted over the past few weeks? Well, no. Okay, well, let’s bring in vantage points predicted high and predicted low forecast over the past couple of weeks here and say, okay, well, where are the levels where traders can be looking to accumulate a position? Well, that’s going to stand out down here, potentially a move a little bit lower to this predicted low down here, but buying at the lower parts of this predicted range and benefiting as the markets, in a lot of ways the broader markets run sideways, but you see here up about 3% from those levels.
If we take a look at the entirety of the move, this market’s up about 14, almost 15% over the past 36 trading days. But this didn’t start just last week, right? This has been ongoing and something that you’ve been able to identify that there’s strength in the market here. Well, this past week, Baxter shifted, make money on the short side there, hedge things, but Copart still has some strength. Now, this is really interesting because we keep bringing in Pfizer. And Pfizer because we got this crossover to the downside, neural index very bearish. And you see here how these short-term tools are very effective. Neural index gets bullish here. You’ll see some strength over the subsequent price action. That’s the short-term strength. But is the longer term trend up? Well, no. And the market has to creep lower. Again, neural index gets bullish, you run sideways.
But is this a market where you want to belong?
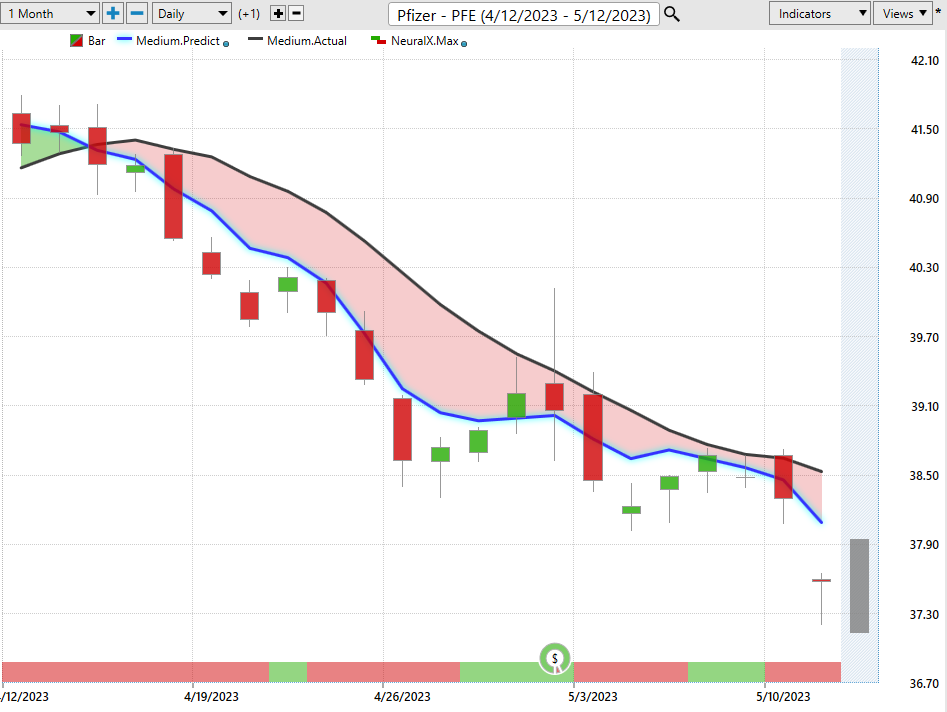
And so within the healthcare space, we have shares of Pfizer here going lower and lower and lower, having a real hard time moving up. You see shares off about 8% in the past 19 trading days.
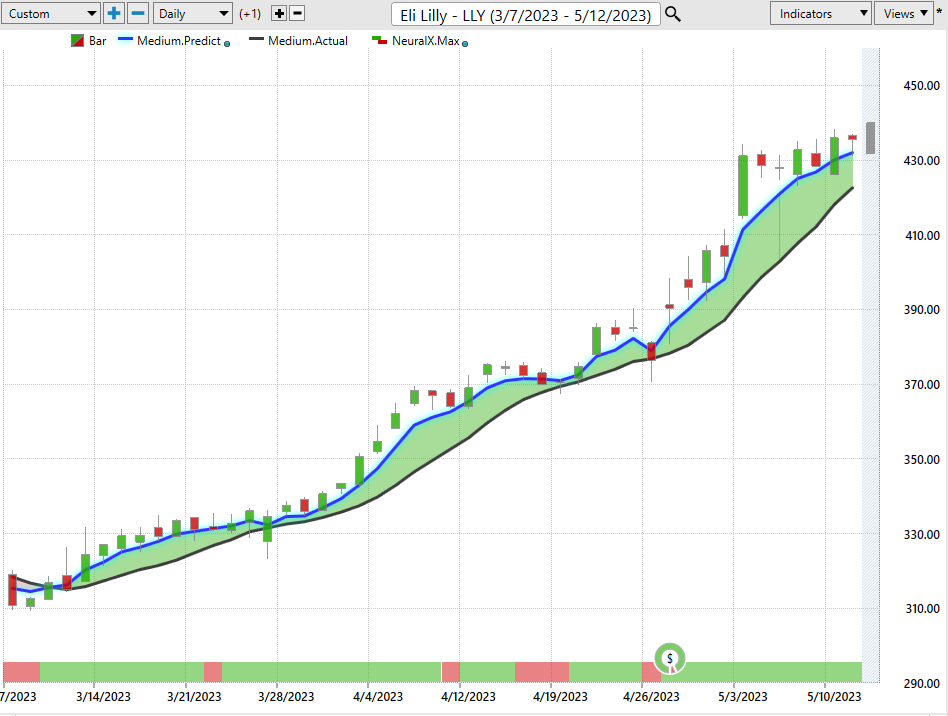
But what’s going on in Eli Lilly, another healthcare stock? Well, the exact opposite. Not only do we have a very strong trend as far as that predicted moving average very solidly above the actual moving average that gleaned about a 37% rally over the past 44 trading days, well, let’s just again look at the short-term forecasting here. Is there strength? Well, the overall trend is up. Neural index for the past two weeks, every single day, expect strength in the marketplace. And so that allows traders to come in and say, okay, well, I’ve got these short-term tools like the vantage point predicted high and low forecast. I can come in and we can see how accurate have all of those forecasts been over all of these trading days.
And you see, as the market and volatility picks up, excellent entries here, you get that pop. And again, as the market runs sideways, boom, boom, boom, boom, about four opportunities there to buy the market, take profit as it moves higher, and then just buy on the subsequent predicted low. So again, just really nice opportunities here. And really just reviewing all of these markets we’ve brought in week after week after week, and now all we’re doing is just updating the short term forecast. So if you are trading in those markets, well, this has been the guidance from these predictive indicators. Now we’ll hurry up and get through a lot of these just to sort of catch up. We did a lot of reviewing on many of these markets that we’ve highlighted over the past few weeks.
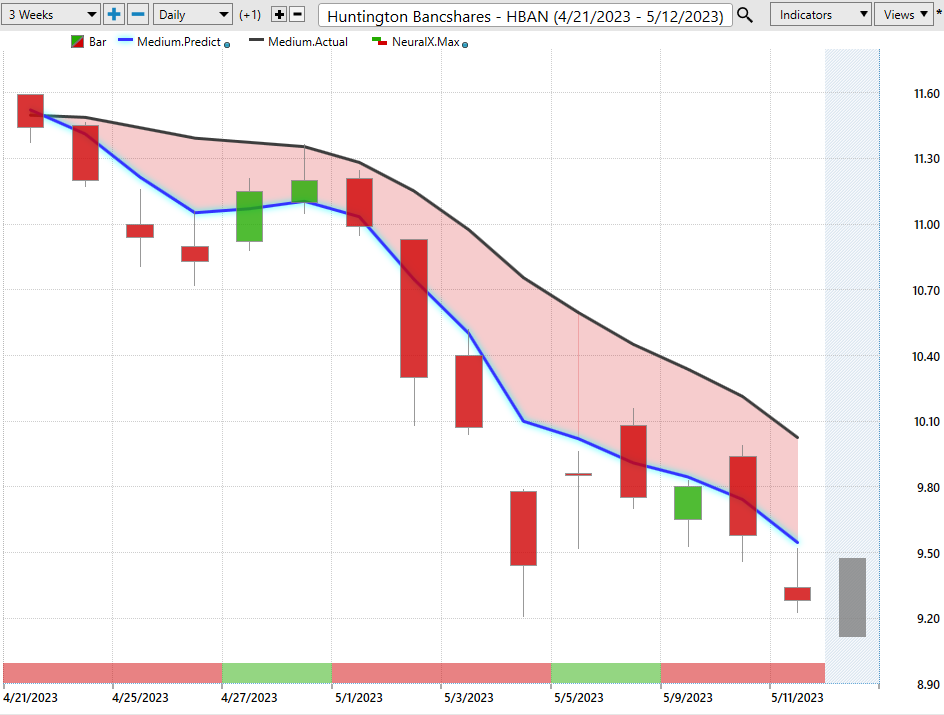
Here’s Huntington Bancshares. So this is on the list of bearish opportunities. You only want a short, take profits on shorts. We’ve got an 18% decline in the past 14 trading days. Maybe more importantly for the past couple of weeks though, where have these predicted high levels come in and said, this is where you want to sell. This is where you want to short. And you see, again, this is only a nine or $10 stock, and now moving about 10% just in the week here. But very important to identify financials. Huntington Bancshares, not a place to be taking on any risk.
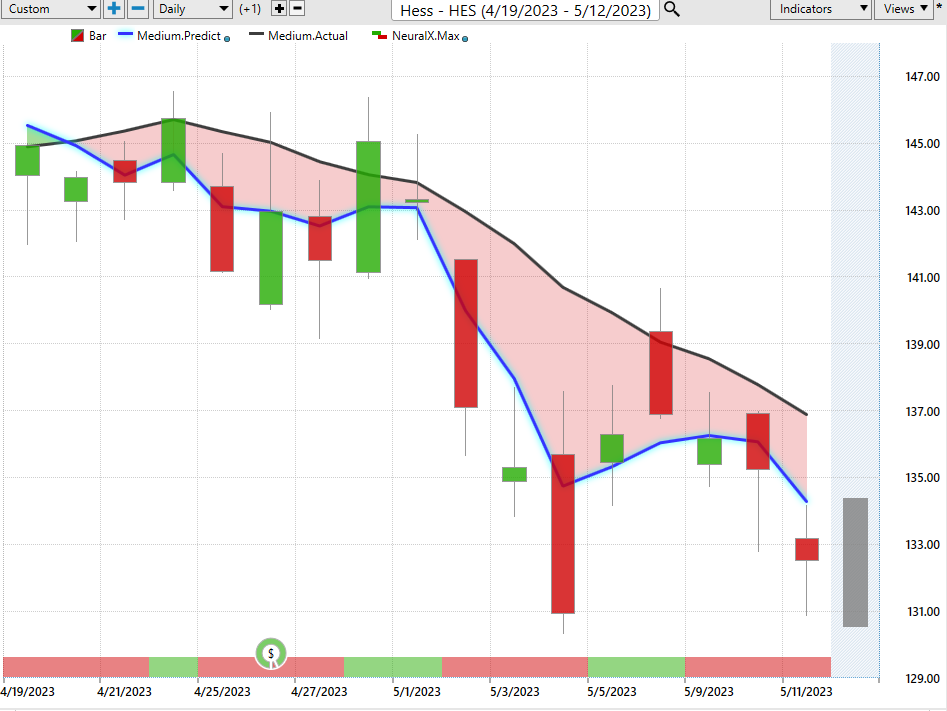
Here’s Hess, really a broken record here as far as watch out for some of these energy shares. There’s about an 8% move there over the past 15 trading days, and previously we were highlighting all the strength in energy. So energy’s been all over the place and the software’s done an excellent job of recognizing that big rally of strength that came in when we got that Saudi Arabia announcement and the market started really moving higher, but also the shift lower to make sure that you’re not caught up in the wrong assets.
Hewlett Packard Enterprise ($HPE)
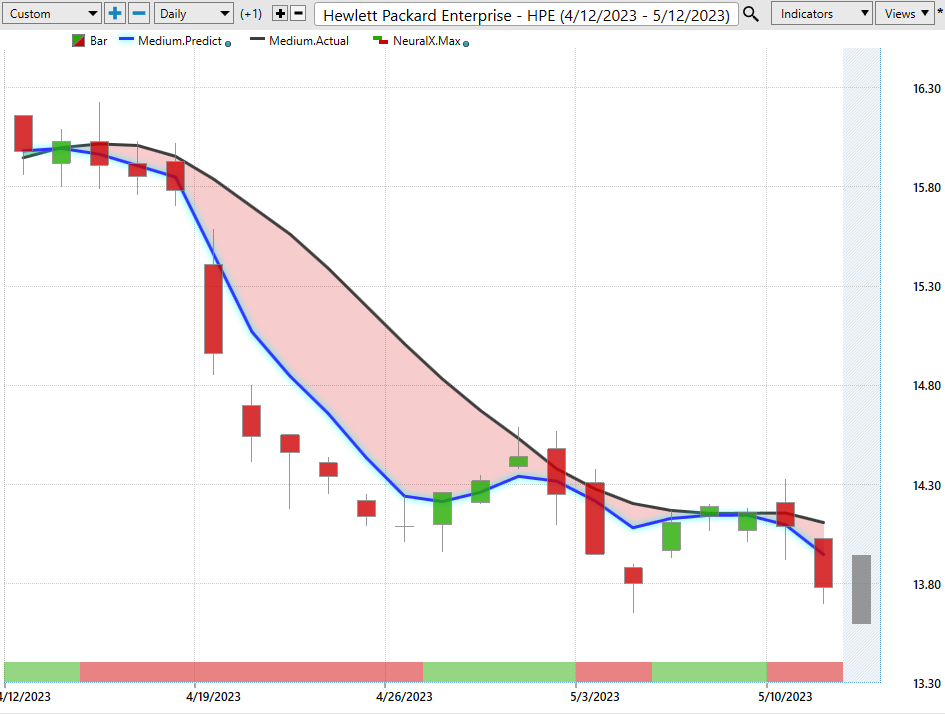
Here’s Hewlett Packard, another opportunity on the bearish side. And we’ve seeing has that bearishness shifted this week? Well, no, the market’s down about 13% over 21 trading days and the predicted highs and lows, again, doing a great job saying, don’t belong here. If anything look too short at these predicted levels and take profit on those short positions.
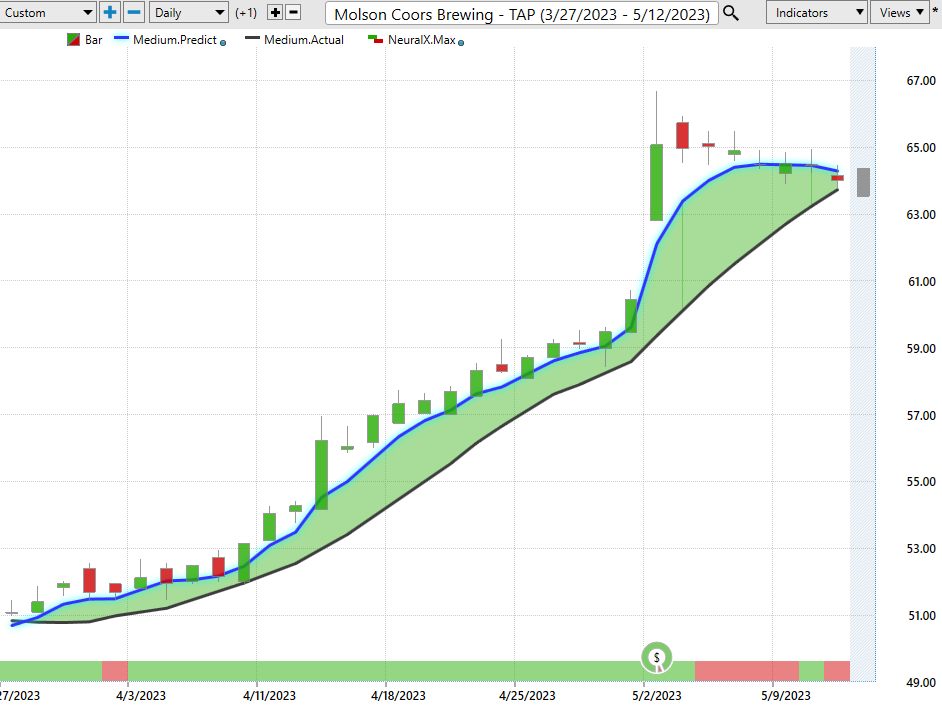
Here’s Molson Coors Brewing. Haven’t brought this in, but thought it might be a good opportunity to bring it in, as we see a huge rally here, about a 26% move over the past 32 trading days. And you even see after this pop in the market here, neural index gets bearish and you see subsequently 48 hours, 48 hours weakness over those subsequent 48 hour periods. So really nice move there in Molson Coors.
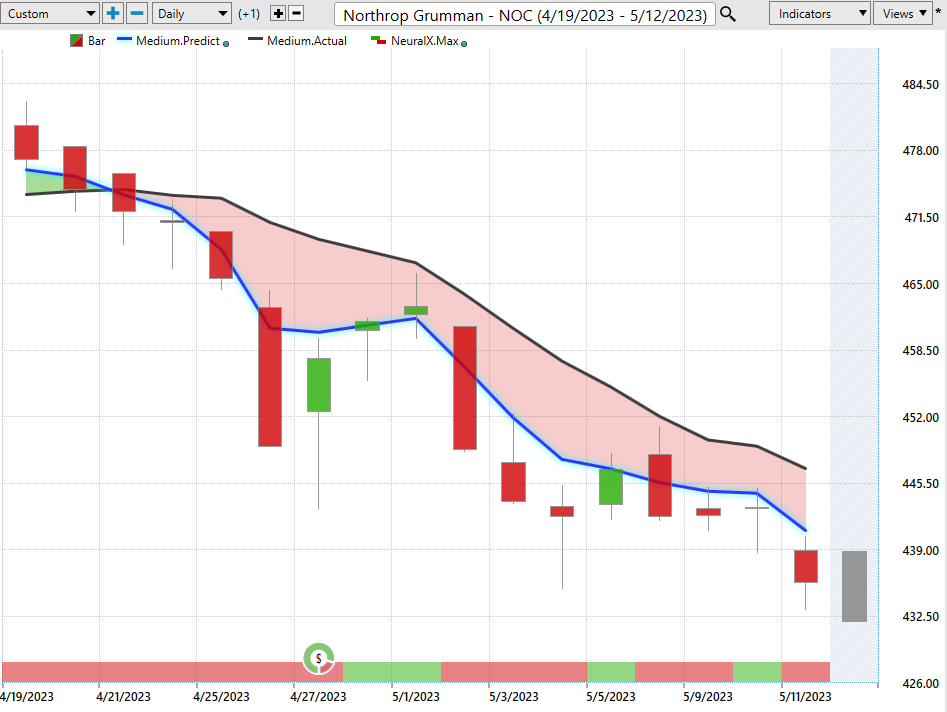
And lastly, I just want to bring in, here’s a couple of these defense stocks that we looked at a long time ago, I mean months ago now, but highlighting the strength coming into the marketplace. But is this an area where you would still want to belong? Well, clearly the neural index gets very bearish here. We get this crossover to the downside. And no, this is not an area where you’d want to go ahead and be exploiting these positions to the bullish side, and that has led to a 7% decline over the past 14 trading days. Now, if this blue line crosses above the black line and things start to shift, well sure, well then there’s an entirely different situation going on there, but clearly here, not a place to be positioned in the portfolio. Going ahead and moving on to L3 Harris, very similarly but again, again I wanted to do this as a review episode.
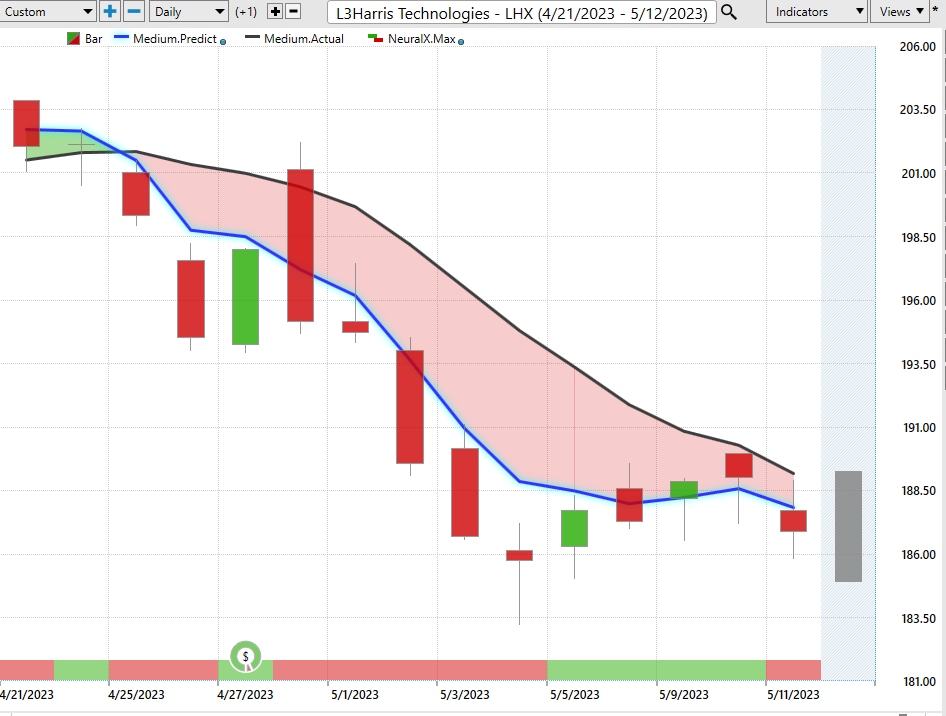
I mean, these are just chart after chart after chart that we’ve looked at now over the past couple of months. And when you see these updated forecasts, it shouldn’t be too hard to figure out, well, okay, well what is my trading style? Am I a trend trader? Am I shorter term? And how you can benefit off of all of these predictive indicators to really warn you of this strength in the marketplace, but also these markets that you just do not want to be on the wrong side of. And what it allows you to do is focus on the things that are working.
And so here again we see Eli Lilly having a really great week here, and again about a 44-day move, and an almost 40% move now as we move through the week here.
So I’ll go ahead and leave it there. Just wanted to bring in all of these stocks and markets that we’ve looked at over the past several weeks, walk forward the forecast so traders can really understand, okay, well, how do these things work and adapt moving forward? It is really important to get that live demonstration, learn about the markets that you’re trading and how these indicators can really help you make better trading decisions for the type and style of trading that you’re doing. So once again, this has been the Hot Stocks Outlook for May 12th, 2023. Thank you all for watching. Best of luck and bye for now.


