Register for a Free Live Training
The Hot Stocks Outlook uses VantagePoint’s market forecasts that are up to 87.4% accurate, demonstrating how traders can improve their timing and direction. In this week’s video, VantagePoint Software reviews forecasts for L3Harris Technologies($LHX), SPDR SPY($SPY), Kinder Morgan ($KMI), Occidental Petroleum ($OXY), Texas Instruments ($TXN), and Tesla Motors ($TSLA)
Hello again, traders and welcome back to the Hot Stocks Outlook for March 31st, 2023. Hope y’all are having a excellent week out there in the financial markets. And as always, we’ve got plenty to cover in this week’s Hot Stocks Outlook.
Now, we’re going to take a real close look at the SPY, the SPDR ETF here, but make sure that if you haven’t already, go ahead and click on the link in the description below to get a live demonstration and learn more of the specifics about how this technology can help you make much better trading decisions day in and day out in the marketplace.
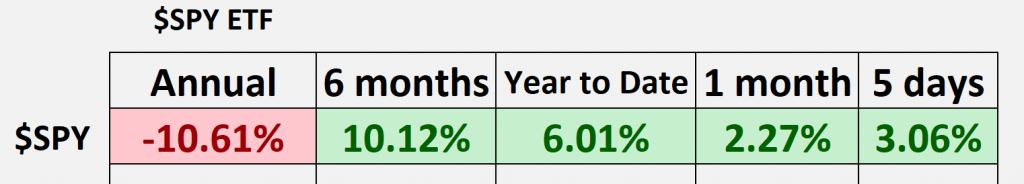
Before we jump into this though, let’s take a look at the broader markets over the past rolling 12 month period. We’re actually down almost 11%. But what we’ve seen here is over the past six month and year to date period, markets are actually up about 10%. Well, what’s really happened is there’s been that recovery in January. And what this highlights is there’s been tremendous opportunities throughout the marketplace to get bullish exposure and start managing some of these opportunities.
Now, over the past five trading days, we’ve seen, we’ve had a really nice rally out of the SPY. And I want to highlight how traders can get ahead of that and understand what’s going on in the marketplace and within their portfolios. Here we have the SPY ETF. And we can see here that we have daily price action. Each one of these candles that you see represents a full and complete trading day. And it’s right up against that price data that you see that there is a black and blue line value.
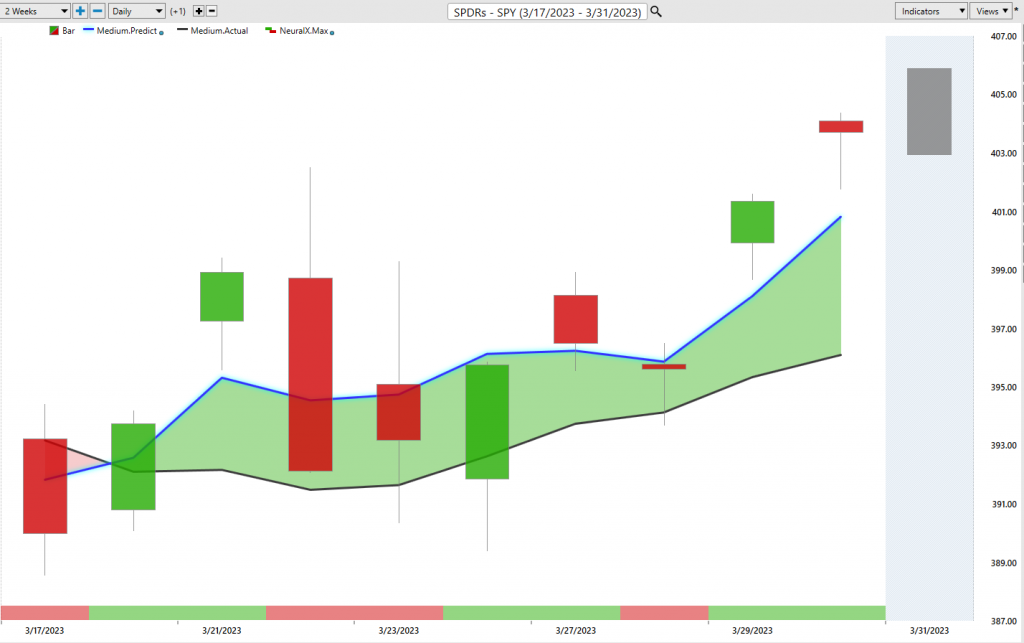
Now, that black moving average is actually a simple moving average. It’s a very common technical indicator. And in this case it’s just a 10 period simple moving average. It looks back at the last 10 closes, adds them all together and divides by that number. And that acts as a baseline and let’s you know where market prices have already been over a given period of time.
But what we’re able to do is actually compare that black moving average to this proprietary predicted moving average. And for this value to get plotted and calculated for the trader every evening, well this is where the technology of artificial neural networks come into play. And they’re performing what’s called intermarket analysis.
Now, what that really refers to is what is the data set that is used to generate these predictions? Well, the data is coming from those intermarket that are known to drive and influence future price. That’s going to be things like the futures market, like the S&P 500, E-Mini futures and the S&P 500 futures. As well as things like the value of the dollar index, global interest rates. There will be other ETF groups, inverse ETFs where hedging and things happen that can share relationships, all the way down to individual stocks, which may share some out-sized influence on the index.
But all this stuff is very important to take in and understand the subtle effects of some of these things. Some of these are positive relationships, some of them are inverse relationships. There may be leading or lagging relationships within that data. And that’s where artificial neural networks are excellent at solving these problems and generating highly accurate predictions.
What we do is whenever we see that blue line cross above the black line, it suggests average prices are going to start moving higher and you therefore, might want to think about taking on a long position. And we can see here that, well, since that has occurred, even through the volatility of the Fed announcement, the overall trend is up and we’ve gotten a nice move out of the S&P 500. But I want to dig into this a little bit more and really update even last week’s Hot Stocks Outlook because this is where this is so important of how this can help you adapt as a trader and make the most of these opportunities.
Every week we’re also provided a predicted high and low in addition to this bar at the bottom of the chart that goes from green to red and back to green. Well, this solve other problems for the trader, the neural index being very short term strength or weakness over the next 48-hour period. And the predicted high and low, well, being just that, a prediction of the next day’s high and low value.
And you see that when we look at the SPY ETF, we get a lot of that volatility from the Fed announcement, but what is the prediction for the next trading day? Well, it’s telling you expect the predicted high and low, this to be the range. You see, we close right in there. But it’s also saying expect weakness over the subsequent 48 hours of price action.
And what that alerts you to is that, okay, well, we may trade down towards these predicted lows as, well, but those would be great areas to go ahead and cover your position and get bullish exposure to the market. Which are essentially the same thing. If you’re covering shorts and going long, you’re putting on bullish exposure to the market one way or another.
But this is extremely important because this is last Friday. And so what you understand, and I make these on essentially Friday mornings before the market opens, is that this is exactly that. An excellent place to get bullish exposure to the marketplace into your portfolio. And we see that the SPY ETF from those predicted lows has had a tremendous move higher. 3.3% move is a really nice rally for the SPY ETF.
But I want to highlight again some more of these specifics about how these tools can help you regardless of how the portfolio is structured.
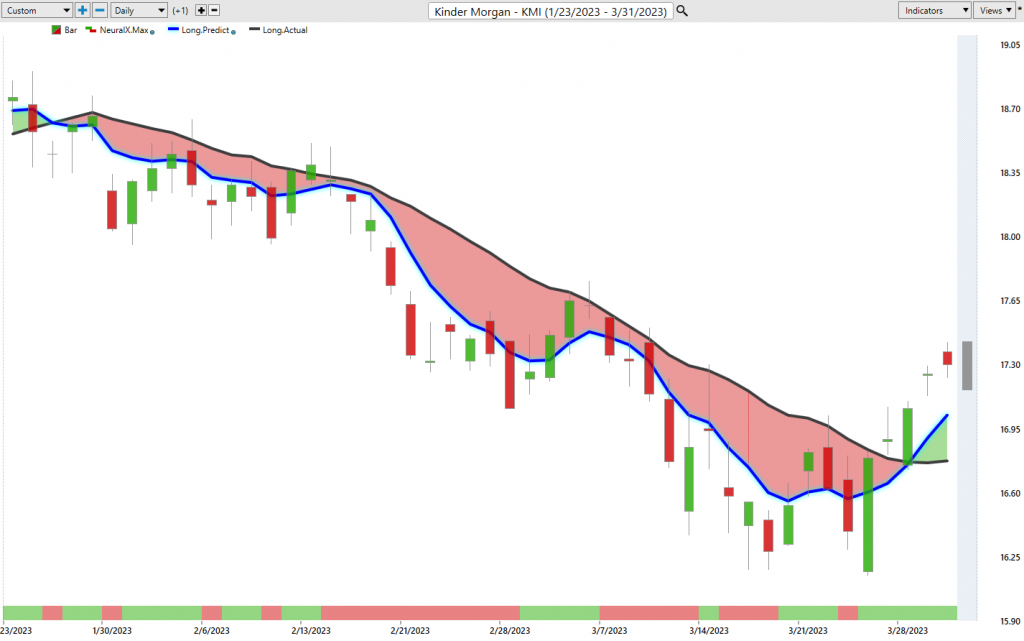
Here’s Kinder Morgan. It’s an energy stock. And again, we highlight a lot of this weakness coming in. Because you can use these tools to get bearish exposure. And when energy and oil is going lower, well, these are really nice entry prices to get some of that bearish exposure on.
But when the market starts to shift, you want to recognize that. And this again is, this is Friday. And you see just how effective that the market is still moving down to these predicted lows. The shorts can still be taking profit at those levels, looking to re-short at higher price levels.
But we also understand that the SPY is bullish here. It’s a great time to cover your positions. And if anything, we can always use vantagepoint to get confirmation and go long. And you see that you get those crosses to the bullish side. Now the neural index you see is very bullish actually over the entirety of that period overall.
And we see energy shares doing quite well. Well, that’s because we see these blue lines moving above the black line as far as the predicted moving average, not just in this specific case, where we got really great short-term forecasting here.
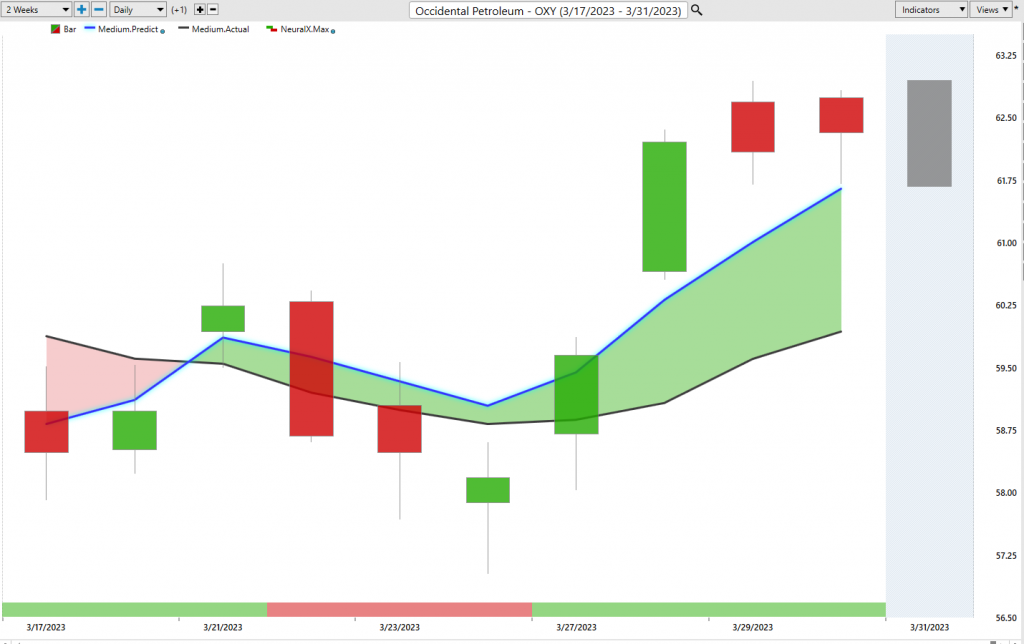
Here’s Occidental Petroleum. If you’re doing analysis on the energy space, well, you can understand that, well, Occidental’s holding up better than some of these other energy stocks. And if you’re looking for a place to buy, well, maybe utilizing the vantage point indicators here would be an effective way to go.
And you see, again, we get that volatility down towards these predicted lows, but they offer excellent entry points to certainly cover positions but also, potentially go long. And so here we see about an 8% move out of Occidental Petroleum just over the past five trading days.
Now, maybe you’re not trading the energy shares and you’re trading more Tesla.
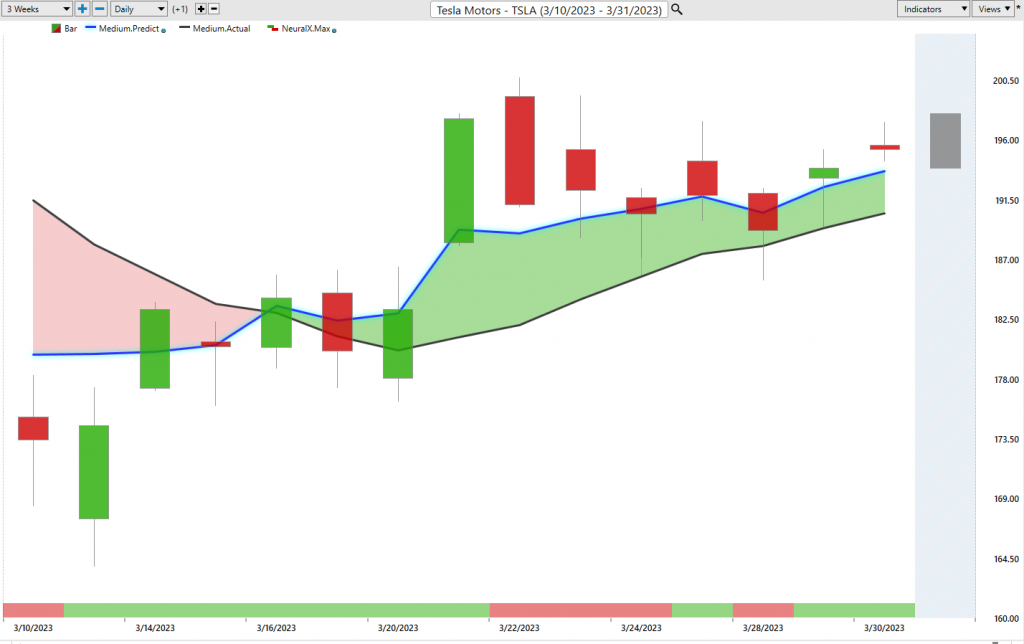
Here’s Tesla shares, and we can see that it’s been a few weeks, but we’ve gotten that blue line crossing above the black line. Shares had traded off about 18%. We highlighted that. But if you want to be a trader here again, you see that, okay, well, you see that line crossing above the black line? We can look at these predicted highs and lows that came through after that crossover.
And so your initial entries here can certainly be down here at, we got a predicted low here at 181. But even more recently, just this past week, we’ve seen that here about 188. There’s some predicted lows getting filled down here and then the market moving up again. Whether you’re trading in that longer term time period or looking to add to your position over the shorter term, these tools are extremely effective to help you understand, hey, there’s strength here. Hey, if I’m trading Tesla or energy shares or whatever it might be, what’s the most appropriate way to deal with this linked to the timeframe in which I’m going to put positioning on and run stop losses and risk management?
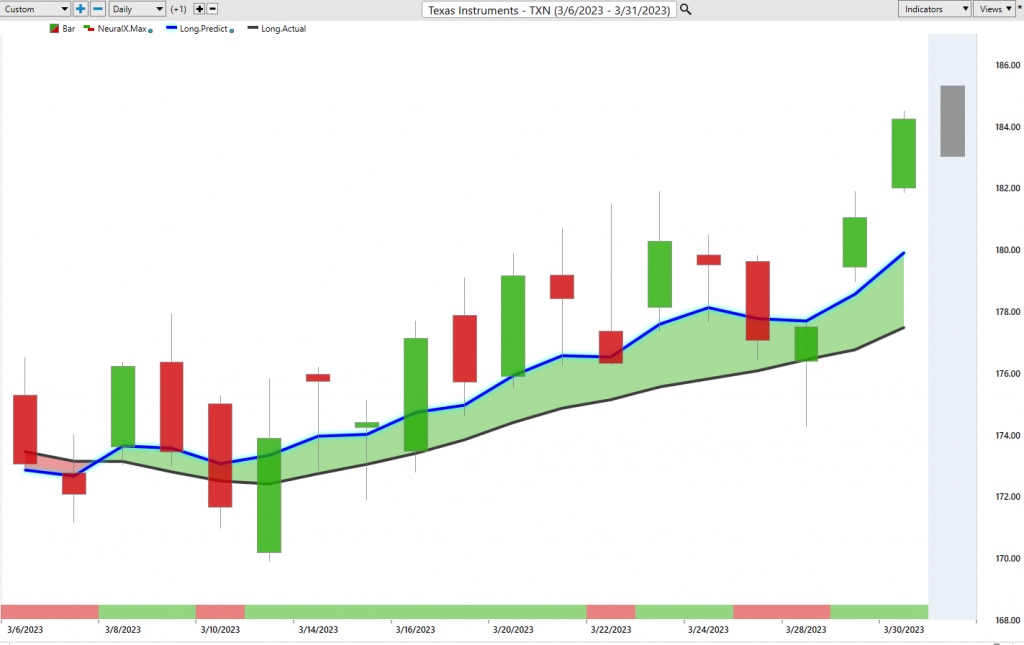
Here’s Texas Instruments. Last week, we looked at this as one of the bullish opportunities, and we can see that the overall trend is up. We get a little bit of volatility and some pullback here. But we can look and see, okay, well how can you be prepared for that and understand that where is this market potentially going to move?
Well, it’s letting you know, I mean, even after this trading day, it’s letting you know, expect these predicted highs and lows to start slanting lower. And then even more still, more aggressively, expect the predicted low to come all the way down here. But the overall trend is up. There’s strength in the SPY and the broader markets. And so if anything, that stands as a great area to add to your position. And we see that the market rallies and you get about a 5% move here.
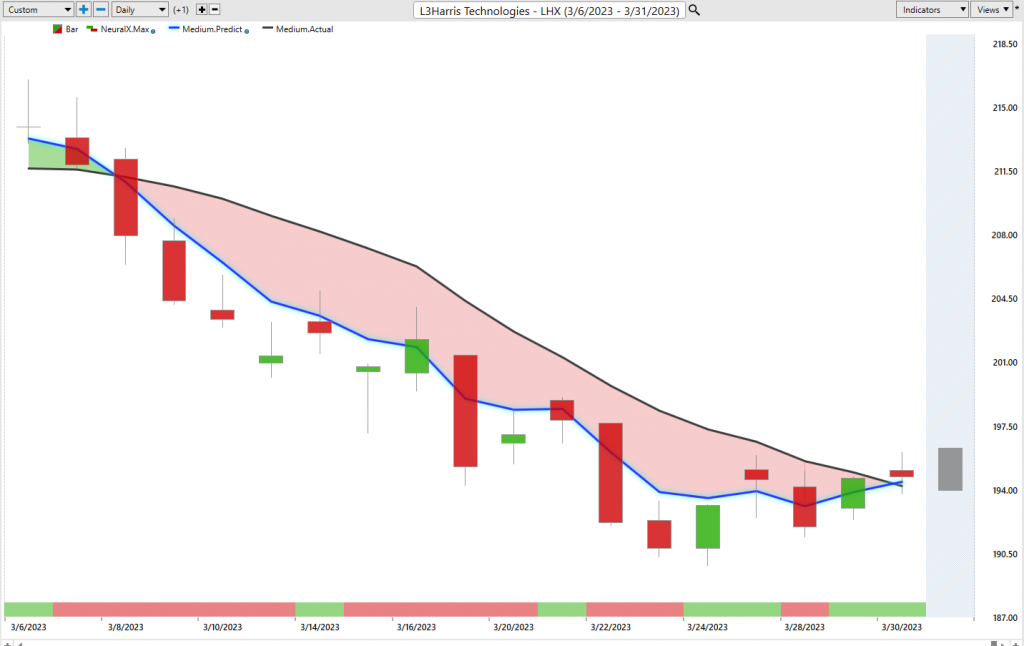
One of the areas that looked a little bit more weak based on the forecast are things like L3Harris. And you see that despite the strength in the market, we’ve finally gotten this crossover to the upside. But you see that even if you’re shorting taking profits on shorts here up until just the beginning of this week, there’s still been some entries up here where the market’s still struggling from those points. But clearly saying, “Look, don’t short anymore now that blue line is above the black line. And we may see if there’s more strength coming out of here.” But certainly, not the best place I think as we see certain areas further along in their trend and potentially more momentum on their side.
But this is again, just highlighting how effective these tools can be at helping you recognize what’s going on in the moment. And this was just an extremely important period where we make the Hot Stocks Outlook last week. You look at a mix of opportunities because there’s still markets moving lower over this time period. But there’s also some opportunities opening up.
And that’s where the tools can really help you refine where you’re getting entries, where you’re looking at things. And you never know if you’re going to get that huge rally, but certainly here already a 4% move and a 9% move just over the past 10 and three trading days respectively.
We’ll go ahead and leave it there for today. But once again, this has been the Hot Stocks Outlook for March 31st, 2023. Thank you all for watching. Best of luck and bye for now.