Register for a Free Live Training
The Hot Stocks Outlook uses VantagePoint’s market forecasts that are up to 87.4% accurate, demonstrating how traders can improve their timing and direction. In this week’s video, VantagePoint Software reviews forecasts for Chipotle ($CMG), SPY ETF ($SPY), TESLA ($TSLA), Caterpillar ($CAT), Netflix ($NFLX) and Amazon ($AMZN)
SPY ETF ($SPY)
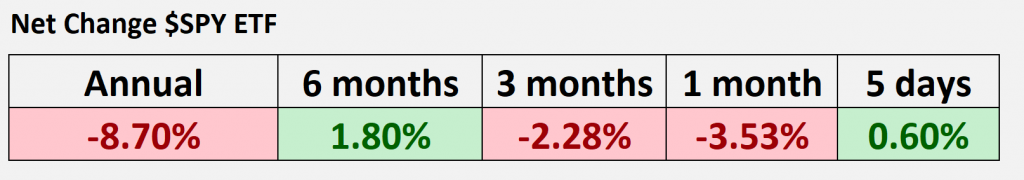
Hello again traders, and welcome back to the Hot Stocks Outlook for March 3rd, 2023. Hope y’all are having a excellent week out there in the financial markets. And as always, we have plenty to cover here in today’s Hot Stocks Outlook. So if you haven’t already, make sure you go ahead and click the link below. You can sign up for a live demonstration and learn more of the specifics about how this technology can really help you make better trading decisions day in and day out. So as we go ahead and look at the broader markets over the past year, we can see we’re actually down a little less than 9%, and things have really run flat over the past six, three, one month and even last week here.
And so I want to highlight some of the opportunities that we’ve looked at over the past few months as we really see a lot of that strength that had come in over the last quarter. But highlighting some of the mixed nature of things and how traders can get ahead of this, really make the most of the opportunities that they are participating in.
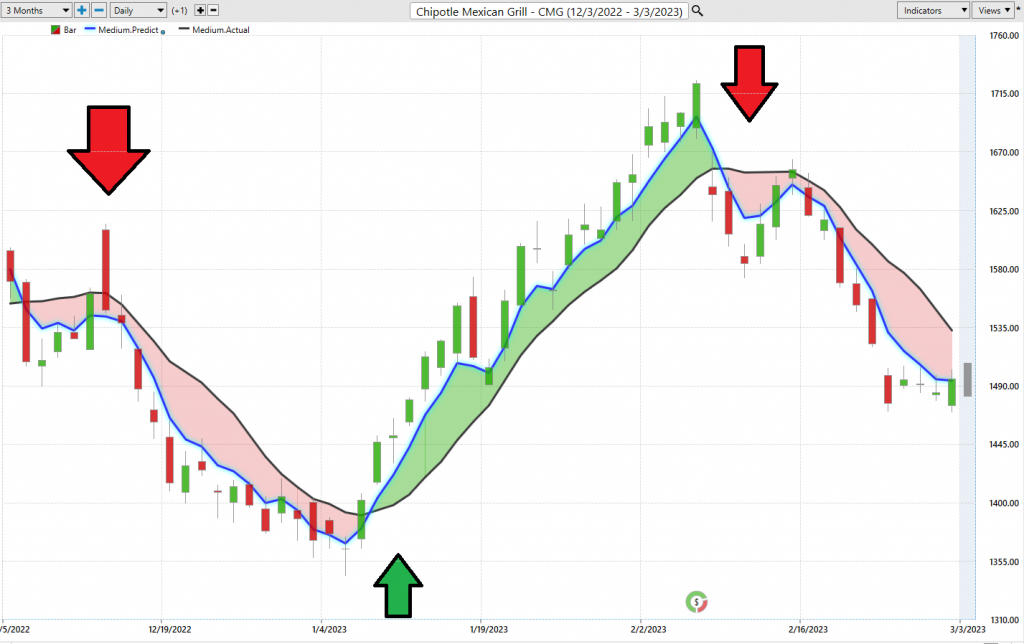
So here’s a really great example with Chipotle Mexican Grill. And so what we have here is daily price action. Each one of these candles that you see right up against the chart is a full and complete trading day. So that represents the entire trading day. And right up against all of that daily price action, what you see is that there is a black line and also a blue line there.
So the black line value that you’re seeing there, that is a simple moving average. So that’s a very common technical indicator. And in this case, what it’s doing is looking back over the previous 10 close prices and it’ll add those all together, divide by 10, and it smooths out the existing price action for us to let us know where the market has been over a given period of time. But traders need to be ahead of the next move in the marketplace. And so what we’re able to do is compare that lagging moving average to this proprietary predicted moving average. And for this blue line value to get plotted and calculated on the chart and really plotted on every single chart throughout the stock market to help you see these shifts in the marketplace, well, that’s where the technology of artificial neural networks is coming into play and performing what’s called intermarket analysis.
So specifically for Chipotle Mexican Grill, the artificial intelligence has recognized markets that are known to drive and influence the future price of this stock. And so what it’s able to do is look at things like, well, the S&P 500, the broader markets, certain ETF groups, all the way down to individual stocks, but then also on the interest rates or the value of the dollar index or global commodities like gold, oil. And so it’s taking all of this into account, and then using that overall global information to generate highly accurate price predictions that are then used to construct these indicators. So that’s allowing us to recognize these trend shifts very reliably in the marketplace.
And we see here with Chipotle, and this is what we saw with Amazon and Disney and all these stocks is, this is a very bullish period in the market. And you see that we got that crossover, the blue line over the black line. Each week we look at these predicted highs and lows. And so that’s what I’ve brought up on the screen. You get a prediction before each and every trading day of what the actual range will be. And you see, on the way up, you get really accurate levels to come in and accumulate a position. And what you see actually with this gap here is earnings.
And so a lot of stock traders ask about earnings, and the software can’t account for that earnings report that nobody knows about, but what artificial intelligence is really great at is taking in the new data. So understanding that all right, the market’s now closed here. Looking at all those inner market relationships and then adapting, right? Getting back on track and updating those forecasts. And so you see that that earnings report, just like with Amazon and other markets, really caused a shift in the marketplace and price.
But notice how accurate once this crossover moves to the downside, those predicted highs and lows now can be used in reverse to understand, look, get out of the market on the long side. It definitely would make sense. Or use it to actually go ahead and set a short position. And we’ve seen shares off now about 7 or 8% in Chipotle there after earnings. But it’s just very important to understand where this strength and weakness is coming in, again, about 8% decline there, and really how to use these tools collectively to help you make, again, the most out of each trading opportunity.
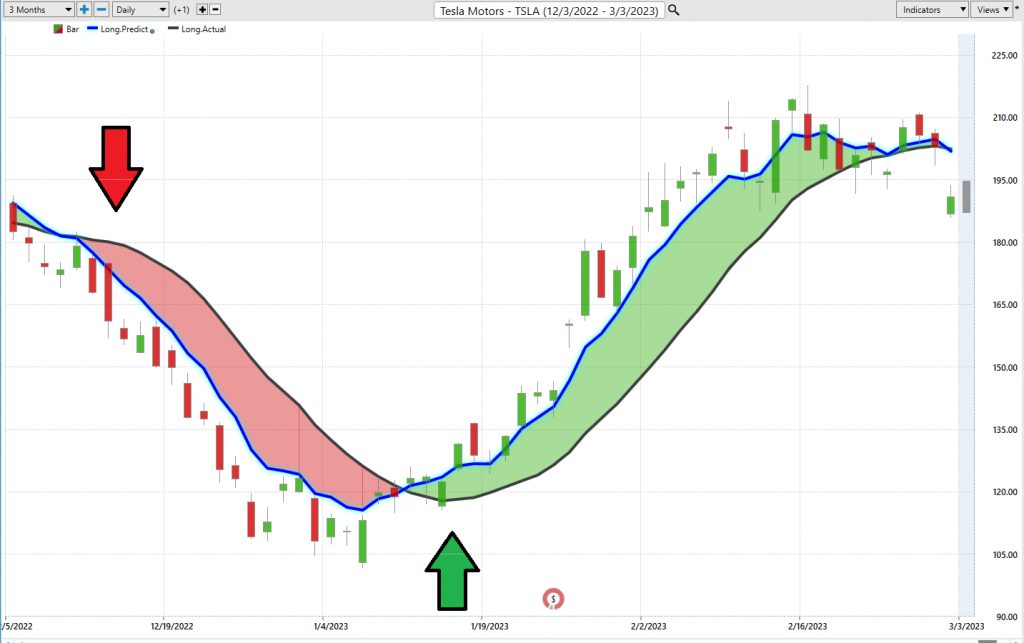
So now let’s go ahead and let’s move on to shares of Tesla. So I mean, we could go all the way back to, I mean, what would’ve been mid-January. Go back and watch those forecasts as Tesla was in a huge downtrend and we see this market reverse. And we really have an excellent predicted low, pretty much nailed right after that. But things have shifted here. And so we want to go ahead and update this forecast. And so if we go ahead and look at Tesla, we see most recently, actually after last week, we have this crossover to the downside. And this is what’s been very interesting about the market is, right? We had Amazon, Disney, Tesla, you see the chart for Chipotle, all this strength come into the marketplace that was very obvious to detect. And then we can use these tools to manage those opportunities. But we’re starting to see things run sideways.
And so here in Tesla, I know it actually looks a little bit wonky here, but actually this blue line never crosses above the black line. These values here remain below the black line value. But you are getting that sideways price actually with the Neural Index bullish, but the crossover the downside, but you see here how the blue line skews to the downside and we hat that gap down yesterday and some weakness there. And again, so as far as just crossover to crossover, keeping things very simple as far as the VantagePoint forecast, just 72% move there in Tesla from crossover to crossover, uptrend to downtrend here.
And then, as we reverse that logic, well, if you’ve come in and are willing to go ahead and take a short position, well, actually see that these are the levels that we’ve been standing out to go ahead and take some short positions. We see we get this gap up, but you’re just gapping up to that previous predicted high level. And then, of course, seeing that market move a little bit lower there. So really interesting stuff and a really exciting move there about that 72% rally. But we saw the exact same thing in shares of Meta, right? Seeing the market have a huge rally about a 50% move up, but recognizing things have shifted here, get defensive and pay attention.
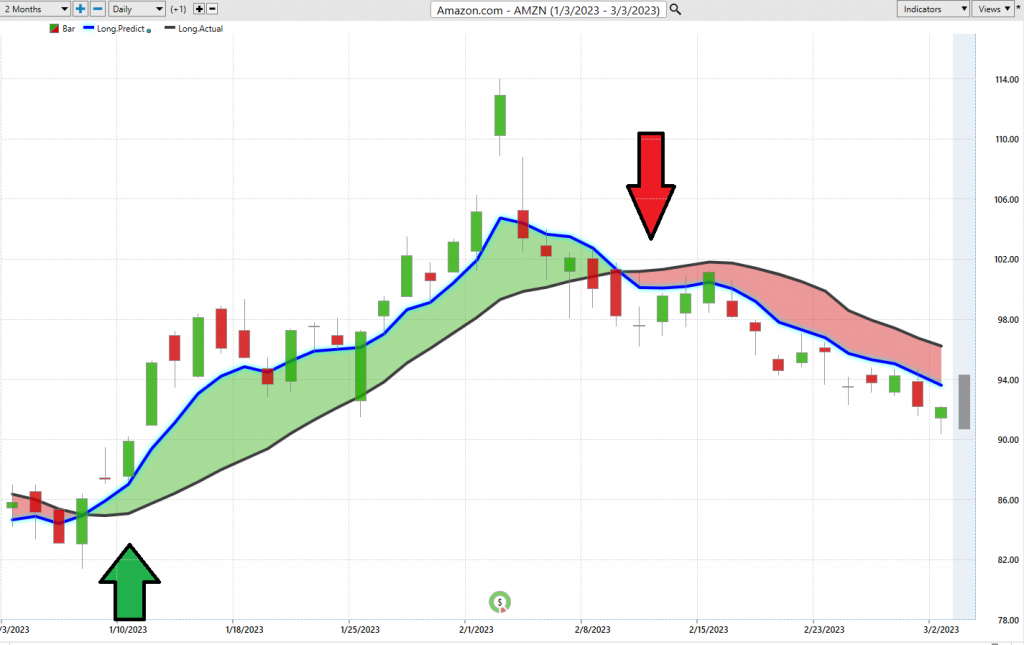
So here’s shares of Amazon. And we looked at this as this crossover is moved to the downside. So it’s so important to recognize, hey, if the markets are still down, well, those forecasts are going to help guide you to make the most of this. And so here’s last week where we were looking at, okay, well what is the guidance from the VantagePoint software? Well, keep shorting the market, take profits on shorts, and we see as Amazon has just continued to sell off from these predicted high levels and move down to those predicted lows.
And so what you’re seeing at the very bottom of the chart here, right? So we’ve got this VantagePoint predicted moving average, we’ve got our predicted highs and lows. Well, what you have at the very bottom of the chart is a very short term forecasting tool that’s really meant to solve a different problem for the trader, really solving short term strength or weakness over the next 48 hours. Or you can think of that as the subsequent 48 hours or couple candles of price action. And so this is what allows traders to really not get fooled by short-term blips in the market. So seeing that crossover moved to the downside, we’ll get that Neural Index going up and letting you know that, “Hey, if you want to short here, you might want to short at higher prices.” And of course you’ve got the guidance of predicted highs and lows to help you where you might want to look for those higher prices.
But again, you see here as that Neural Index goes bullish, market starts to run sideways, but you still don’t want to be getting long here. And you see the market tends to skew down towards these predicted low levels. And again, helping traders create that hedge portfolio, right? Understanding where might you want to be long, where do you want to be short, and how do you want to adjust things?
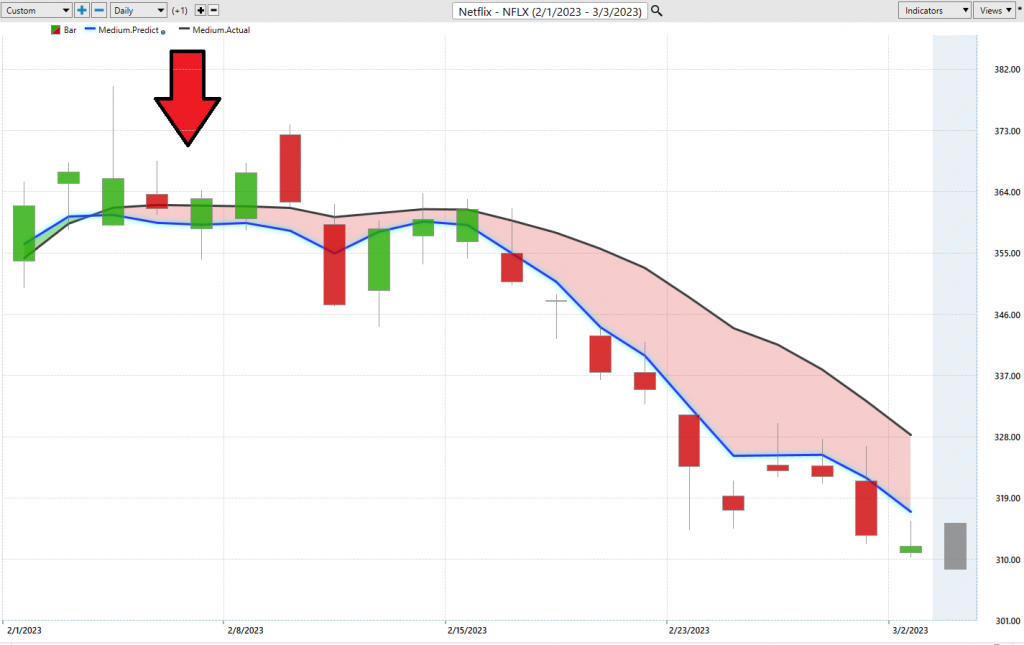
Netflix, another market that we looked at. Again, highlighting where you get these sideways movements in price. It looks like Tesla, right, where you want to be really careful, as price runs sideways, it may give way to a bigger move. And so we looked at Netflix a couple of weeks ago, really highlighting that sideways price action, but also recognizing that this is a weak market and we’re not seeing that blue line cross above the black line in any way, shape or form. And here we’ve seen shares decline still.
So even as that momentum picks up, you see those predicted highs and lows do a really great job here of offering levels as where is the trader looking to short, take profits on shorts. And I’m just bringing this through. Sometimes, we get days like this where you see all the price action takes here on this Friday, but it just gaps up on the Monday and then continues its move lower. And very clearly, using this approach, only going short, take profits on shorts, very, very bearish forecast here in shares of Netflix. When we take a look at the overall move here, share is down about 14% in just the past 19 trading days. Most of that happening just over the past couple of weeks here.
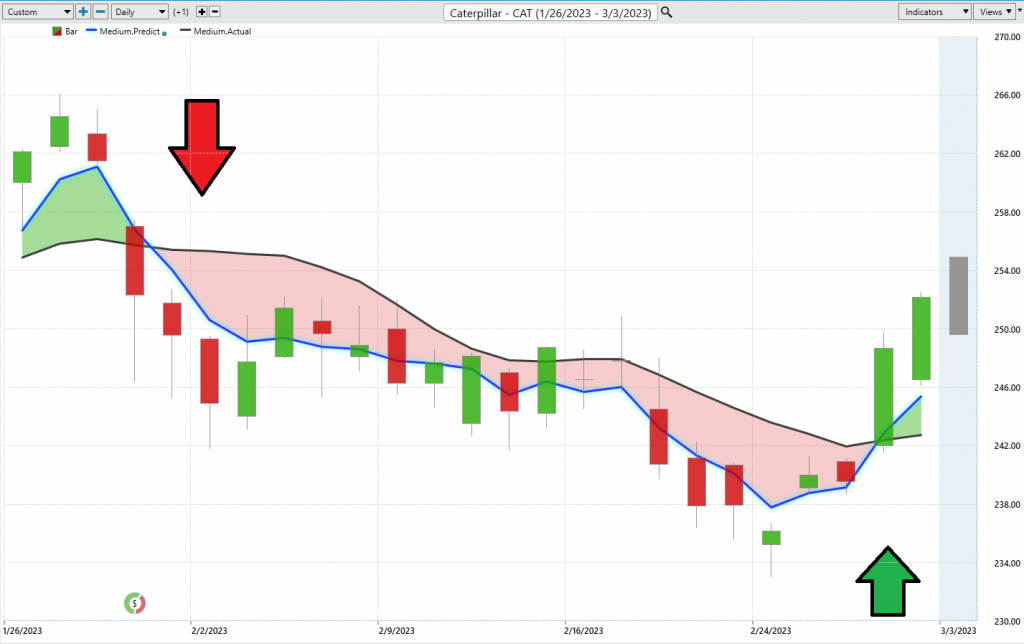
And lastly, I wanted to bring in Caterpillar, because we’ve looked at this over the past few weeks as well. And it does a really excellent job with these predicted high and low forecasts as the market moves lower. But Caterpillar is one of these stocks that I’m bringing through even to highlight that you might not want to short here, but we’re just seeing broad base weakness wherever you look, right? The tech stocks, Amazon, the Chipotle, there is a Tesla rollover. But here we actually see this crossover to the upside. And I’m bringing this through to highlight just the very mixed nature of things, and also how adaptive the forecasts are.
So where do you want to be looking for strength, where do you want to look to stay short or potentially express that weakness, but also understanding where do you want to look for things to potentially be shifting? And here you see Caterpillar, actually Wednesday evening, seeing that crossover to the upside. And look how accurate these predicted high and low forecasts have already been. So I know this is a pretty jarring day, but a lot of strength from the Neural Index highlighting, expect some strength coming in, huge move. And then here, already almost a perfect day trade where if you’re ready to buy there, the market moves up and hits that predicted high. And again, highlighting something interesting going on in Caterpillar.
But what you really want is the ability to see where these shifts are. How important is it to understand, hey, Tesla’s starting to move to the upside in mid-January, and also, it’s shifted to the downside? Here recently with Caterpillar. And this is where tools like VantagePoint and Telescan can really bring these fresh signals to the trader’s attention as soon as they occur, so you’re able to recognize these shifts, adjust the portfolio, and really make the most of things as volatility and, like I said, we have a very mixed nature in the market, we may see things go much higher on the individual stock level, things go much lower, and the indexes be really quite a mixed picture here.
So you want to be careful, but of course, have these tools to guide you here. So I’ll leave it there. Once again, this has been the Hot Stocks Outlook for March 3rd, 2023. Thank you all for watching. Best of luck. And bye for now.