


Register for a Free Live Training
The Hot Stocks Outlook uses VantagePoint’s market forecasts that are up to 87.4% accurate, demonstrating how traders can improve their timing and direction. In this week’s video, VantagePoint Software reviews forecasts for SPDR SPY($SPY), Discover Financial Services ($DFS), eXp World Holdings ($EXPI), Goodyear Tire ($GT), Carnival Corp ($CCL), $HF Sinclair (DINO), Netflix ($NFLX), Tesla ($TSLA).
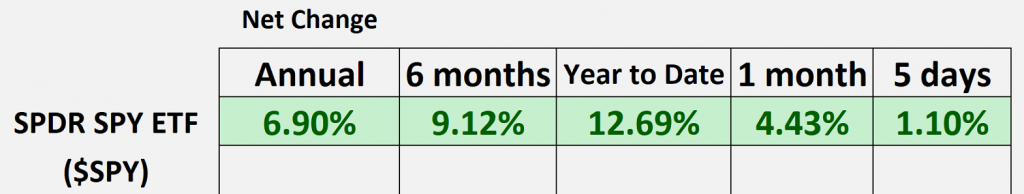
SPDR SPY ETF ($SPY)
Hello again traders and welcome back to the Hot Stocks Outlook for June 9th, 2023. Hope y’all are having a excellent week out there in the financial markets. And as always, we’ve got plenty to cover and there are tremendously exciting things going on in the financial markets. So want to go ahead and update these four forecasts for you. But if you haven’t already, make sure you go ahead and click on the link in the description below and you can get a live demonstration to learn more of the specifics about how this technology can really help you out making better trading decisions in the marketplace.
So as we typically do, we start out with shares of the SPY ETF. We can see the most recent forecast here. But as we look pack back over the past year, well, we can see we’re up about 7% over the rolling 12-month period. Over six months, about 9. We’ve had that really nice rally at the beginning of the year and things are really starting to perk up. Over the past five days, only up about 1, but there’s a lot of interesting things going on out there and a lot of really nice opportunities opening up.
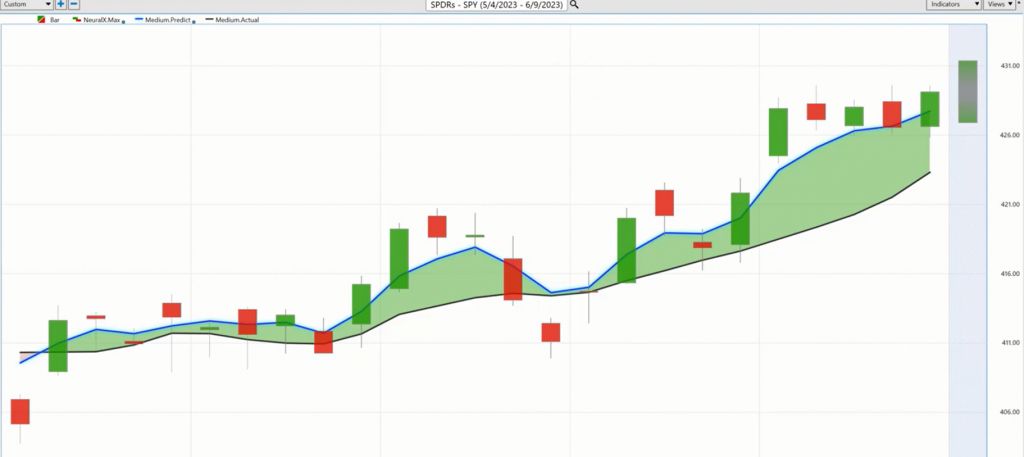
Discover Financial Services ($DFS)
So let’s go ahead and jump into it and really highlight where this is all going on. And a really great example of how all these tools work here in Discover Financial Services. And so what we have here with Discover is daily price action. As always, each one of these candles represents a full and complete trading day. And so it’s right up against all that price data that you see, that there is a black line and a blue line value right up against the chart. And so what that black line value is, is actually it’s a simple moving average. It’s a very common technical indicator. And what you might think of that is it’s a lagging moving average, right? So a simple moving average will take all the data from the past. In this case it’s a 10-period simple moving average. It’ll add those all together, divide by 10.
And so what happens is you really smooth out the existing price action. So it lets traders know where market prices have been, but that’s because all that price data is coming from what’s already occurred. And so traders need to be ahead of that next move in the marketplace. And so what VantagePoint users are able to do is compare that black simple moving average to this proprietary predicted moving average. And so for this number, essentially a prediction of future average prices, for that to get plotted and calculated for the trader every evening, well, this is where the technology of artificial neural networks come into play and they’re performing what’s called intermarket analysis.
Now, if you understand anything about artificial neural networks, you know they need a lot of data to generate highly accurate predictions. Well, that’s where the intermarket analysis comes in. What we’ve identified is there’s known markets that can drive and influence the future price of Discover Financial Services. Well, that can be things like other individual stocks, things like financial ETFs in the financial space, obviously funds coming in and out of a lot of these groupings of shares and things like this. But it goes all the way down to things like the value of the dollar index, global interest rates, global commodities like oil and gold. We’ve had so many huge moves in the energy space and that’s causing a lot of disruption and really nice opportunities as well. But this is what happens is it’s taking all of this information and it understands how to fetter out those relationships, whether they be leading or lagging relationships, or they be positive or inverse correlations. And it’s using that information to generate these highly accurate predictions of future prices.
And so rather than having tools that always lag behind the market and really get dragged around by what’s occurred, now we have a forward-looking predictive tool. So whenever that blue line value crosses above the black line suggesting average prices are expected to move higher, and you’d want to go ahead and execute a long position or execute your strategy, whether that’s shorter, longer term timeframe.
But you see here shares up about 17% as that forecast remains very bullish over the past 18 trading days. And so what we do is we take a look at this full suite of VantagePoint indicators where you have the predicted high and low. So every day you’re provided an intraday range. So you can think of this as there’s really separate neural network solving these different problems where you have a predicted high, predicted low, the predicted moving average. And at the very bottom here we have our predicted neural index. So this being our 48-hour indicator, a very short-term strength or weakness in the market.
And so when we put all this together, we can see that, “Okay, well the blue line is clearly over the black line.” You may get these blips when we look at these forecasts where the neural index goes bearish, and you see how prices slip a little bit below that previous close. But the blue line’s still very much above the black line, and the trend resumed higher. And so this is the really exciting part is that, whether you’re a day trader or shorter term, maybe trading options, well when you understand, “Hey, this market’s going up,” we’ve got about a 17% rally, well every single day you’re provided a predicted low in this case, right? So it’s telling you where the market’s likely to move at the lower end of the daily range. And that’s where we can look back and say, “How accurate were all of those predictions against the market data?”
And so this is where traders have a huge edge in the marketplace, not only seeing those reversals very early and getting a early opportunity to get involved, but then having these intraday really adaptive technology tools to anticipate where this price is going to move and whether it’s going to continue going higher. So you see, you get a little bit of a froth and gap here, but you’re really just moving to the predicted low. We see that quite a bit. You see how the range updates and says, “Okay, well if you still want to be long, expect the market can trade down here, but the blue line still above the black line, so you’d only want to be a buyer, take profits on longs.” And we’ve seen just a really monster rally there in shares of Discover Financial.
But we look at these markets every single week. So we looked at Hess, well, we’re going to look at HF Sinclair, highlight some reversals and opportunities there. Tesla Motors, we’ll retake a look at that. But there’s been really exciting opportunities opening up all over the space.
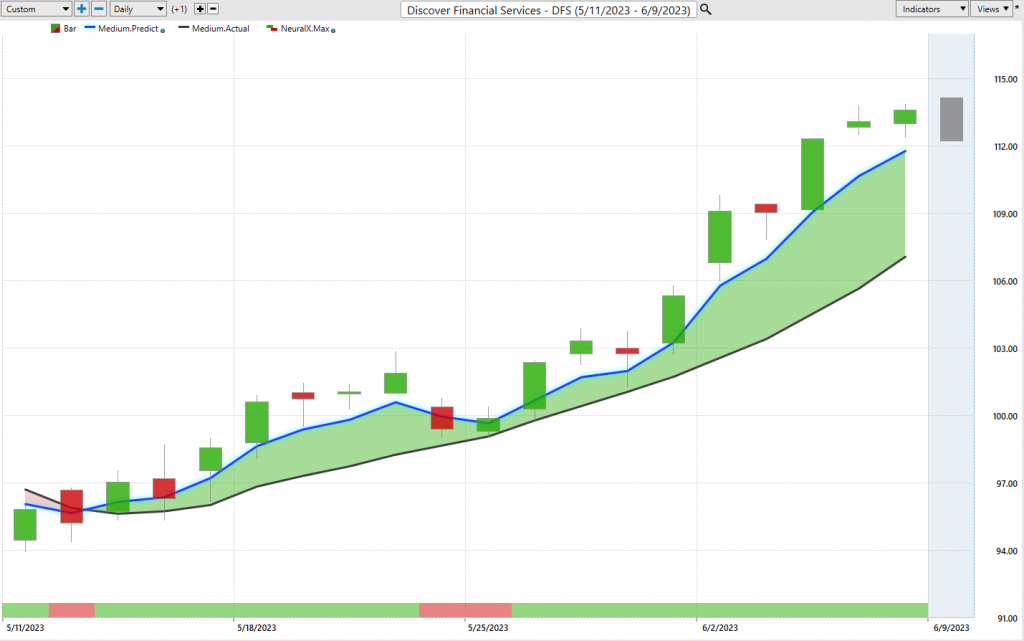
So here’s shares of eXp World Holdings, and again, daily price action. But what do you have? Blue line crossing above the black line. Look how bullish the neural index is through this period. But you will get those periods where you get a little bit of sideways price action. You see those closes and moves below the most recent low or the close price as the market drifts forward over that 48 hour period. But when we bring up these predicted highs and lows and say, “Okay, well if you’re looking for intraday levels to accept prices over the course of this rally,” well nice entry here, nice entry here, nice entry here, here, maybe here. Pretty close there, there, there, there.
So we’ve got about 1, 2, 3, 4, 5, 6, 7, 8 instances where the VantagePoint-predicted low is hitting it pretty much right on the mark in an existing uptrend where the market is really poised to rally. So the trend trader can recognize this shift very early in the market, and we see here shares up about 77%. But even if you’re recognizing, “Okay, something’s going on eXp here. Well, where should I be looking to accumulate a position?” Whether that’s over a weekly or daily basis, you want to be getting in on the better part of that range. So we see here again, just over the past couple of weeks, where do you want to be looking? Well, down towards the predicted lows to scoop up shares at better value. And you see earlier, if we just want to look over the past couple weeks here, you’ve gotten this monster rally just from these most recent predicted lows, about a 33% move over just eight trading days.
Now I always like bringing in some bearish opportunities because there’s a lot of bullishness out there. There’s definitely some areas where you can go ahead and get long. But it’d be a shame to get long in the wrong areas of the marketplace and not even get a benefit as we see shares going higher in markets doing very well.
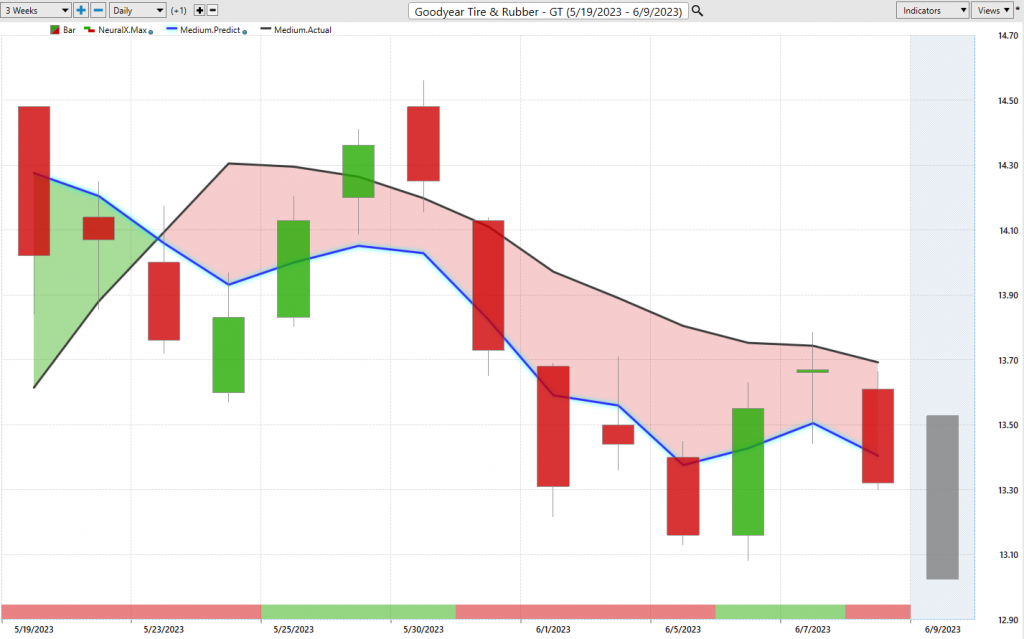
Here’s shares of Goodyear Tire and Rubber, and let’s just reverse that whole logic. Blue line below the black line. Neural index bearish. But you’ll notice here that the neural index gets bullish, you’ll get some strength of the subsequent 48 hours, but is this a market where you want to be long? This week, is this a market where you want to be buying on the dip and looking for lower prices to be a bull? Well, no. I mean if anything, you can set up a short to compliment the long opportunities that may be in the portfolio.
But all this is telling you is, “Short up at these predicted highs.” You see this adaptive forecast saying, “Expect the range to come up a little bit,” but then it says, “Okay, well you’re moving lower, move towards these predicted highs, but to short and take profits on short.” So not a huge move there. You’re not too bad, about 14 down to about $13 per share in Goodyear Tire here. But this is what’s critically important about this is there’s a lot of really interesting things going on and it seems like some new opportunities opening up that… Like eXp, tremendous percentage returns opening up here. So this is what we really want to be aware of.
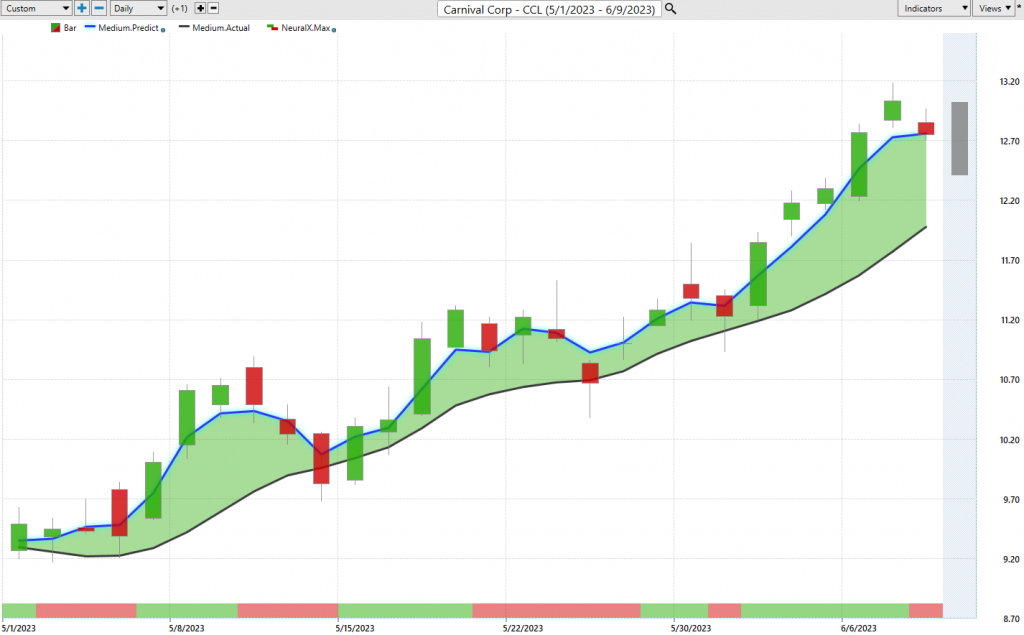
Here at Carnival Corporation. Same logic here, blue line over black line. And you’ll notice that the neural index goes bearish here, and you’ll see that, well actually over 48 hours later you get some lower prices than the close there. But the overall trend is still up. You actually see the separation of that predicted moving average just getting stronger and stronger as we move forward here. And through the duration it remains above that black line. So you will get, again, these blips where the neural index gets bearish. You get those moves below the most recent close prices. But this is where this adaptive technology is really going to help you out and say, “Okay, well you can expect those lower prices,” but you literally have the level ahead of time letting you know, “Look down here,” right? You see here on this most recent forecast that the range is slanting lower saying, “Look down, expect the market to move lower,” if you want to accumulate a position, which you see allows a lot of these entries to be at much better prices before we start to advance this past week and really see things move higher here.
So again, Carnival Corporation, really nice opportunity here in the cruise lines, really as a sector doing pretty well here, 36% rally over the past 27 trading days.
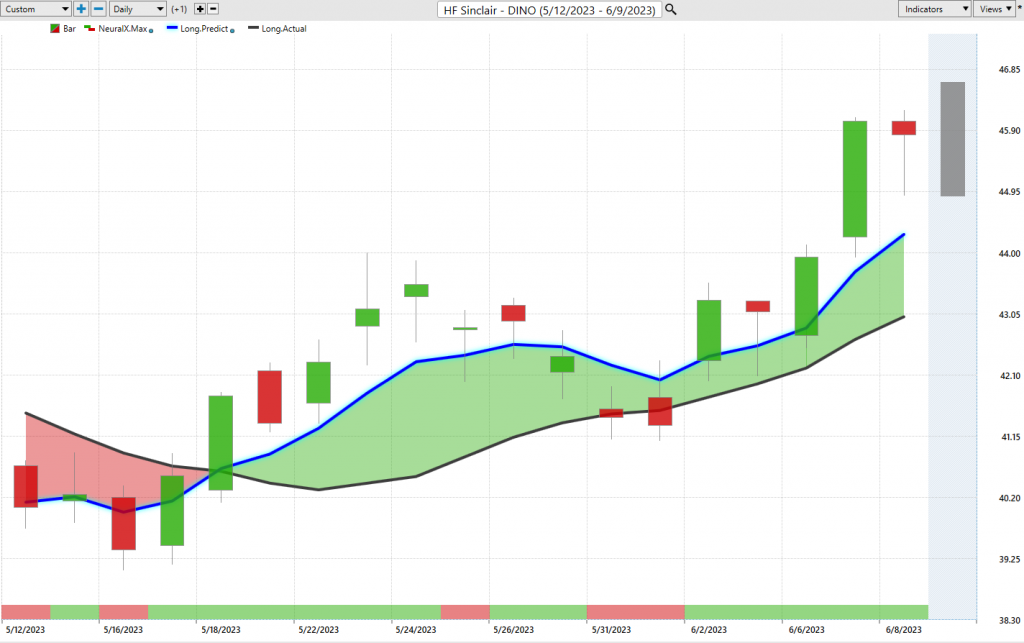
We’ve been looking at energy and Hess week after week, because over the past several weak periods energies have been very weak. You look at the commodity and it’s been very chaotic. They’re not a great place to trade. But there’s something different going on in the refining space around energies. And when you look at RBOB, essentially gasoline contracts, those are holding up quite well. But here’s actually HF Sinclair, and this is actually after Friday’s price action from last week. So I make these videos on Thursday. We had a nice move in energy, but I think it’s more confined to some of these refineries. And so here you see that blue line crossing above the black line, setting up exactly the same logic. Ideally look towards VantagePoint’s subsequent predicted lows to accumulate a position.
And so you see here, HAL moved down to this predicted low, about 42.40. Even yesterday, getting this move lower in a nice little bounce with the neural index. Still bullish here. So again, some really interesting things going on in the energy space, but this is just over a very short period of time, just the past four trading days. And we see, again, getting that clues that something shifted in energies here. As far as the stocks go, well, you may want to actually go long. And we actually did have a crossover on Hess. So we actually seen reversal, right? You have the blue line cross above the black line, hit the neural index, move higher. We just saw that out of the energy space this week, just highlighting that really would’ve seen that pretty early going into the week, highlighting that a lot of these refinery companies starting to move higher here.
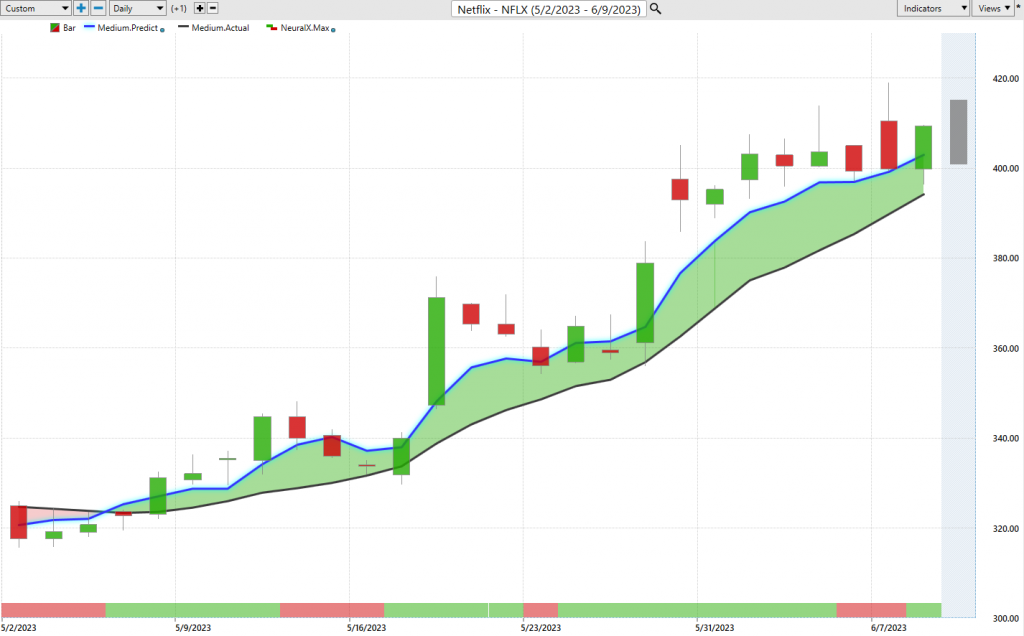
Shares of Netflix, some of these more popular shares, cross over blue line over black line. What’s been going on over the past couple weeks? Well, it’s bullishness, right? The very bullish forecast, neural index fairly bullish here. And we can bring up those predicted highs and lows. And again, you see over the course of this move, highlighting very nice places of value to go ahead and scoop up shares of Netflix if you want to go ahead and be a buyer. And you even see yesterday moving down to 400 and advancing up towards the predicted high. So whether you’re a day trader, whether you’re a longer term swing trader, you can utilize these tools to understand, “Hey, Netflix is bullish over the longer term.” And then we can use the shorter term forecast to keep adjusting that position, potentially adding to it, taking pieces out of the market as we go up about 25% over the past 23 trading days.
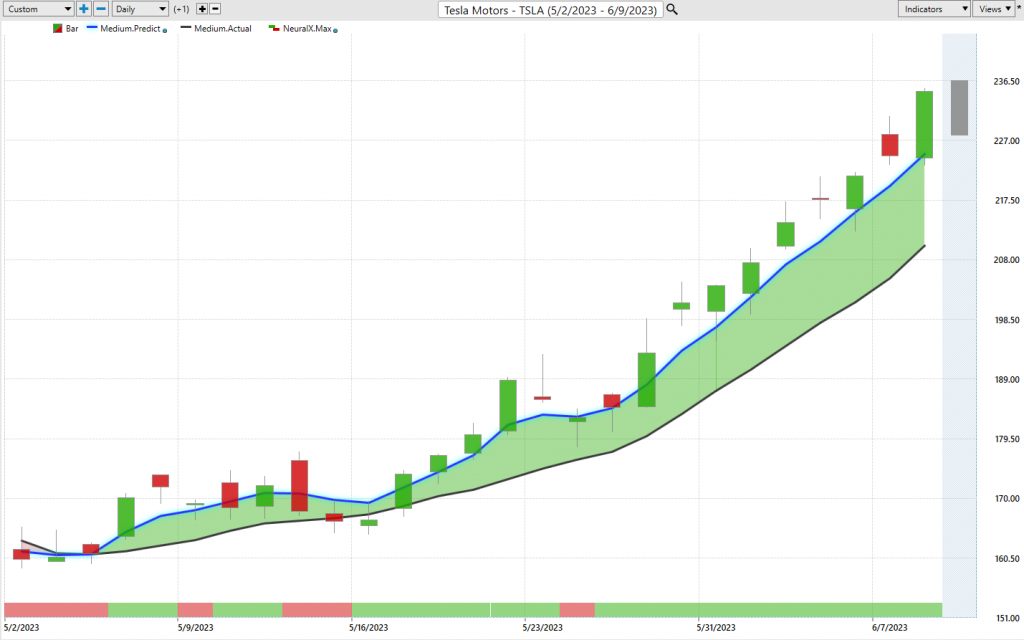
Lastly, come back to most recent forecasts of Tesla here. And again, getting that blue line crossing above the black line, little bit of sideways price action, you see that neural index. But look at all this strength over the past month here in shares of Tesla. So again, we can bring up the predicted highs and lows, and where are those very short term places of value to be scooping up a position. And you see these predicted lows just do a pretty phenomenal job of not only highlighting that level but then adapting, right? And this is really, the key is highlighting the level, but then understanding, “Look, things are shifting, things are getting really bullish here. Here’s where momentum’s coming in.”
I mean, you have had not even one blip of weakness out of Tesla over the past couple of weeks, and this has resulted in a really nice rally here as we see shares do really well. Just about 29% just in those 10 trading days since that forecast have been pretty decidedly bullish here. So again, really exciting things going on in the marketplace. There’s been some shifts. It looks like a lot of companies, I mean really poised to have some exceptional percentage returns. But you really need the right tools to one, identify a lot of these shifts. That’s where tools like the Intelliscan come in, but then have the tools to manage those opportunities as the trade progresses. And that’s really what takes things up a notch.
So once again, this has been our Hot Stocks Outlook for June 9th, 2023. Thank you all for watching. Best of luck out there and bye for now.


