Register for a Free Live Training
The Hot Stocks Outlook uses VantagePoint’s market forecasts that are up to 87.4% accurate, demonstrating how traders can improve their timing and direction. In this week’s video, VantagePoint Software reviews forecasts for SPDR SPY($SPY), Dell ($DELL), West Pharmaceutical Services ($WST), Waste Management ($WM), Skechers($SKX), Apple ($AAPL). Xencor ($XNCR)
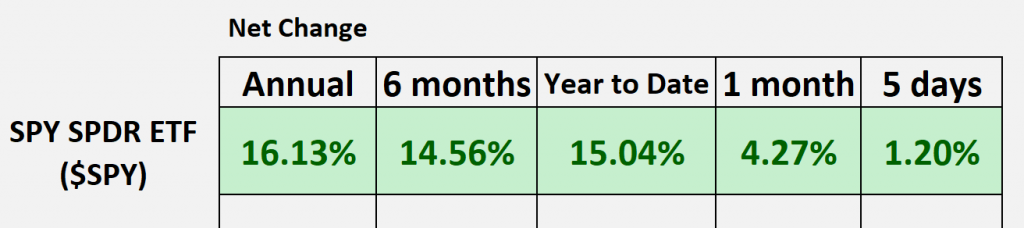
SPDR SPY ETF ($SPY)
Hello again traders and welcome back to the Hot Stocks Outlook for June 30th, 2023. Hope y’all are having a excellent week out there in the financial markets. As always, we’ve got a ton to look at in this week’s Hot Stocks Outlook. So if you haven’t already, make sure you go ahead and click on that link in the description below and you can sign up to get a live demonstration and learn more of the specifics about how this really suite of predictive indicators really help you make better trading decisions day in and day out in the marketplace.
So as we typically do, let’s start out by looking at the broader markets here, and we can look back and say, “Okay, well over the past year period we’re up about 16%, same for six months, and really the year to date mark.” And really just what I wanted to highlight is really last week sort of mentioned that, all right, well we may see some volatility for the range expand and it’s really why it’s critical to be positioned in the right stocks because we have seen a lot of markets pull back, but other things holding up quite well.
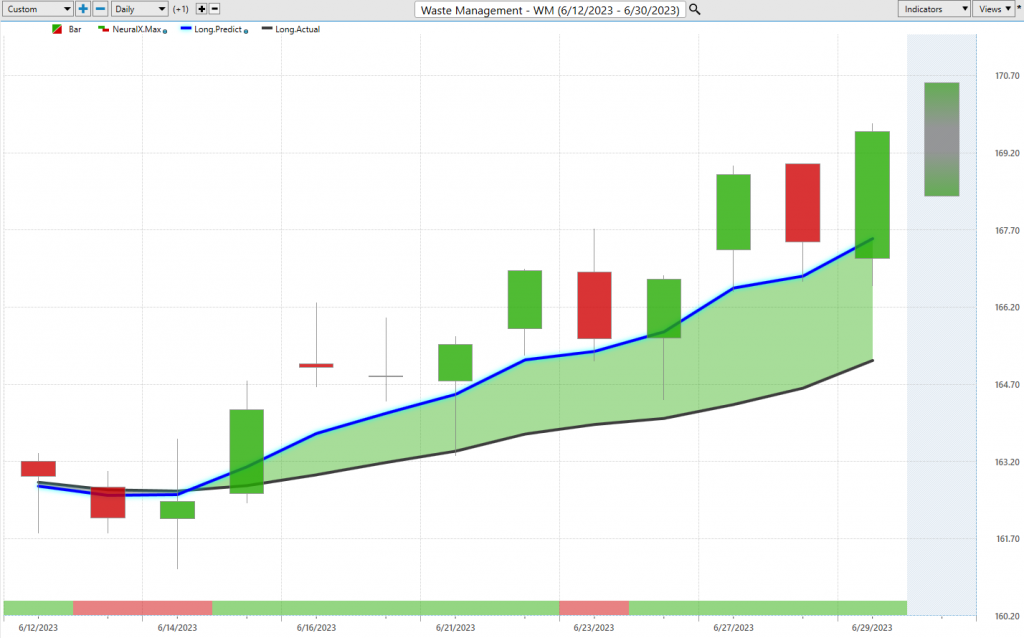
And so let’s go ahead. We can start out with this first forecast with waste management and all of these forecasts works exactly the same way, right? It’s exact same indicators on each one of these charts. And so what you’re seeing on this chart of waste management is daily price action. So each one of those candles represents a full and complete trading day, and it’s right up against that price data that you’re going to notice that there is a black line value and also a blue line value. So the black line that you’re seeing there, that is actually a simple moving average or what we refer to as the actual moving average. And this is a very common technical indicator. And in this case, what it does is just look back over the previous 10 closes. It’ll add all those price closes together, divide by that number. And what we get is a nice smoothed out rolling visualization of where the market price has been over a given period of time, but obviously the savvy trader needs to be ahead of that move in the marketplace.
And so what we’re able to do is compare that black or what you might call a lagging moving average to this VantagePoint proprietary predicted moving average. And so for this value to get plotted and really calculated and then plotted on the chart every evening for traders, well this is where the technology of artificial neural networks come into place and they’re performing what you would call intermarket analysis. So this is very important because if you’ve learned anything about artificial intelligence, well you understand that you need to feed them data so that they can make sense of that data and then generate highly accurate predictions.
So essentially what the data that we’re using to generate forecast for the future price of waste management are all the markets that are known to drive and influence the future price of waste management shares. So this can be pretty obvious things like, “Hey, what is the S&P 500 doing? Maybe what is the value of the dollar index doing,” but it goes all the way through the markets looking at ETF groups, looking at other individual stocks, potentially looking at big commodity markets like the gold or silver or crude oil market. And so it’s taking this global approach, looking at all these extremely important markets specifically to the market that you’re trading, and then it’s generating extremely accurate price predictions with that data. So it’s those price predictions that the software is generating that is used to calculate and then plot these indicators.
So you take what is traditional technical analysis, which is really just lagging tools, reformulating what’s already occurred in the market to now what we have is a forward-looking predictive set of tools. And so whenever we see that blue line cross above the black line, it’s suggesting average prices are going to start moving higher. So a trend trader can say, “Okay, well there’s potentially been a shift here. Let me go in with my money management strategies and start executing that directional trading.” So you see here we’ve got about a 3% move. Waste management isn’t going to move an awful lot, but I want to highlight how all of these indicators really work together to round out that forecast. So when we come to the very bottom of the chart here, you’ll see that there’s a bar here that goes from green to red and back to green.
Well, this is updated again every evening after the trading day at around 6:00 PM at night. And what it’s doing is forecasting short-term strength or weakness, but just over the next 48 hours. So we have a very accurate view of average prices with that predicted moving average generated via the technology. But we also have a highly accurate short-term for forecasting tool via this neural index. And so again, where it’s really helpful is you’ll notice that here where that neural index goes bearish, you’ll sometimes seen some subsequent price action below that recent close, expect weakness over the next 48 hours. But if the blue line as you see here really well above the black line and even separating more is still above that level, well the overall trend is up. So you get that good view of when those trend shifts have occurred. And we can actually use features like VantagePoint’s and Telescan actually present it and see these things right as they occur each evening.
We’ve got our short term forecasting with the neural index for that 48 hour view, but then we’re also provided a predicted high and a predicted low. So you’ve got all these different neural networks working to solve this problem, right? The future average prices for your moving average, you’ve got your neural index, essentially a yes/no forecast, and then you’ve got a separate set of tools picking out a intraday predicted high and an intraday predicted low to help traders fine tune those entries and profit targets. So then when we take a step back and say, “Okay, well how accurate were all of those predictions knowing we’re in an uptrend here, how accurate were all those daily predicted lows?” And you can see how effective this is. You’re able to accumulate a position, maybe take some profit as we move to these earlier profit targets, but then again, just buy back in and make the most of these trading opportunities as the market keeps moving higher.
So in this case so far, only have about three or 4%, but how many chunks of the market and how big of a position may you been able to build and not have to take on aggressive amount of risk because you’re taking those pieces out of the market here.
West Pharmaceutical Services ($WST)
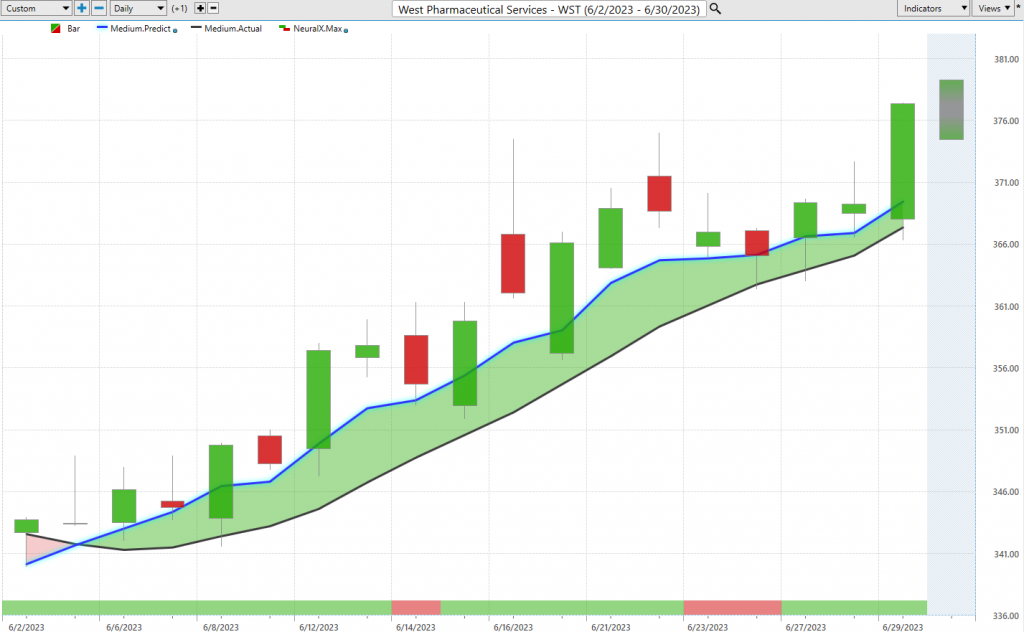
So with that understanding of how those tools work, well, let’s look at West Pharmaceutical Services. So this is a market we actually looked at really a few months ago because it was in a very strong downtrend. Well, the most recent forecast, we see that blue line crossing above the black line, neural index very bullish. So again, we can set a lot of those features with our scanning to really see right when these things occur. But you’ll notice that neural index gets bearish here. You get a little bit of a gap down again here, some lower lows over the next 48 hours, but the trend is very much to the upside here.
So day after day, you get that continued updated forecast that says, “Look, the overall trend is still up here.” You see over about 17 trading days, the market’s up nine and a half, almost 10% here, and we see this week really having a very nice week. But what’s so important here is depending on your trading style and approach, well maybe you’re a day trader, right? Maybe you recognize that, “Hey, this looks like a bullish market. Maybe I should be accumulating a position if I can get good entries down towards these VantagePoint predicted low levels.” And you see about 1, 2, 3, 4, 5, 6, excellent entries over the course of this market moving higher and higher about 10% over that 17 trading days.
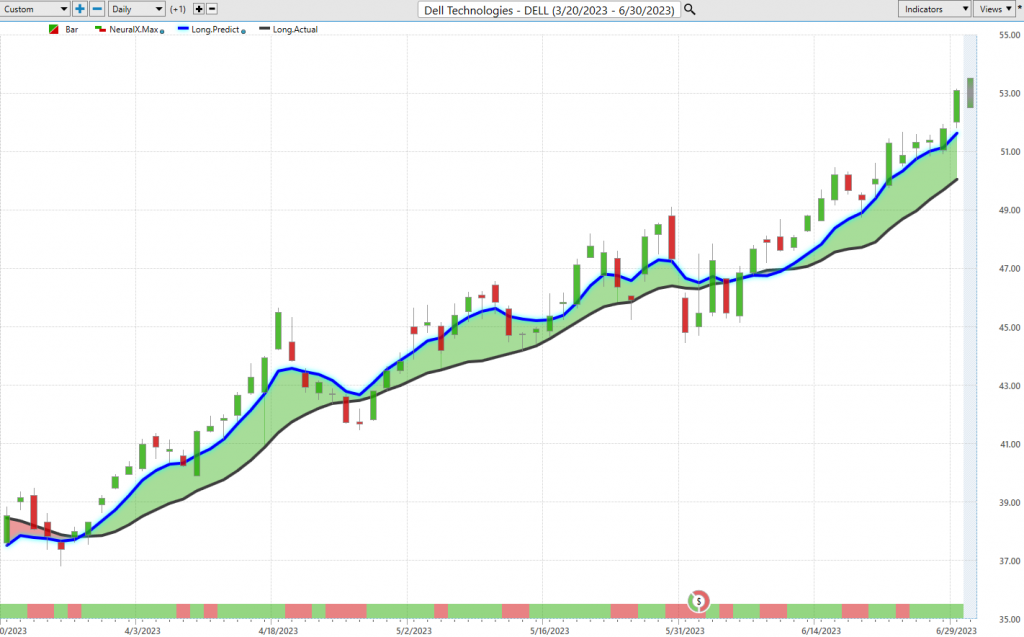
So again, Dell Technologies here, we have that blue line crossing above the black line. Since those forecasts have come through, again, we’ve got a lot of markets doing really well here, about a 13% rally in just 16 trading days.
But what you want to be aware of as a trader is, “Okay, well, is there likely to be some short term weakness in the market over these next 48 hours of trading?” We really want to be aware of that. So you’re not selling your position, but understand, “Hey, we need to wait awhile. Once that neural index gets bullish again, that’s where we should expect the trend to resume.” You see, the neural index goes bearish here, a little bit of sideways and weakness over the next couple of trading days, but the overall trend very much to the upside. You get one more blip here and then very quickly neural index bullish and the trend again resumes. So what you’ll notice is that when you get that trend along with the neural index, well that’s where you can really expect that momentum to heat up. Now, of course, when you bring in the predicted highs and lows, well that just takes everything up a notch and really helps you fine tune your entries.
And you see here, just last week, last five trading days, about three almost perfect entries into the market right before we get this really nice rally yesterday there on Thursday. So lastly here again, we’ll take one more look here at this move, Dell seeing a nice rally, 12 and a half over 16 trading days.
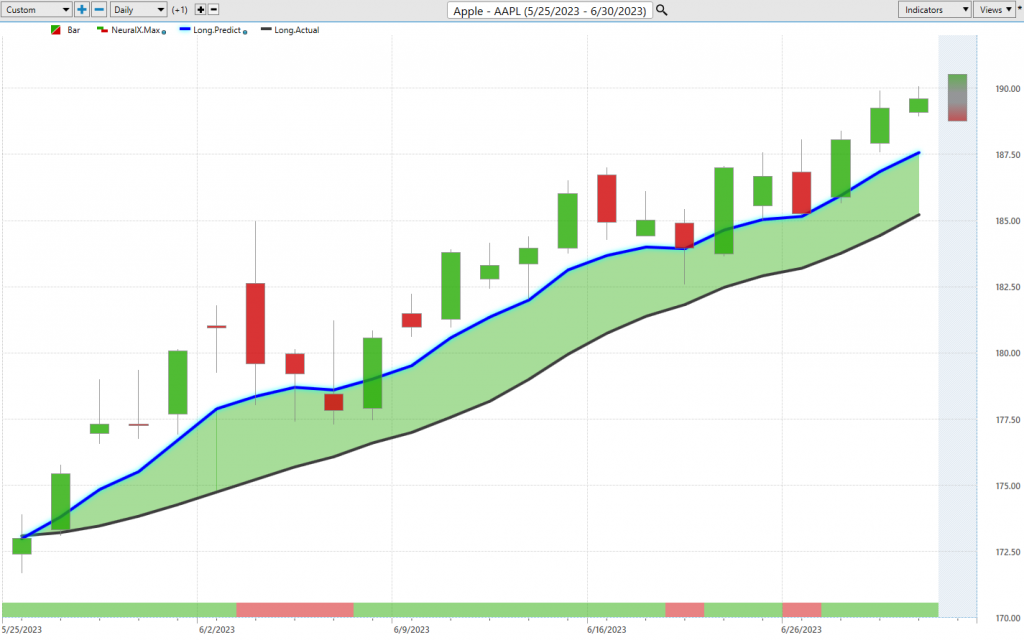
Now, last week we looked at really Apple, Amazon because you could kind of see some of that weakness coming into the marketplace. But when you have this forecast for Apple, you understand, it says, okay, well, we’re still very much in an uptrend here. We know that if the markets hold up at all, Apple will probably hold up pretty well. And then we can come in with tools like the predicted highs and lows. So even from just last week, I mean this is last week’s forecast, I make this with Thursday’s data, and there you go Friday, gap down market immediately moving higher.
And that’s taking us to where we currently are now going into this Friday’s open, but you see shares up about 2.2% just in those last five trading days with some opportunities again to take profit, maybe buy back at even lower prices from where you’re taking those profits in. Wanted to bring in this example of Sketchers just to highlight how look, markets are volatile.
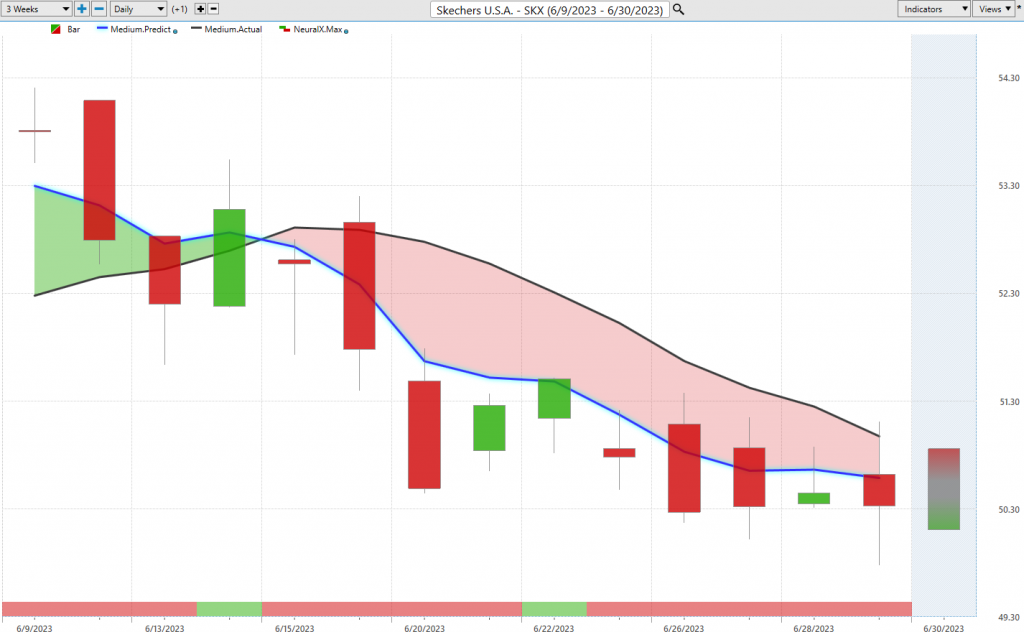
They’re going to shift, but what you have to do is to adapt to those changing market conditions. And so here we see this chart for Sketchers, and you see you get this blue line crossing above the black line, neural index bullish. But look how quickly this forecast starts to shift right after this trading day, neural index is very, very bearish, really all through this period then resulting in a crossover. And really what I just wanted to highlight about this is think about if you’re a short term trader and you’re coming in, maybe you’re bullish on Sketchers, well look how accurate these predicted highs and lows are.
So you understand if you want to take a position, fine do it down there. Again here, if you want to try to take a position, get these better price levels, and then you can recognize that, “Okay, well let’s get out of the market, take some profit,” and then recognize that shift coming in. And you see as that shift takes place, I’ll go ahead and bring it in here, after this trading day here, well, what is it telling you? If anything’s short then take profits on shorts. And we can see that from that point well, excellent entry to short. Get out of the longs. No reason staying long here. There’s so many better opportunities to take long positions in the portfolio. But if anything, short take profits on shorts and you see us each day as you come up towards that predicted high, you then move lower still.
We’ve had a very bullish market, but I always like bringing in some bearish opportunities.
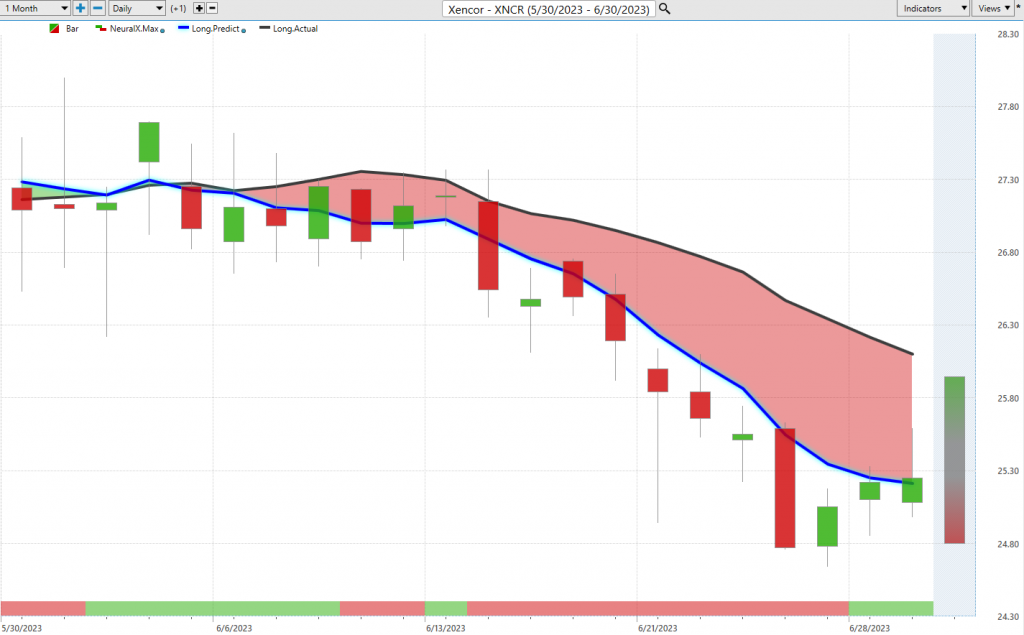
And so last week we took a look at Xencor, and again, it’s all just about the forecasting. Whether the market’s going up or going lower, you want the tools to really help you make better trading decisions. So we looked at this sideways move that we had where the neural index is bullish, but the trend is down. You get a very long sideways period, but then that weakness started to heat up. And so with the markets over the past five trading days, well, what have you seen in shares of Xencor? This is not a market where you want to be trend trading going long or really expecting a nice move here, especially when you’ve got so many other opportunities that are going to queue in and say, “Hey, yeah, there’s some really strong forecast in here where your predictive indicators are all skewing bullish. That’s probably the place where you can go ahead and focus your attention.”
And if anything, maybe pepper the portfolio with some shorts. So this market eat down another one or 2% this week, but over the last 20 trading days, you’re off about seven and a half percent. So again, when you have those areas like Apple and Amazon, a lot of this stuff doing well, you may want to go ahead and hedge when you start to see some of that generalized weakness and volatility coming in, really make money on both sides of the market. So we’ll go ahead and leave it there for today. But once again, this has been the Hot Stocks Outlook for June 30th, 2023. Thank you all for watching. Best of luck and bye for now.