


The Hot Stocks Outlook uses VantagePoint’s market forecasts that are up to 87.4% accurate, demonstrating how traders can improve their timing and direction. In this week’s video, VantagePoint Software reviews forecasts for First Solar (FSLR), NVIDIA ($NVDA), Enphase Energy (ENPH), Fifth Third Bank ($FITB) and Workhorse ($WKHS)
Register for a Free Live Training
Hello again traders and welcome back to the Hot Stocks Outlook for June 25th, 2021. Hope you all are having an excellent week out there in the financial markets and as always, plenty to cover here in today’s outlook.
So we’re going to start out with shares of Nvidia. We also have Fifth Third Bancorp and a lot going on in the financial stocks. And lastly, we’re going to look at end phase Workhorse and First Solar, which really highlight a very important concept that I want to talk about here today in our hot stocks outlook. So I definitely encourage anyone watching these videos, and if you’ve been watching over the past few weeks is, go back and watch from about May 20th forward to today and it will explain a lot about the overall context of the market, and how Advantageous has gotten us to understand where we might want to position ourselves in the marketplace.
But, a really great example here of Nvidia shares, and what we have here is daily price action.
So regardless of what forecast we’re looking at, the software works off of end-of-day data and right up against that end-of-day data, you’ll see that there is a black line and also a blue line. Now the black line that you’re seeing there, that is a regular, simple moving average, or what we refer to as the actual simple moving average. And what that’s doing is a very common technical indicator, right? It’s looking back over the previous, in this case, 10 close prices. Add those all together divided by 10 and you get a good rolling measure of where market prices have been over a given period of time, but traders need to be ahead of the market. We need to know where average price is going to start moving, going forward so we can be ahead of any trend shift that’s happening. And so what we’re able to do is compare the value of that black line to the value of this blue line that’s plotted within VantagePoint.
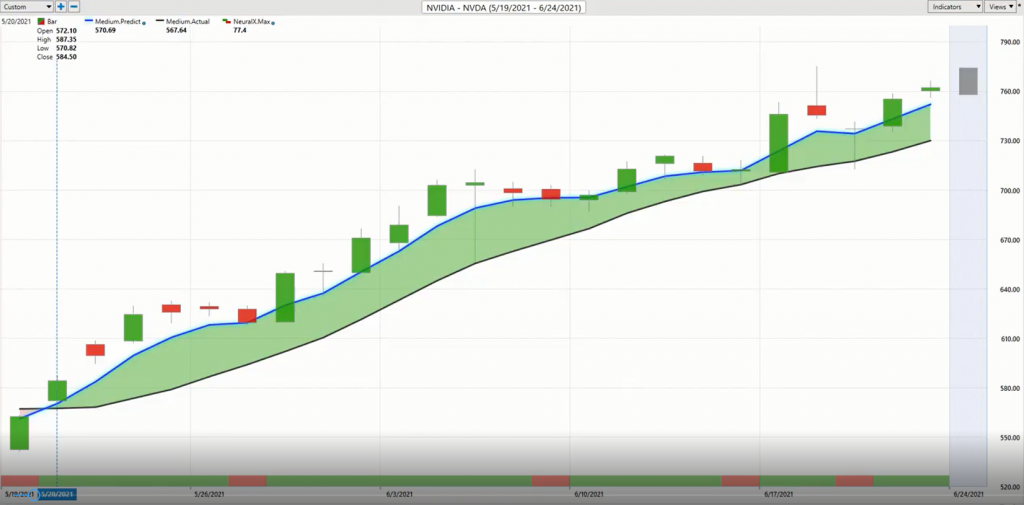
Now this is what’s called our predicted moving average, and this is a proprietary indicator that for that number to get calculated and plotted against this chart every single trading day, VantagePoint is performing what’s called intermarket analysis, and it’s utilizing the technology of artificial neural networks to do that now. Well, what does that mean? Well, that means Nvidia is not just affected by things like the S&P and technology ETF, there’s a lot of important market relationships that drive and influence future prices. So, sure, it is going to have individual stocks and things like the broader ETF groups, but you’ve got things like the global indices, you’ve got global interest rates. You’ve got a lot of individual stocks, global currencies, and the past couple of months are a really great example where, where’s the attention go two, three months ago towards Franklin Nevada and the gold mining stocks.
And we see that over that period, you’re getting a tremendous rally. Well, what’s happening is the commodity markets affect the stock markets and vice versa. And that’s what the software is able to do is pick up on these relationships, which in gold can be quite obvious, but in shares of Nvidia may be a little bit more subtle. And so what this produces is really a combination of these overall predictive indicators. So whenever this blue line or predicted moving average crosses above the black line, it’s suggesting average prices are going to start moving higher and you’d therefore would want to use whatever strategies you utilize to get long.
Now, at the bottom of the chart here, you’ll see that we have this bar that goes from green to red and back to green, and this again gets updated at the end of every trading day, and also is utilizing that technology of artificial neural networks, but it’s very short-term forecasting of short-term strength or weakness in the market, really just over a 48 hour periods, pretty much short term declines and rallies in the marketplace to really help you be aware of potential weakness in an uptrend or vice versa. And lastly, those neural networks are also tuned to pick out a intraday predicted high and predicted low for the next trading day. So what you have is actually a roadmap of the overall trend short-term strength or weakness, as well as a predicted high and predicted low to help with limit orders, profit targets and all this.
And so, we do this every single week here in our hot stocks outlook is, highlight what are those predicted highs and lows look like against the actual market data? And so, in a period of time here throughout really May 14th and 17th is when all these bullish crossovers really started to come through, but it’s become very clear that if you want to get long in the market, and you know, obviously Nvidia is a very common, popular stock, but this is the time period where stocks are going to benefit. And as long as that blue line remains above the black line, you can use the guidance of things like those predicted highs and lows to express long positions. Now that can take a lot of forms that can be buying the crossovers as a trend trader. That can be short-term trading and shooting towards profit targets as a shorter term trader.
But the point being is you have a very consistent roadmap, not just to get you into the market, but an adaptive forecast that as things shift and change in the market, where you may get a start, your entries in the market back here, but you don’t know what the market’s going to look like a month later. And that’s where you have these tools to say, hey, the trend is still up. You still want to be a buyer here and really benefit as volatility increases, because if you come off big pivots and turns in the market, volatility really starts to expand. And that gets to some of these finer points that we’re going to cover… Covering really this past month of time utilizing the VantagePoint forecast here.
But overall, you see that, well, what’s happened here is you’ve gotten a trend forecast here as markets come in, the markets have moved up about 30% and we understood a select grouping of markets that we’re going to benefit through May. And that’s where again, First Solar, Workhorse end phase, the scanning features within VantagePoint help us identify that. Now, quickly here let’s go over Fifth Third Bancorp. And this is a lot like Tyson Foods. We looked last week and we had that big dollar surge and it affected certain stocks, specifically Tyson Foods, Pilgrim’s progress, agricultural commodities really get hammered, right? When there was a strong dollar.
Well we’ve seen similar things happen throughout the financial space where this is clearly not a space where you want to be long in the marketplace. We have this crossover to the downside here.
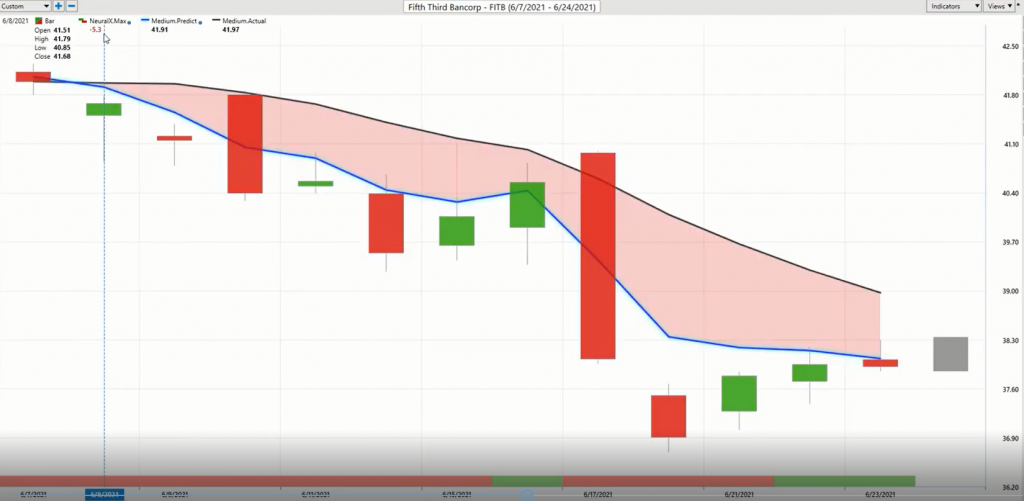
We can see in Fifth Third Bancorp, you get these really big gap-ups, but clearly you see that blue line still below the black line, the overall trend, and a lot of separation between that prediction of what is the prediction of the moving average compared to the actual clearly still there in a downtrend you gap-up, and very quickly moving lower there.
What we see here is a lot of what we see in these subsequent markets we’re going to look at is that, there’s been a big rolling relationships, where big sectors like financials are not where you want to be. Agricultural commodities, food producers, not where you want to be. And specific stocks where things are actually looking quite good. And it makes it very easy to be like, okay, this is where you want to get long, take profits on long positions. Very straightforward.
Here’s Enphase Energy, and this is turned up mid-March and we had a little bit of a sideways period in a lot of these stocks, but you see recently, again, these things being on your shortlist of where do we want to get long, well, VantagePoint saying okay, this is going back into an uptrend, blue line over black line. Use your VantagePoint tools like your VantagePoint predicted highs and lows to guide you moving forward over a period like this.
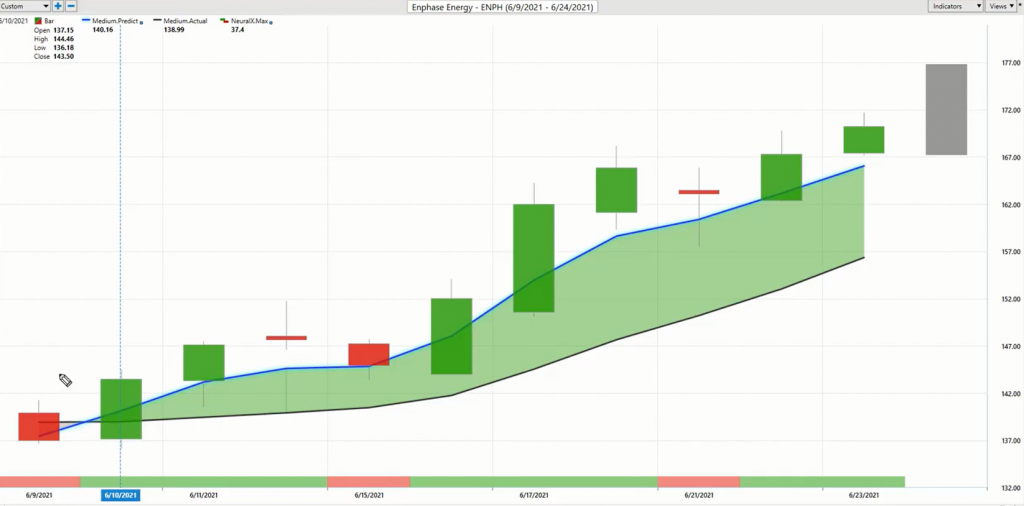
And so again, you understand that, okay, here’s an area where I can be long. Where intraday do I want to accept prices, so I make sure that I’m getting in at a good intraday level. And you see what happens is, you’re getting in at the lower part of the range before a big move higher. When the big move higher happens, you likely want to be on board taking advantage, but what happens again, you’re getting it at the lower part of the range and hopefully a move for another big move higher here, as we see the trend is still very bullish. And when we actually look at a lot of the correlations of stocks that are doing well and have been doing well over this time period, this looks like it has the potential to do extremely well, but you’ve gotten some really great entries to participate already.
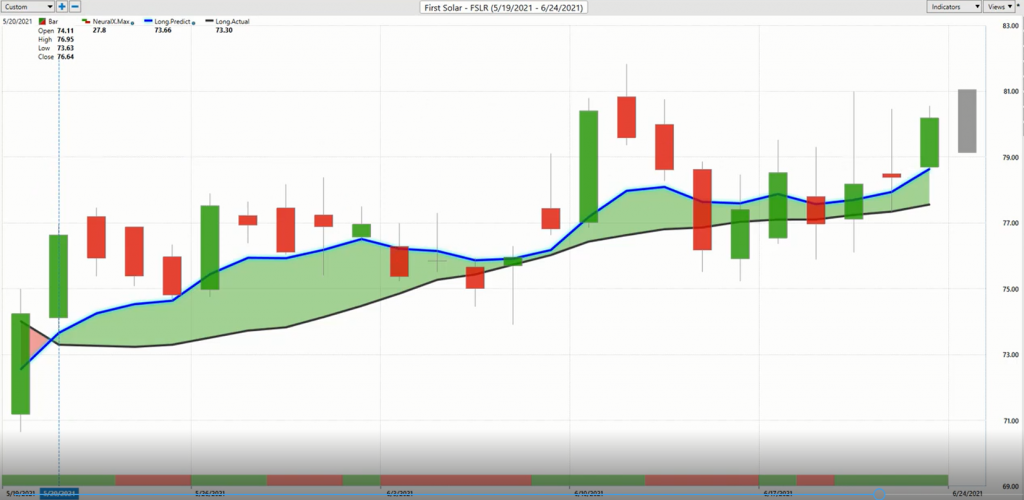
Here’s Workhorse Group. And these are actually our longer term predictive forecast in First Solar and Workhorse, and the reason that I’m bringing these through is just to highlight that, of those markets that we saw pivot back in the midpoint of April, you really have to determine are those markets still in uptrend? And this is how this works is understanding it. Look, the overall trend is up. You still know that if you want to be a buyer in the market, you’re going to use those predicted highs and lows to do trade management, but you see how this works. You have these markets on your radar where you know you’d only want to be long that are sharing that relationship of strength from what we’ll call the mid-May sell off. And then it was straight up from there. But what we have here is you see this cross of the upside, very clearly that use those VantagePoint predicted highs and lows to be a buyer in the marketplace here.
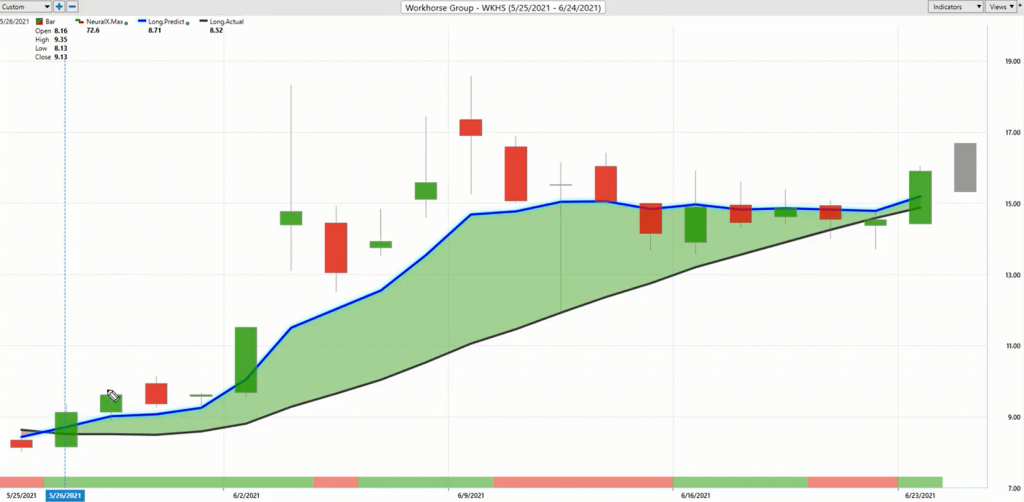
And there’s going to be time periods where things consolidate and run sideways. Like I was explaining, as you get further off of an inflection point, a big pivot in the market like we had in mid-May, volatility a month later is likely to increase, but that’s where you have a real benefit when you get those really nice entries, you’ve been long a month. You can come in and say, okay, well, I can come in here and trade my position, right buy at predicted lows, target predicted highs, just trading some of the position, but still prepared to benefit if this starts to break out. And I have a little bit of a suspicion that that may occur, as you see this longterm trend still bullish. You got this sort of long consolidation and what looks to be a little bit of a breakout here.
We look at a similar stock and First Solar, and it’s the same thing, these things came off these lows in the midpoints in May. And you see these long-term forecasts with a really choppy market where things are running sideways and bouncing around, but clearly an area where you only want to be long and take profits on longs. And you’ve got, again, the help of these predicted highs and lows to help you intraday as you navigate this volatility in these windows. And like I mentioned, you’re going to have volatility increase as you get a month off of where those trends have started.
And so again, I’m really encouraging people to go back and watch some previous videos. I know it takes a little bit of digging around and watching these things and sort of walking it forward. But this is really important because this is where there’s a huge benefit in VantagePoint is recognizing things like the food and financials are very clearly the sectors in the market where you want to avoid, but there some serious opportunities that have been happening over the past couple of months, where you’re significantly up in those positions and they look quite good to continue.
Now, if these crossovers cross to the downside and say, look, this is over, you got to get out. Then that’s where we benefit from the adaptive forecast and we take the profits and move on. But there’s certainly some really nice opportunities that all came through at the same time. And it’s very easy to understand where those stocks are and what they are and where you want to belong, and where you certainly want to be, either avoiding the market or potentially short and hedging that overall portfolio in a very, very strategic and very helpful way, where you’re making money on both sides of the market here. So, have a great rest of the week, everyone, once again, this has been our hot stocks outlook for June 25th, 2021. Thank you all for watching, best of luck out there, and bye for now.


