


Register for a Free Live Training
The Hot Stocks Outlook uses VantagePoint’s market forecasts that are up to 87.4% accurate, demonstrating how traders can improve their timing and direction. In this week’s video, VantagePoint Software reviews forecasts for General Mills($GIS)., Dentsply ($XRAY), Under Armour ($UAA), Boston Scientific ($BSX), Kroger($KR), Dominos Pizza ($DPZ) and Apple ($AAPL)
Hello again, traders, and welcome back to the Hot Stocks Outlook for June 24th, 2022. Hope you all are having an excellent week out there in the financial markets, and as always, plenty to cover here in today’s outlook.
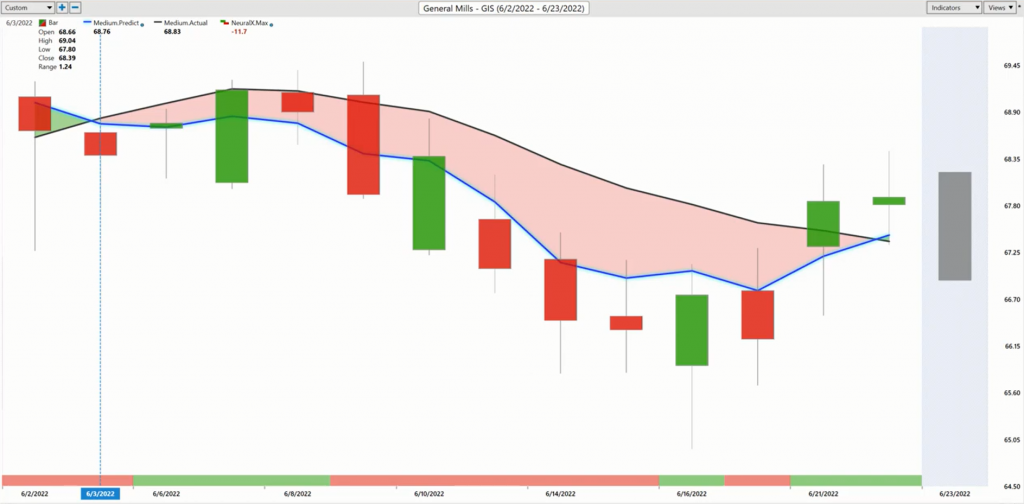
There’s really a lot I want to cover to really summarize the past several weeks and how traders can really get ahead of these shifting moves, market up, market down, and insulate the portfolio and really recognize these important shifts in the marketplace. So, starting out here, we’re going to look at General Mills, and we looked at this last week, actually just highlight that… Well last week, things looked very weak, right? You have a lot of separation between that blue line and the black line, neural index was bearish, but you see things start to shift here, and you see three out of the last four days that neural index has been bullish across over to the upside, and I’m really just bringing this through, this thing only went down about four or five percent. It’s a slow moving non-cyclical stock.
But to drive that bigger point home, a VantagePoint is always doing its analysis. It’s always utilizing these indicators, and we see here in the short term with the neural index, you get that strength, weakness. But the overall picture, helping you understand, hey what’s going on out there? And how should I set up the portfolio? So, let’s go ahead and get more to some of the specifics here with that in mind, and I do encourage you to watch some of the previous Hot Stocks Outlooks because things have been volatile, and you really got to know where to position, where to look, and have some good tools to make those better trading decisions.
So, here ensures of dentsply very similar pictures, we’ve seen throughout the market place, right? We have this blue line and black line right up against daily price action, right? So, what we have here with that blue line and the black line is the black line there is actually a simple moving average. So, that’s a very common technical indicator. In this specific case, it’s looking back at the previous 10 closed prices. It’ll add those all together and divide by 10 and that smooths out the price action, right? Lets us know where market prices may have been over a given period of time but we need to know where are things headed next, so we can be ahead of the next move. And while we’re in that move, manage it effectively, right?
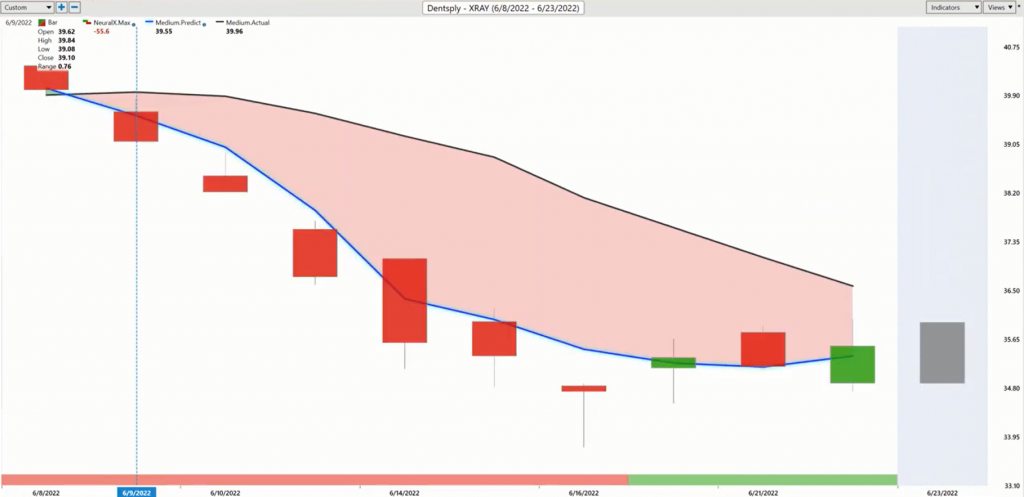
So, what we see as we actually utilize tools like the Intelliscan feature is stocks overwhelmingly selling off. So, this gets to a couple weeks ago in the Hot Stocks Outlook, Benjamin Resources, Goldman Sachs, these stocks violently moving lower and making it very clear financial, health care, we got real problems in the market. You want to short the S&P, sell your stocks whatever, however you express the bearishness on the marketplace. But what we’ve seen here recently is we’ve seen that neural index get bullish and so what this is saying is expect some strength over the next 48 hours here and when we run that Intelliscan we are seeing some areas of strength here. So, this gets very helpful to understand that if you’re sure dents play, you want to cover this thing, actually, yesterday will be a good area to go ahead and cover some of those shares and with what we’re seeing in the market, I won’t be too surprised to see things actually start to poke a little bit higher here. But let’s go ahead and move on and take a look at some of these things.
So, some areas of the market are still very, very weak and it’s very clear that you’d want to remain short. So, this sorts of highlights the broader view of the market where the S&P had a nice little flurry there and what you’re going to notice is this neural index is looking ahead only 48 hours at the time, right? So, it’s updated every single day, looking out at 48 hours, there’s a couple of candles as far as the overall prediction and you see how this works where as the strength comes into the S&P and the broader marketplace, the forecast here is alerting you to that. But as things start to shift, it becomes very clear that there is weakness in this market, both in the short-term and the long-term and this is where it became very clear that if you want to make money in this market, buy some put options and approach it that way.
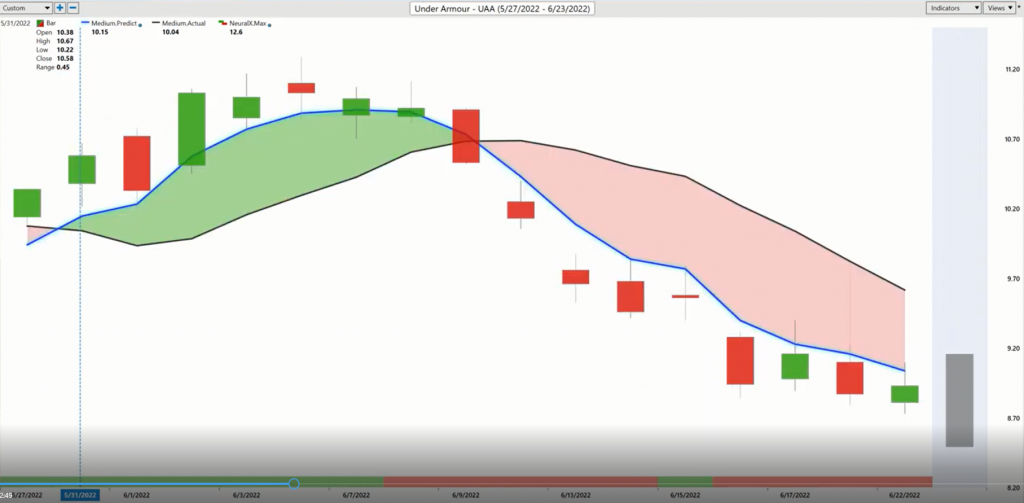
Now, there are some shares here where you see no strength out of the neural index and so there are some areas where you may want to remain short, manage those opportunities if you do get some bounces up to predicted highs and things you can keep managing those trades. But there are some areas where we’ve seen some pops, and this is where the trade management really becomes critical because if you are short, you’ve got a great opportunity to cover those short at higher levels and keep reassessing that scenario.
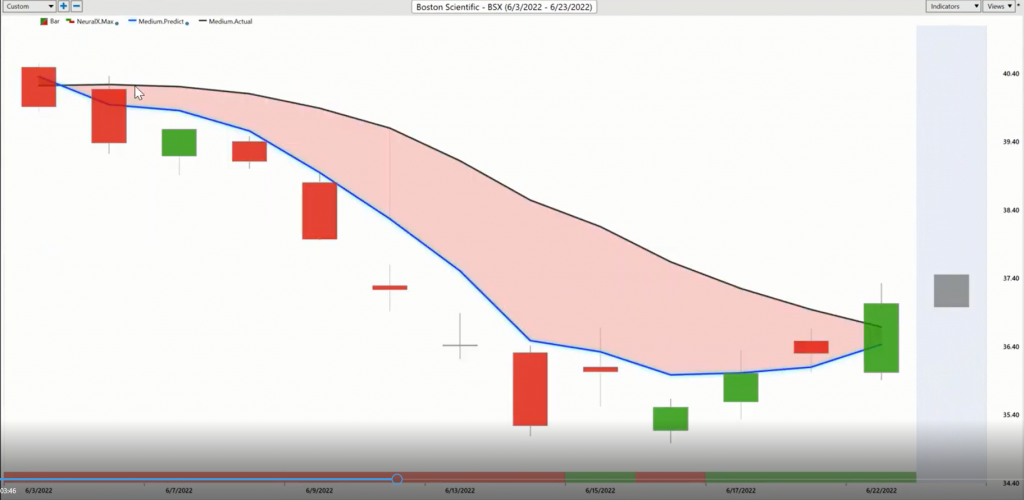
But here at Boston Scientific, again, you see this tremendous weakness that is, I’m a broken record here, every chart is the same. That’s because what VantagePoint is able to do with these predictive indicators is it’s utilizing it’s artificial neural network to do what’s called inter-market analysis.
So when it comes to Boston Scientific, you understand that this is going to driven around by things like the nasdaq, things like the S&P 500. But how important has the dollar index features been to your portfolio over the past six months or so. So, it’s able to take that into account, but also subtle relationships between individual stocks, and so what it understands is, if you got this in your portfolio, while the overall trend is down, the neural index forecast of the subsequent 48 hour periods are weak and therefore you should act accordingly, but look how things have shifted for the last five days that neural index has been bullish, and that’s letting you know that, cover some of these positions if you are still short you can cover down, and really what would end up happening is you would come to the day here where that bullish neural index and you want to cover, you literally cover at the bottom, or cover some there, or cover some there!
But letting you know that if you want to take , that’s the great place to go ahead and take prodits and the look for the short-term balances. And get those clues from the broader market that are highlighting that there are some strength here. Maybe cover those shorts in certain areas, maybe even reverse and go ahead and get long, but have that balanced approach to things.
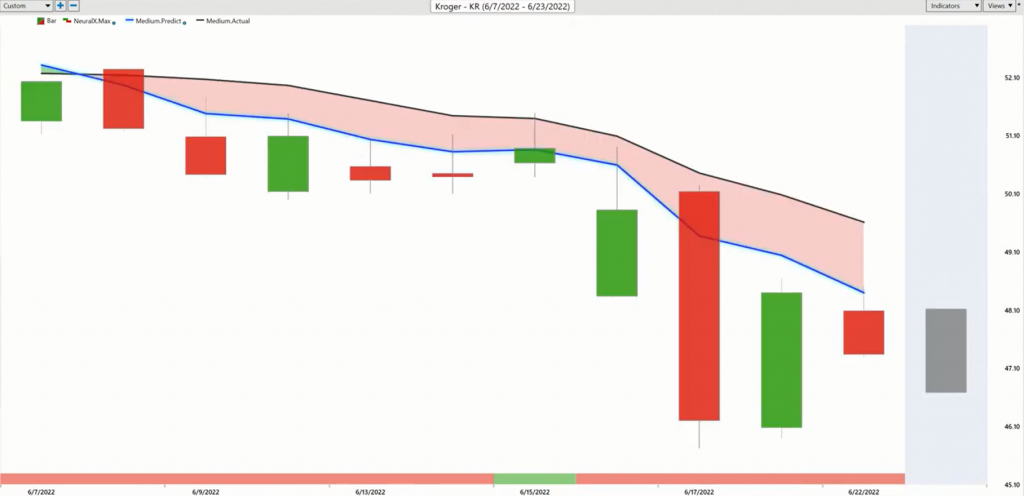
And what this does is allows you to have these really nice entries from the short side of the market, recognizes areas where you might want to take some stabs on the bullish side. Now, here shares of Kroger and you can see there hasn’t been much attention there as far as any bullish-ness coming through this forecast. So, we have the crossover to the downside at 48 hour forecast from the neural index consistently weak here, and of course the predicted highs and lows. And we look at this every single week. Those are very helpful levels that are produced before each and every trading day.
So you really understand, what should that expectation be for the overall trading range before the day even occurs. You could have a limit order there to sell, limit order there to sell, limit order there to sell, limit order there to sell. Potentially limit order there to sell. You see that as you keep expressing that trade, you have the opportunity to take some profit and continue to manage the opportunity, right?
So if you want to remain short, you got some weakness here but maybe there’s some areas where you want to go ahead and get long, so I brought this through last week and it’s really highlighting that there’s these areas within VantagePoint that we can use these tools to identify strength. And it gets back to this point of recognizing these shifts early on, being able to get these opportunities and then manage the position and understanding there’s actually a lot of strength here, we can manage this moving forward. And really what I want to highlight is this period where it’s really the collection of these tools that is going to help you.
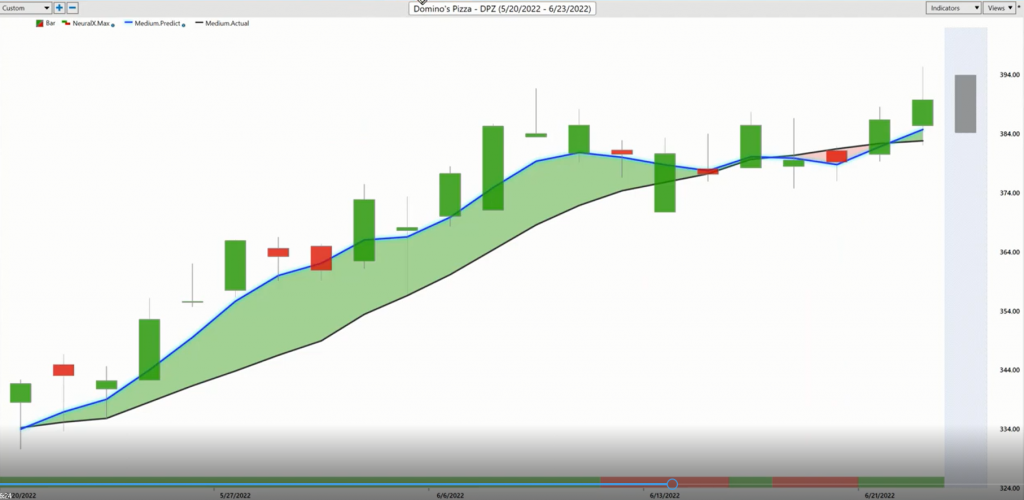
So, as the markets run sideways and the S&P runs sideways, you see that you get this crossover to the downside and that makes sense. This predicted moving average is a predicted moving average. It’s just going to try to predict where average prices are going to be ahead of time. So, it can get dragged around from time to time, but you have these other tools to help you. I really just want to highlight this that there’s a reason why I brought in Domino’s over this period you have these tools that say yeah, we’re getting some sideways price action but if you got some longs from down here at 3:30, well maybe you want to go ahead and take some profit at the top end and look to buy some at the lower end. But here you see this crossover coming back to the upside neural index bullish and again, where are you wanting to be focusing for some of your trading? And were those more bullish opportunities are. And you can use the combination of these tools, really combining it with your trading approach, right?
So you’re very bullish here, you know you’ll get some weakness over the next 48 hours here, but those predicted highs and lows can be very helpful to help you assess what’s going on, stay with the trade, and keep that position on there. So, Domino’s Pizza really nice opportunity here, we’re getting shares bouncing a little bit more here. Again, just a lot of support in the market, but about 15% rally in a market that has not done very well here.
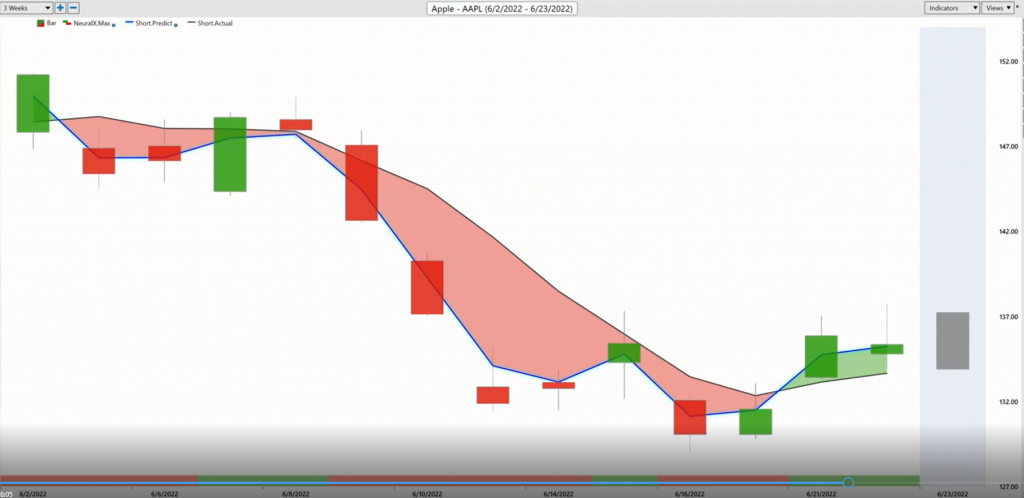
So, lastly I want to bring in this. And this is going to be a little atypical here because again, this is going to highlight this crossover to the downside, this weakness in share of Apple. But this is much like the broader market, right? A lot of weakness, we see that very clear blue line below the black line neural index bearish. But just what I want to highlight is that there have been some interesting shifts in the marketplace and even from this point of just covering short positions and reassessing things, you see we get this crossover in the upside neural index bullish there and much like the broader market, seeing this bullish-ness come through actually seeing some of those predictive crossovers and we just look at Appple here and their predicted highs and lows and you come down, hit that predicted low there of about 13493.
Now, we don’t know what’s going to happen with the market here. We got a lot of volatility and things moving around but there’s good ways to use these tools to get some really nice entries on the market and not have to take a lot of risk at all to take these pieces out of the market. So even here, we’ve already moved up, hit these predicted highs. And that’s what I mean by identifying this bullish-ness potentially very early whether you need to cover some short to make adjustments, and then let those VantagePoint forecasts update, right? So in the same way that General Mills is looking bearish here, but we can use tools like this, tools like the Intelliscan to get that broader view and really get a sense of how these shifts are coming into the marketplace and affecting things.
So, I’ll go ahead and leave it there. A very, very interesting last month in the market, and VantagePoint has done an excellent job of really directing where should that attention be, not lose track of the bigger narrative, and be able to take some risk out there and get some exposure to some of the stuff. So, I’ll go ahead and leave it there once again. This has been the Hot Stocks Outlook for June 24th, 2022. Thank you all for watching. Best of luck and bye for now.


