Register for a Free Live Training
The Hot Stocks Outlook uses VantagePoint’s market forecasts that are up to 87.4% accurate, demonstrating how traders can improve their timing and direction. In this week’s video, VantagePoint Software reviews forecasts for Workday ($WDAY)., Johnson and Johnson ($JNJ), General Mills($GIS), Quest Diagnostics ($DGX), SPDR ETF($SPY), Dominos Pizza ($DPZ)
Hello again, traders and welcome back to the Hot Stocks Outlook for June 17, 2022. Hope y’all are having an excellent week out there in the financial markets, and as always plenty to cover here in today’s outlook. And boy, we have things moving around quite a bit here. So we’re going to go ahead and take a look at Johnson & Johnson. We also have General Mills, Quest Diagnostic. Really talked about how the really bigger space consumer non-cyclical healthcare, really having some trouble and highlighting this broad base weakness that we’re seeing. So we’ll take a look at the SPY. Also, we got Domino’s Pizza and lastly, Workday, highlighting some of the weakness in the tech space that we’ve been highlighting over the past couple weeks. And I really encourage you to go back and watch the previous Hot Stocks Outlooks previous few videos, and just recognize, that shift moving higher, things moving lower and how you can use a tool like this to get ahead of those positions in the marketplace.
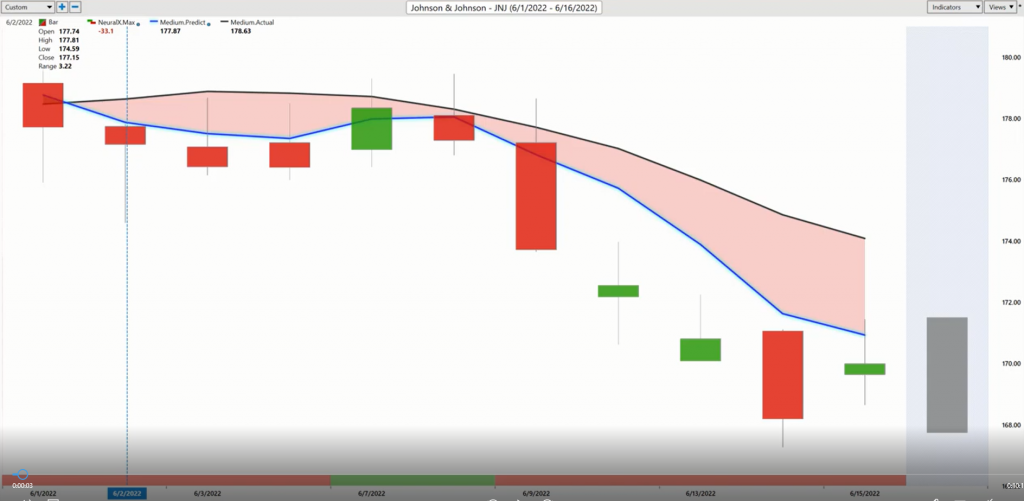
So what we have here with Johnson & Johnson is daily price action. And we can see right up against all that price action you have a black line there and also a blue line. So the black line that you’re seeing there represents a simple moving average, and that’s a very common technical indicator and in this case, what it’s doing is just looking back over the previous 10 close prices. It’ll add those all together and divide by 10, so that really acts to smooth out the price action and let us know where a market price has been over a given period of time. But obviously traders need to be ahead of the next move in price, and so what we’re able to do is actually compare that black or what we might consider a lagging moving average to this blue line. And for this number to get calculated and plotted against the chart this is where VantagePoints technology of artificial neural networks come in to produce these proprietary predicted moving averages that are forecasting future price.
So specifically for shares of Johnson & Johnson, what the neural networks are doing is what’s called intermarket analysis and understanding relationships between markets. Now, if you look at a stock chart recently, you’re going to see that there’s some pretty heavy similarities with the S & P 500 or the broader indices. But it gets more complicated than that. Because we have things like the dollar index roiling around, things like crude oil prices, and it even gets more subtle than that with individual stocks that can share relationships with Johnson & Johnson, or ETF groups, or global interest rates. And so all of these things factor into not only the individual markets that you’re trading, but your overall portfolio. And so what this does is allows traders to utilize this tool, factor in those intermarket relationships and actually generate future price predictions.
And it’s those predictions of future price generated via technology that’s used to build and construct these predictive indicators. So whenever we see that blue line crossing below the black line, it’s suggest average prices are going to start moving lower and you therefore want to look to take short positions. Now I bring this through really to represent this constant weakness that we see in more and more areas of the market. So last Thursday, we saw it in the financials, and really had that sense of there’s a lot of weakness here, you need to hedge or get short. But a lot of this weakness was manifesting itself week after week, especially when you utilize tools like the VantagePoint and IntelliScan feature here.
So if we go ahead and I can open this up, show how this works, we can take a lot of these VantagePoint tools, plop them right into this scanning feature and actually see these shifts occur in real time. So when the market closes and we get those signals, we’re going to be able to detect where the stronger parts of the market and also where is that weakness. And you can really configure this to hone in on exactly what you want to do, whether it be that longer term trade, shorter term trades and whatever timeframe really works for you. So we can go ahead and hide this over here. But when we get that blue line crossing below the black line, again, it’s suggesting average prices are going to start moving lower and we can see that over the course of this move. Just on average, we’ve got about a 5% decline. Now this is a big stock like Johnson & Johnson, I’m bringing this in to highlight the broader market, seeing these things roll over and that much of the market is not in these up trends and really likely to suffer.
So 5% decline there, but that’s not really it because we have the benefit of these shorter term predictive indicators at the bottom. So this is the predicted neural index. It can go from green to red, back to green. And what this is doing is updating every evening and forecasting out for the next 48 hours. So you can think of it as short term strength or weakness in the market and that’s going to help you determine, okay, well what should the expectation be? I may want to get short the market. But if I expect some strength over the next 48 hours, well, where might I want to look to maybe get short? And that’s where we bring this over to each week with our predicted highs and predicted lows values. And this is what can help traders even in today, make those good trading decisions, limit the risk, add on to positions, make trade adjustments that can really increase a lot of the potential that they’re pulling out of these trading opportunities.
So when we go ahead and take a look at Johnson & Johnson, we can see that up towards these predicted highs represent better opportunities to potentially get hedges or short positions in the portfolio. And you see recently, even with the Fed announcement and news, the other day, these levels do an excellent job of keeping traders on the right side of the market, really seeing through the noise so that traders can really understand again, that bigger picture and position their portfolio appropriately, regardless of the markets they decide to trade.
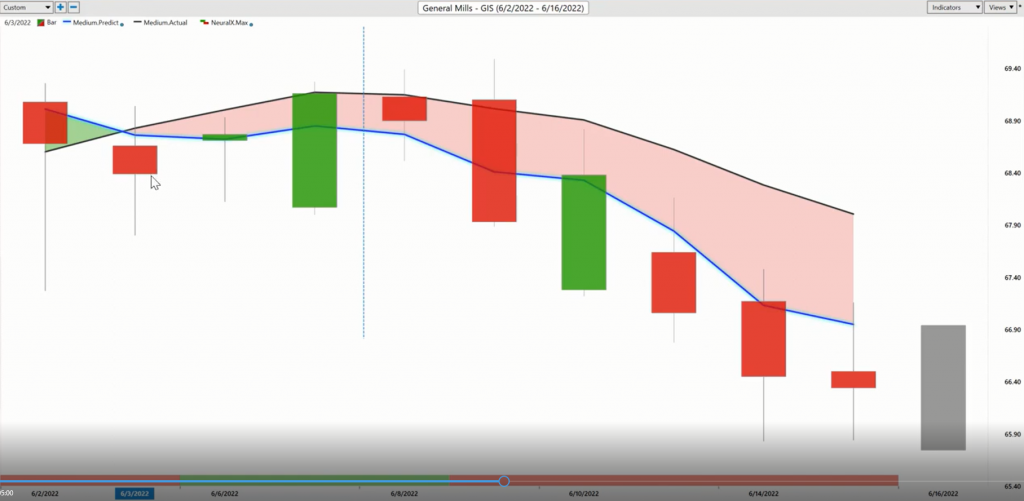
So here’s General Mills, very similar, and we’re going to move through these very quickly because there’s so much correlation going on in the marketplace because these are driven by things like the S&P 500, the dollar index. So here we see General Mills another consumer non-cyclical stock, and you see how these tools work together with that crossover coming through again, couple days later in June saying more weakness in some of these bigger important areas of the market. But that neural index can help with trade management, inform the trader that these subsequent 48 hour periods, there may be some strength. But as that overall weakness comes back into things and we see the broader sectors and shifts going on in the marketplace again, through the help of the IntelliScan, as we move forward through time, it makes it very apparent that things are very, very volatile here and very likely to move lower in certain cases here.
So right here we have General Mills. And again, we can see that these levels do an excellent job at providing potential entries to short the market. So again, these bigger stocks, aren’t going to move a whole lot, but as we get into more of these volatile stocks like Workday, you can sort of select, okay, well, do I want these faster moving things into the portfolio, that will benefit when the S&P starts moving lower and the broader markets sell off?
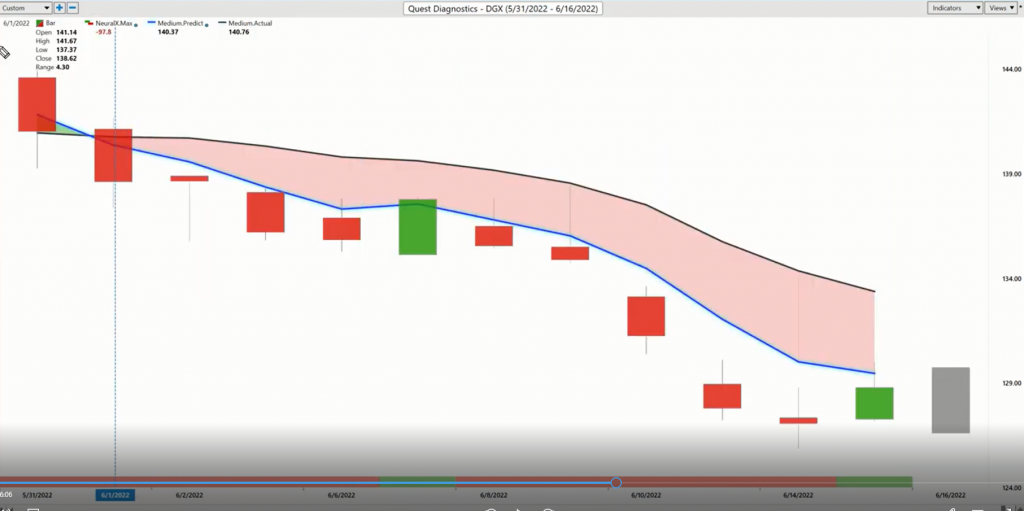
Here are shares of Quest Diagnostics, and again, we see early on in the month of June crossover is moving to the downside and only subsequent weakness, like we looked at Ben Franklin resources the other day. The financial stocks dipping lower last week, and really alerting those alarm bells that you really need to take action here. Here Quest Diagnostic crossover the downside. Let’s look at those predicted highs and lows, and then get a sense of, okay, well, if you’re trading in any of these areas over this time period, and many of these healthcare stocks will trade very similarly over this time, period, well, this is where you can get better entries and get the exposure so that you’re potentially making money during these times of tremendous volatility. So here in Quest, again, just overall seeing these shares come off about eight, 10% or so and lower still, as we see more weakness throughout the market.
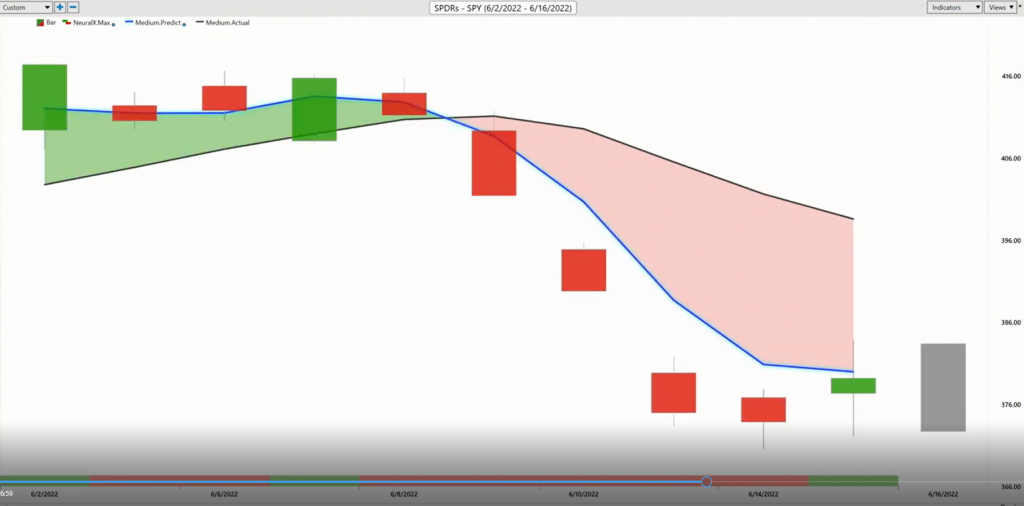
Now I want to bring in the SPY and while we do have a lot of this gaping and things like this we also forecast for the S&P 500 futures. You can get that overnight price. But what I want to highlight here with the SPY is, this is an aggregate market. It’s taking the broader S&P 500 and putting all those stocks together. So the stocks that have done well, well they’re going to drag up the index and the stocks that are doing poorly are going to drag things lower.
But what you notice here is that look at the neural index, going into all of this weakness. You actually have four out of five days going into last week where that neural index is bearish. And to that point as well, if we take a close look again at trade management ideas with your neural index bearish, going into this period, predicted highs and lows, the potential is you look, if you are trading SPY that you actually buy on that gap, if you’re trying to get bullish and then recognize that, hey, this is shifting. All of these socks are moving lower, and you want to get out of that position and potentially go short. Find a way to get that bearish exposure to the S&P and neutralize that portfolio, if not, just go short outright and make a lot of money as these markets decline. So there’s the SPY.
And again, just a lot of weakness from that neural index. If we extend that out to present day, you can see this tremendous amount of weakness over this time period. So those short term traders would clearly understand, this is not the time to get long. It’s forecasting that 48 hours of weakness over these subsequent periods.
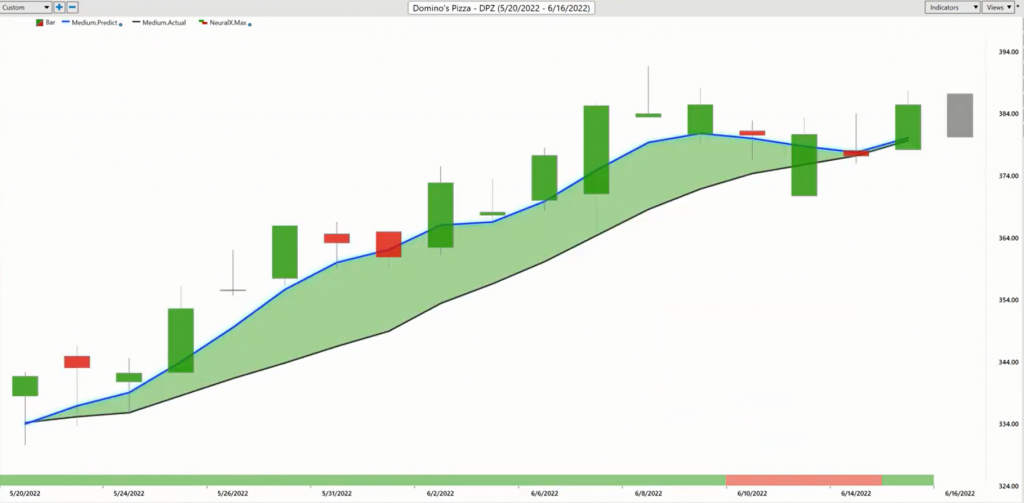
Here’s Domino’s Pizza. I brought this through just because not all markets are moving lower, but they are few and far between to see things that are moving higher. And you see that even in all this volatility here, here’s Domino’s Pizza. Well, maybe when things get a little scary out there the best thing to do is order some pizza and relax a little bit. And you see that this market just keeps moving higher.
Now, overall, the markets are weak. So you’d want to hedge yourself and have potentially some short positions if you’re even attempting to trade in any of these areas of the marketplace. But we can see that there’s something different going on in Domino’s Pizza. And there’s something different going on in the forecast here generated from VantagePoint. And it allows the traders to get that exposure, whether that be bullish or bearish, and understand the safer places to go ahead and do that.
And the example of Wolverine Worldwide over the past couple of weeks, a lot of strength there. But when the weakness comes in, it tends to take down everything. And you certainly want to notice that, and this is where, again, the tools like the IntelliScan and these predictive indicators, can get traders ahead of those next moves in the marketplace.
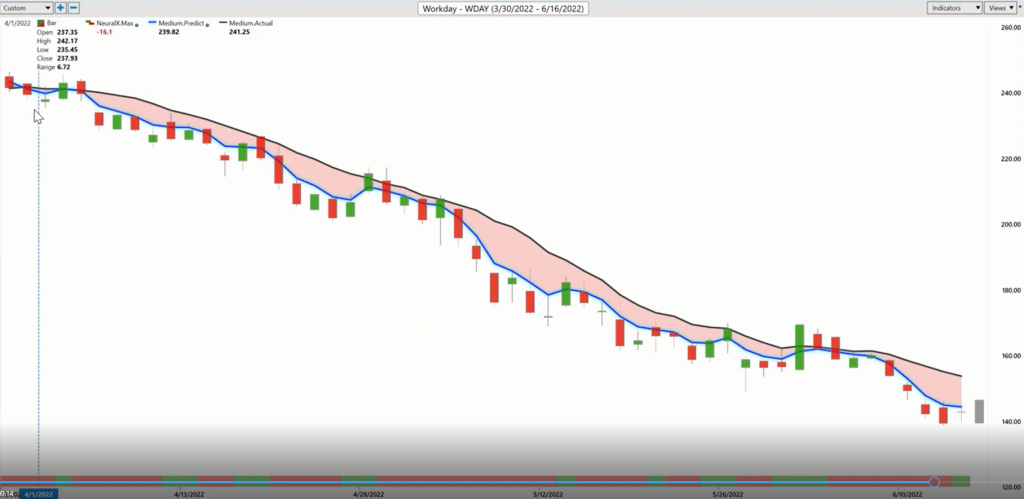
So we bring it back here to Workday. We’ve just brought this through over the past couple weeks to highlight these somewhat apparent places where there is some weakness, and it makes sense that you’ve got tech stocks moving aggressively lower. Well, here’s a stock in that space with a tremendous weakness and not a bad area to go ahead and get some short position.
But what’s amazing about markets is, once it gets down to $140 a share, well, it can still get cut in half again. So here we have shares off about 40%, but even down another 10 to 15%, just from, well, really the last video here. So things moving lower still there. So really nice moves here, spread out throughout the market. And certainly if you’re on the bullish side, it’s very painful, but there’re ways to even keep those bullish positions, maybe got dividend stocks in the portfolio, but hedge that portfolio and make sure that you’re really neutralizing things and not suffering during a period where shares and prices are dramatically moving lower.
So we’ll go ahead and leave it there. Once again, this has been the Hot Stocks Outlook for June 17, 2022. Thank you all for watching best of luck and bye for now.