


The Hot Stocks Outlook uses VantagePoint’s market forecasts that are up to 87.4% accurate, demonstrating how traders can improve their timing and direction. In this week’s video, VantagePoint Software reviews forecasts for Pfizer ($PFE), BioNTech ($BNTX), Costco ($COST), Harley-Davidson ($HOG) Activision ($ATV), Molson-Coors ($TAP) and Boston Beer ($SAM)
Register for a Free Live Training
Hello again, traders and welcome back to the Hot Stocks Outlook for July 30th, 2021. Hope y’all are having an excellent week out in the financial markets and as always, plenty to cover here in today’s outlook. We’re going to start with shares of Pfizer and also BioNTech. We talked a little bit about some of the S&P doing better, the Russell 2000 doing worse. So we’ll sort of continue on. We can take a look at Costco. We’ve got Harley Davidson, Activision here. And lastly, a couple of beer and spirits companies here.
So something going on in that area of the market, but let’s start out here with shares of Pfizer and this is a really good example.
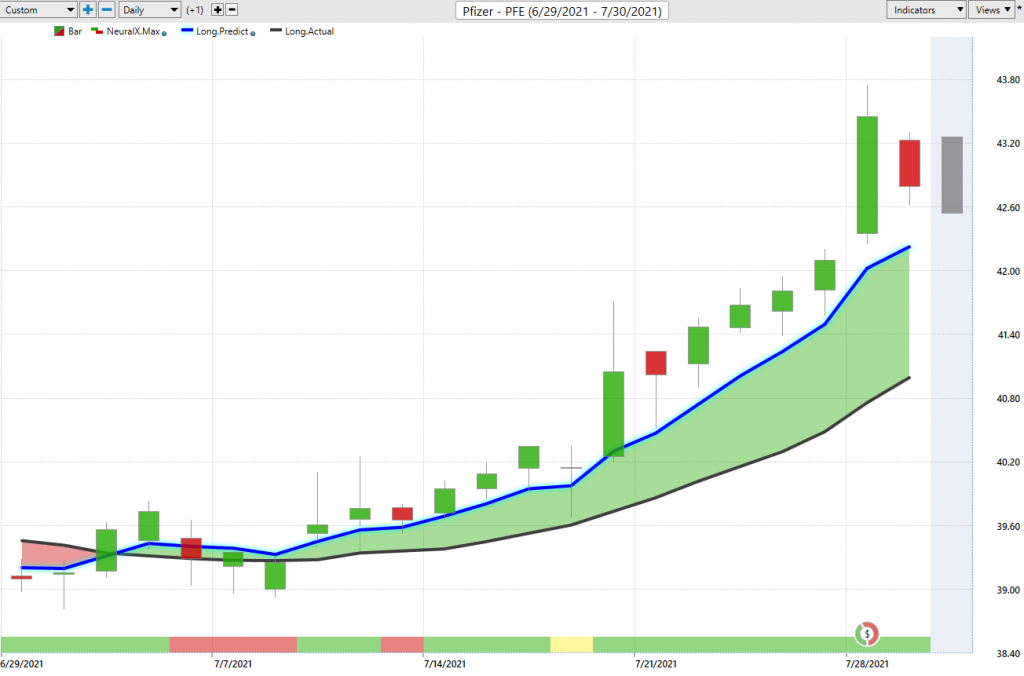
Regardless of the markets you’re trading, whether you’re trading Pfizer or the S&P 500 or crude oil futures, everything really works exactly the same way off of end of day data. So each one of these candles that represents a complete trading day. And right up against all of that price data you can see going back really to the beginning of July, you see that there is a black line and also a blue line there. Now the black line that you’re seeing there that is an actual or what we would call a simple moving average. We refer to it as the actual simple moving average, but that’s a very common technical indicator. And it just looks back over the previous 10 close prices. It’ll add those all together and divide by 10.
Now the problem with a tool like that is all the data that is used to construct it really comes from the past. So it acts as a really good measure of where market prices have been. So it’s a good moving average of where things are at, but obviously a trader needs to understand where’s the price going moving forward, right? Is this market going to start moving up, moving down? And how does that affect me and my trading approach?
So whenever we have this situation though where that blue line is crossing the black line, it’s very significant. Because while that black line is just a regular simple moving average for that blue line to get plotted against the chart each and every trading day, VantagePoint is performing what’s called intermarket analysis and it’s utilizing the technology of artificial neural networks to actually generate and calculate that value.
So what’s happening is rather than just looking at, again, those past prices and really smoothing out the price data, VantagePoint is looking at market relationships. And that can be things like broader ETF groups. That can be individual stocks, but also very important things like global interest rates, currency prices, futures and commodity markets. And so it’s able to look at all of these what’s called intermarket relationships and actually decipher that information and use it to generate a true price prediction.
And then all of those predictions that are generated via that technology are actually built into the calculation of, in this case, this moving average, but also our other technical indicators that we’ll go over turning what was a lagging tool that just really summarized what’s already occurred in the market into a forward-looking predictive tool. So when you have that blue line crossing above the black line, it’s suggesting average prices are going to start moving higher. You can of course trade above and below that average, but as long as the blue line remains above the black line you should expect prices to move higher.
Now in the same really predictive way that you’re saying, “Okay, well, how do we get a good man where average prices are headed?” Well, that technology is applied to this bar that you see at the very bottom of the chart. And this’ll flip from green to red depending on the prediction, but this is again accurate up to 86% accuracy. So it’s about 80. You think of it … correct that. Four to five times on average across all the markets, but it’s tuned to forecast very short-term strength or weakness. It’s not looking for average prices like our predicted moving average.
Again, it’s tuned to say, “Okay, well, over the next 48 hours is there short-term strength or weakness in the market?” Now, when we combine that with our predicted moving average and understand what type of trade are we getting involved in? What are we doing here? Well, this can help us with our overall trade management knowing that, okay, well, you may want to be long in the market here. That’s understood by the predicted moving average, but expect some weakness over these subsequent 48-hour periods when that neural index goes bearish.
Now, conversely when it’s bullish, you should expect some strength over those time periods as well, but it’s going to be a really good guide to let you know, “Hey, when should you expect some short-term weakness, potentially look to buy that weakness.” If you know, “Hey, I want to be long this market anyway” and you see what occurs here. You actually see early on you get a little volatility, but you see this often where you get a predicted high and low and you see the next day you’re pretty much filling that predicted high and low from the previous day. And everything gets really back on track here every single day acting very reliably here as a guide of where might you want to add to this position or go ahead and get long.
So there’s a situation in Pfizer. Again, we’ve talked about how for the bigger stocks, S&P 500 stocks doing quite well and looking much more resilient than the rest of the market, but here Fiverr shares up 10% just in the past 17 trading days. So months ago this was down at 33 [inaudible 00:04:45] nice rally higher, but went sideways, no reason to get involved. Well, now these things starting to perk up again. And we talked a lot about so over the past couple of weeks and understanding that, okay, when certain stocks start to move higher, you see those relationships play out in different markets.
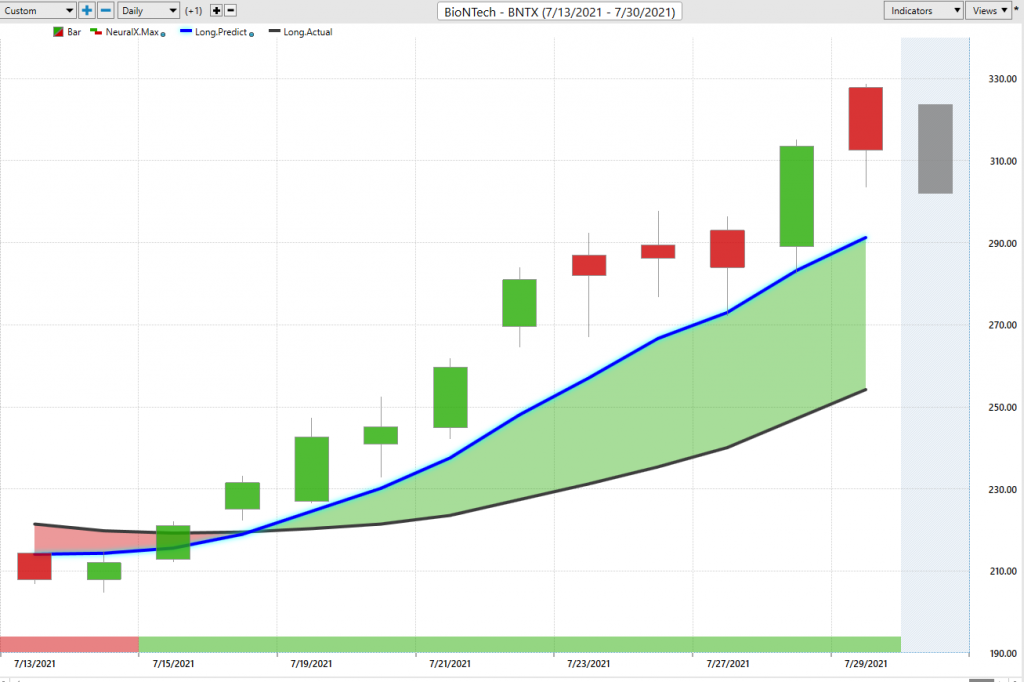
So here’s BioNTech. You also see this blue line crossing above the black line neural index bullish throughout here saying there’s a lot of strength here. This would be an area where you’d expect the market to continue higher. And we’ve seen again as Pfizer moves higher and markets do well, this up 40% just in the past nine trading days. But again, getting that very clear forecast that says, “Kook, this is up. The overall trend is up. There’s no weakness from the neural index suggesting that this looks to continue to be strong.”
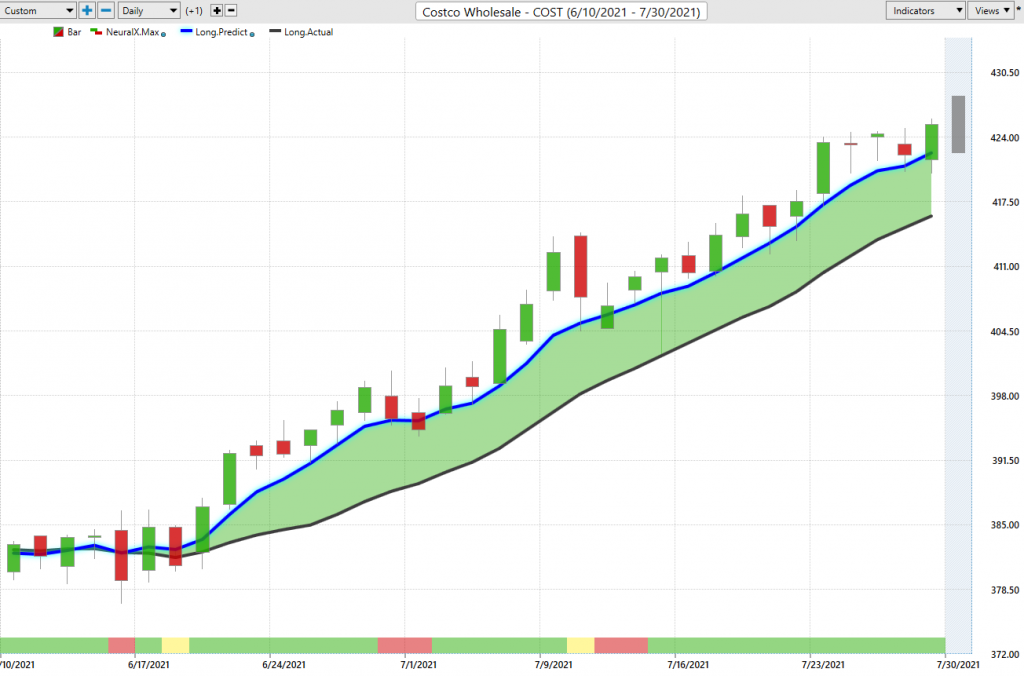
Here’s Costco. And again, looking at these S&P 500 stocks really strong companies and getting strong signals from the forecast. That’s where I’d want to look to stake out a position. So you see this crossover blue line over black line. You get a couple of periods here where this neural index gets bearish and you see you get some weakening over the price action over the next couple of days. But again we can say, “Okay, well, over going back now a month and a half if you’ve got Costco on the radar, you’ve got this measure every single day of that predicted high and low will be generated before the trading day occurs.”
So we can then go back and see how accurate are those actual predictions. And you can say, “Okay, well, if you’re looking to be a buyer here you really understand that, all right, well, if I’m looking to get good intraday levels, where should I be looking intraday?” And this is what’s great is after that day closes, VantagePoint’s going to take in the forecast, understand those intermarket relationships and then guide you moving forward so that you can manage that opportunity and make the most of potentially nice breakout and a nice trending move that we have here.
So here, if we look at this we’ve got a move of about 10% over the past 29 trading days, but of course you see they’re multiple entries along the way over a half dozen entries as that market moves up and pushes up against about 4.25 a share. Now here’s where things get a little bit interesting as we’ve talked about the Russell being much more weak than the S&P 500 and those traditional more robust stocks. And this is where you’re going to find some trouble and potentially areas where you can hedge that overall portfolio.
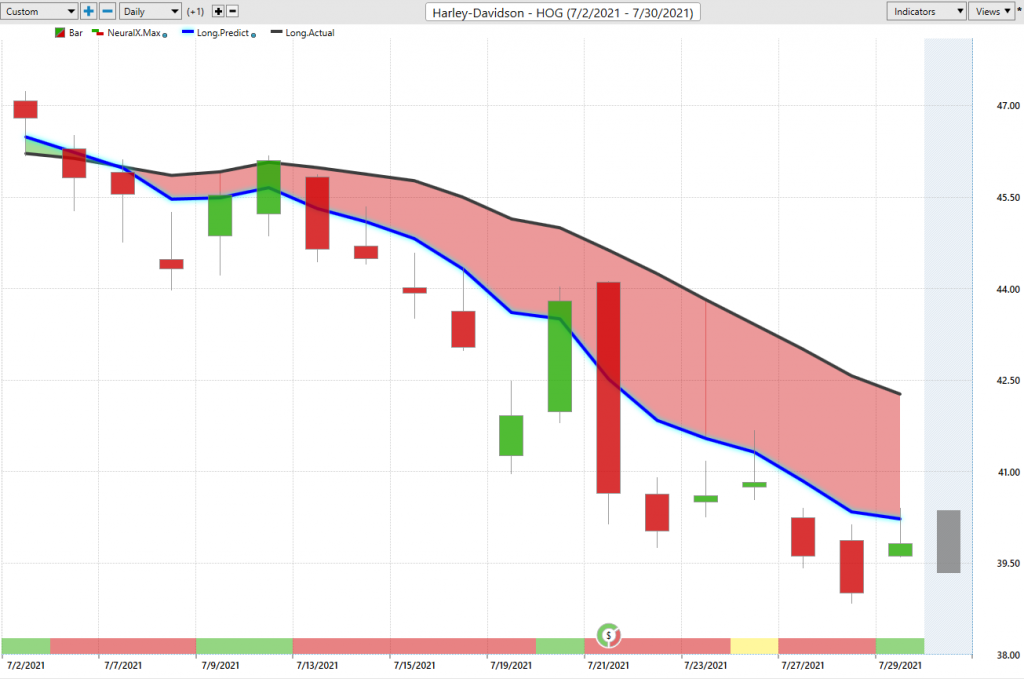
Well, here’s Harley Davidson. You see that blue line crossing below the black line. So the entire month here when you’re looking at where do you want to get long? Where do you want to get short? That broader narrative of S&P Russell stocks and then you can break that apart and find the individual markets and individual stocks to actually add to the portfolio or trade. So if you’re trying to get short on Harley Davidson, again here you understand that where do you want to be shorting up at these predicted highs and covering and taking profits on your short?
So you see here, there’s another one of these situations where the software is just going to be picking out its predicted highs and lows, right? It just takes in the day, but sometimes you get more volatility. And you see what happens here as you gapped down aggressively, you move up and move pretty close to those predicted highs from the previous day. But the overall trend is still very much down here. And you see even after all that volatility the software’s saying, “Okay, well, expect these predicted highs up here, but the trend is still down.” And you would clearly be only in a position to short the market, take profits on shorts. And we’ve seen things get quite bearish here about a 15% decline just in the past 17 trading days.
Here Activision again, crossovers to the downside and you get a lot of sideways price action here, but here where the market isn’t doing much if you’re using tools like VantagePoint, you’ve got some pretty good guidance that says, “Okay, well, when the market’s up here at these predicted highs.” And in that case you get filled at the open on a gap up there, but this is where you want to be shorting the market. And even if you’re short-term look to take profit down at these subsequent predicted lows, but clearly don’t be long in the market, right?
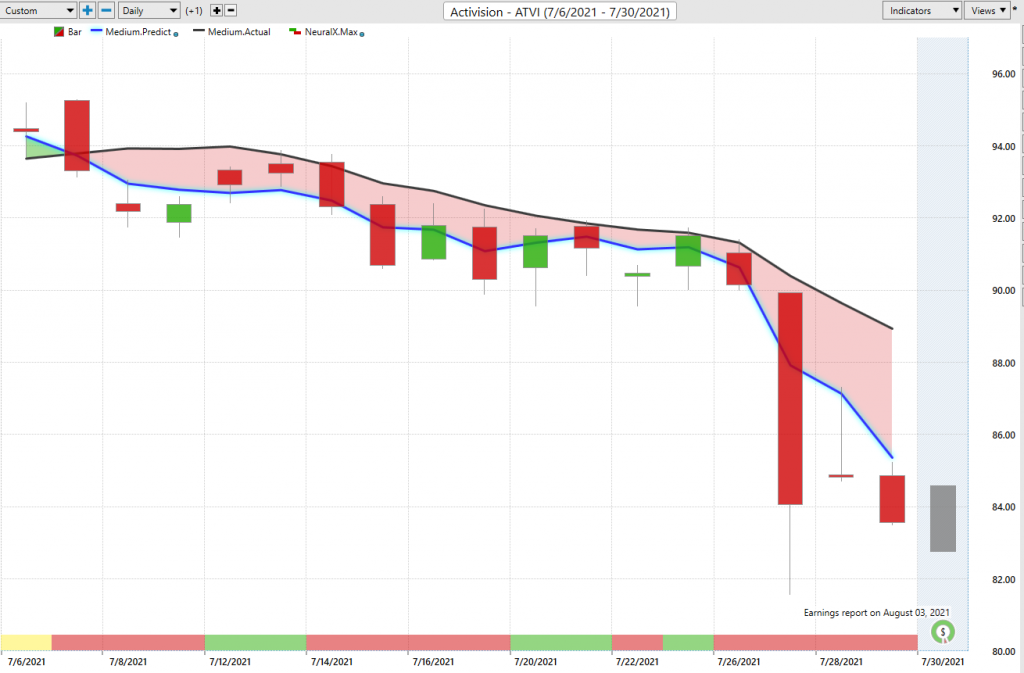
We’ve got a lot of weakness here. Very clearly the trend in a downtrend and you see things accelerating in that way. We’ve seen this time and time again as far as recognizing sort of like mid-May a few months ago recognizing that pivot, all those stocks moving higher and then things really start to accelerate maybe a couple of weeks after you initially get involved in that market. So here’s Molson Coos again, and just seeing something going on in beer and spirits. Just a lot of news about sort of the market changing and things like that.
But clearly this area is in a little bit of distress here and you see these crossovers to the downside, Molson Coors here. And very clearly if you’re looking for a place to short the market, take profits on short, I mean, it doesn’t get more clear that it says, “Okay, well you may not hit that predicted high every single day, but certainly on a weekly level.” Typically, that’s going to be a good part of the range to actually be taking a short position. And you see some really good trading here on the short side, where if you’re just shorting taking profit, doing it again, doing it again, doing it again.
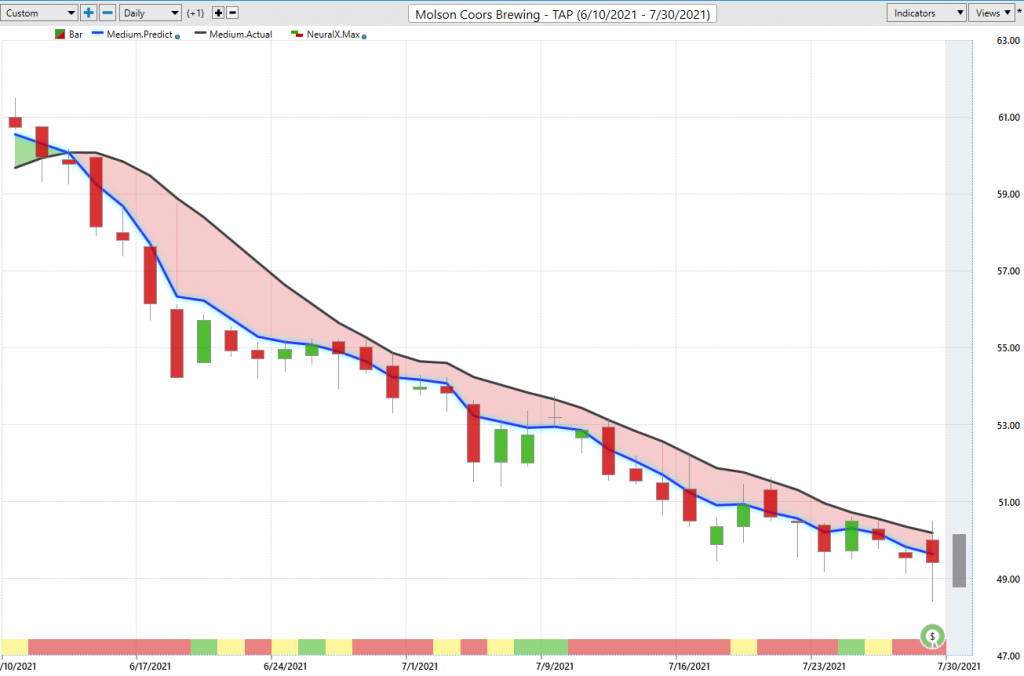
And if we go ahead and move on, we can see the entirety of the move here in Molson Coors getting about a 15, 16% drop there just over the past 31 trading days.
Here’s Boston Beer. So again you see a very similar situation of move lower. This market is running sideways, but even when markets run sideways, when you have the tools you can say, “Okay, well I know what’s going on here. I know I want to be short and maybe I want to manage that.” So there’s the possibility that you’re short in a couple of hundred shares up here, taking profit as this thing moves lower and holding on some for hopefully a bigger move lower.
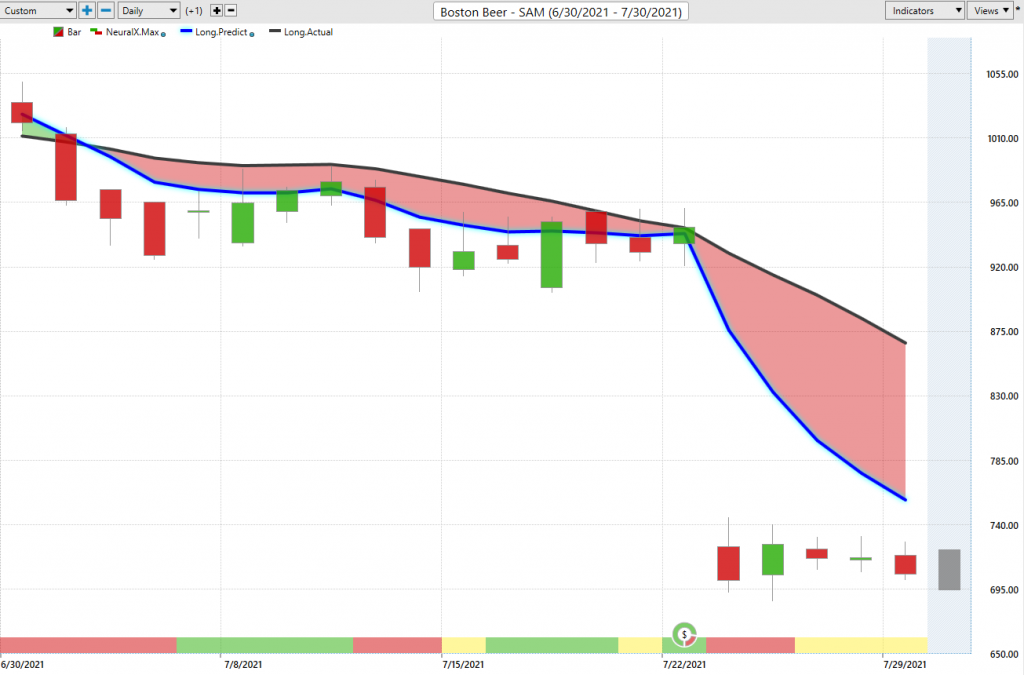
But you see here how a whole lot of nothing potentially goes on for a couple of weeks, but a lot of opportunities to short up at these predicted highs, target these predicted lows and even make money and really make money as the bottom drops out and things really start to move overnight there. That’s really how a lot of this plays out is when you have these short-term tools like VantagePoint that can help you get that position on, manage it effectively will oftentimes when you’re on the right side of the overall trend, these things really start to break out and move in your favor. And that’s where we see a lot of these really accelerated gains.
You see about 29% decline here and very clear that where’s the weakness in the market? Well, where’s the strength? It’s not too hard to build that broad narrative and then you’ve got the short-term tools to come in and manage that based on your style, your approach, and the types of trading and instruments you like to use. So once again, this has been our Hot Stocks Outlook for July 30th, 2021. Thank you all for watching, best of luck out there and bye for now.


