


Register for a Free Live Training
The Hot Stocks Outlook uses VantagePoint’s market forecasts that are up to 87.4% accurate, demonstrating how traders can improve their timing and direction. In this week’s video, VantagePoint Software reviews forecasts for Caterpillar($CAT)., Phillips 66($PSX), Waste Management($WM), Hilton Worldwide Holdings ($HLT), Bath and Body Works ($BBWI), and Apple ($AAPL)
Hello, again, traders and welcome back to the Hot Stocks Outlook for July 1st, 2022. Hope you all are having an excellent week out there in the financial markets. And as always, plenty to cover here in today’s outlook. Now, we’re going to start out with shares of Caterpillar. We also got an energy share here. We got Phillips 66, Waste Management, Hilton, Bath and Body Works, and we’ll go ahead and revisit Apple, which we looked at last week. There’s really a lot going on in the marketplace, a lot of volatility, opportunity to the upside, to the downside, but you really want the tools that are really going to help you build that portfolio and really identify the best opportunities at the right time.
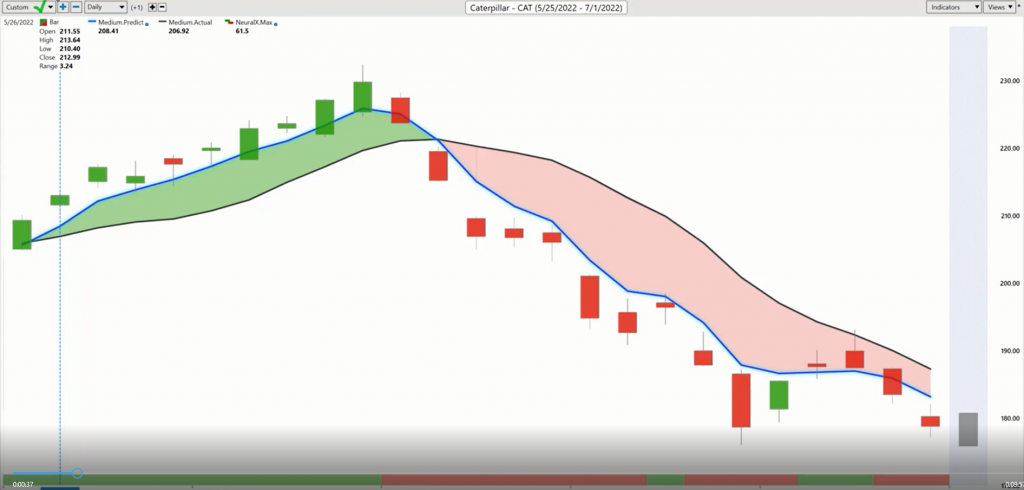
We’ll start out here with shares of Caterpillar. And as always, what we have here is daily price action.
Each one of these candles represents a full and complete trading day. And right up against that price data, you’ll notice that there’s a black line and also a blue line there. The black line that you’re seeing there, that is a simple moving average. That’s a very common technical indicator. In this case, what it’s doing is looking back over the previous 10 close prices. It’ll add those all together, divide by 10. What that does is smooths out the existing price action and let a trader know where has the market been over a given period of time. But traders need to be ahead of the next move and understand where prices going next. What we’re able to do is actually compare that black line or that lagging moving average to this blue value.
For this number to get calculated and plotted against the chart every evening, this is where VantagePoint’s technology of artificial neural networks is performing what’s called intermarket analysis to give traders clues as to future price action. What does that mean? Well, specifically for Caterpillar, well, we know that this market’s going to share some influences with very important markets, like the S&P 500, some other stock indices, things like the dollar index, global interest rates, oil prices, metal prices, and the futures markets, as well as other individual stocks or ETFs or capital goods companies. What VantagePoint is able to do is take all of that into account, understand all of those relationships, whether they be inverse, positive relationships, leading or lagging, and it takes that information and uses it to generate future price predictions.
This technology generating these price predictions, it takes that and builds it into the value of these indicators, turning what we’re lagging indicators that are just going to get dragged around like a simple moving average into a forward looking predictive tool. But this technology isn’t just going to work on our predicted moving average letting you know the overall trend direction of the market. If you look at the very bottom of the chart, you’ll see this bar that goes from green to red, back to green, and this gets updated every single trading day as well. This is that neural network technology solving a different problem for the trader. This one really corresponding to short-term strength or weakness in the market over a 48 hour period. If you can get that overall trend direction, you also have a tool here to set your 48 hour view of short-term strength or weakness in the market.
And last but not least, to really round out the forecast, you also get a predicted high and predicted low for the next trading day. Artificial neural networks, you can train them to solve a very specific problem. These specific neural networks are solving, hey, what’s likely to be the predicted high and predicted low for the next trading day? It’s really the combination of all these tools that help traders make better trading decisions. You’ll see that as this blue line crosses above the black line, we get a lot of strength in the S&P, in the broader markets. The neural index is very bullish. You can use things like your predicted highs and lows to stake out some positions in the marketplace.
These can be very advantageous levels to take a position, stay involved in the market, or take profit along the way, or a little bit of both, but you’ll notice as things start to shift, the software does an excellent job of saying, okay, well, look for some weakness now. If you were taking long positions, it’s time to go ahead to potentially look to short, as we see that blue line crossing below the black line. But more importantly, what I want to highlight is VantagePoint does an excellent job of highlighting the overall strength or weakness in the marketplace. When we’re looking at different stocks and what’s going on throughout the marketplace, and we see that, okay, well, we still have this blue line well below the black line, and even with this little bit of strength that has come in, well, it really hasn’t done much here.
If you’re trading Caterpillar, it’s been very important to understand that over the past week where we get that huge flurry out of the NASDAQ and the S&P, well, here in Caterpillar has not been an area where you want to get long. And if anything, use these spikes to reset short positions to the downside. I just bring that through because we’ve had a lot of moves in the market, and it’s important to understand that bigger picture of what’s going on, so again that you can structure that portfolio to make sure that it’s benefiting when we get these indexes starting to make their longer term sort of moves. Here we have an 18.5% decline there on shares of Caterpillar. But more recently, some trading where, again, you can set some short positions, take some profits, and do quite well.
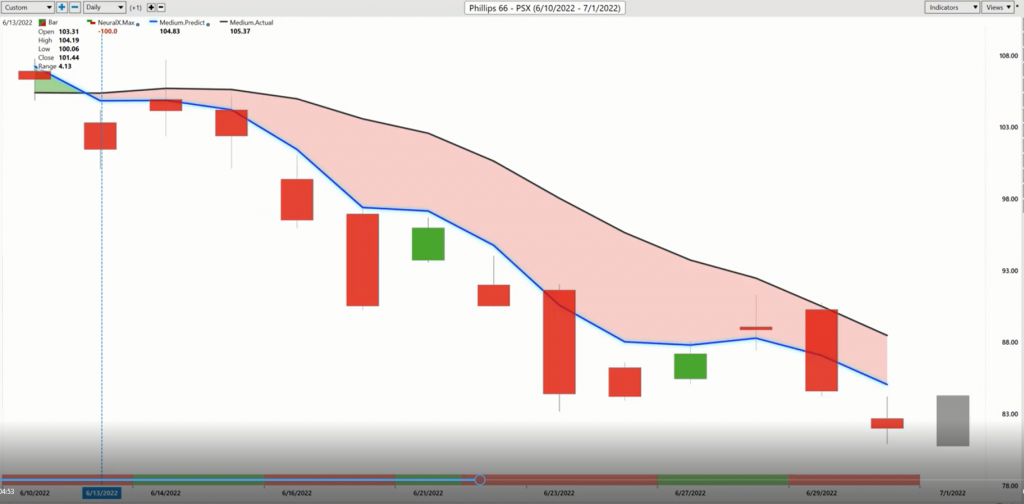
Now, this is very interesting, because we’ve seen a lot more weakness come into the markets very rapidly, but more recently, oil sell off. But as far as the energy stocks and how VantagePoint has been forecasting things, a couple weeks ago, we really start to see all the energy stocks start to go lower. Here you see what Phillips 66, that blue line crossing below the black line, neural index bearish. And if we go ahead and look at those predicted highs and lows, we can see that it offers some excellent guidance as far as where to look for short positions. We get these bounces higher. And also letting you know that if you are trading crude oil futures, that there’s some problems on the horizon there. This going back a couple weeks ago, and now we see things really pulling back as the markets really overall recoil.
We had a dollar marching higher and now we see dollar shaking around as well. This is having an implication on all the markets that you’re trading, but certainly these energy markets really seeing that play out very quickly here. Really quick move to the downside here, about a 21% decline. A great place to be over the previous months, but you want to understand when that shift happens and when the portfolio needs to understand, look, things are tremendously bearish over this time period. You may want to look in other areas of the market to go ahead and get long. Now, if oil’s coming off a little bit, well, maybe companies that have big giant trucks that drive around and pick up trash might not be doing too bad.
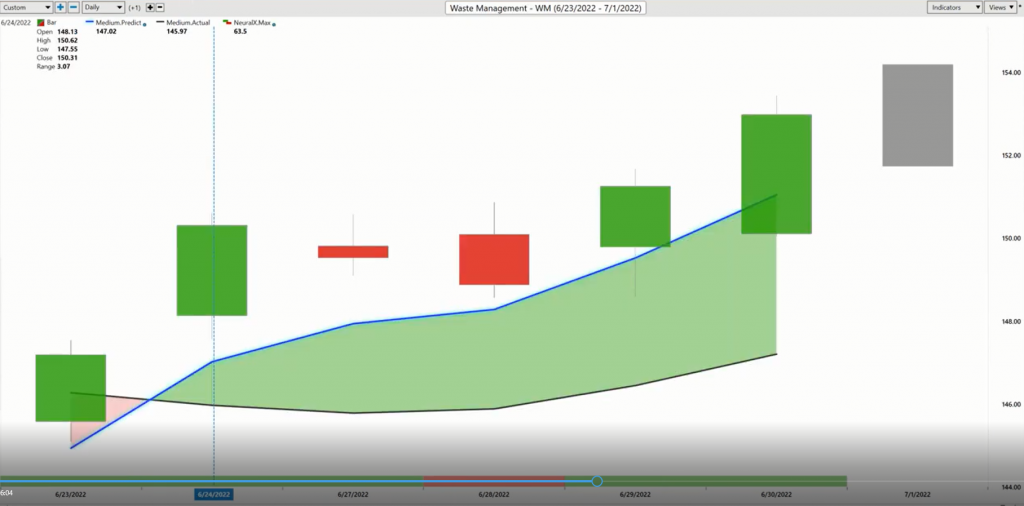
Here we see Waste Management with a crossover to the upside, blue line over black line.
We can look at those predicted highs and lows and get a sense of the trading week. If you’re looking for opportunities to go ahead and get long, well, you see this predicted low in here really looks great. Neural index looking very bullish through here. In a day where we did not have a lot of strength overall in the marketplace, you see Waste Management doing very well over this time period. Potentially if we see dollar weaken and some of these other things happen, well, you may have a really nice opportunity and a really great entry in a market that’s doing the right thing. But let’s go ahead and understand where those areas where we need to still be understanding that there’s some weakness here.
Hilton Worldwide Holdings ($HLT)
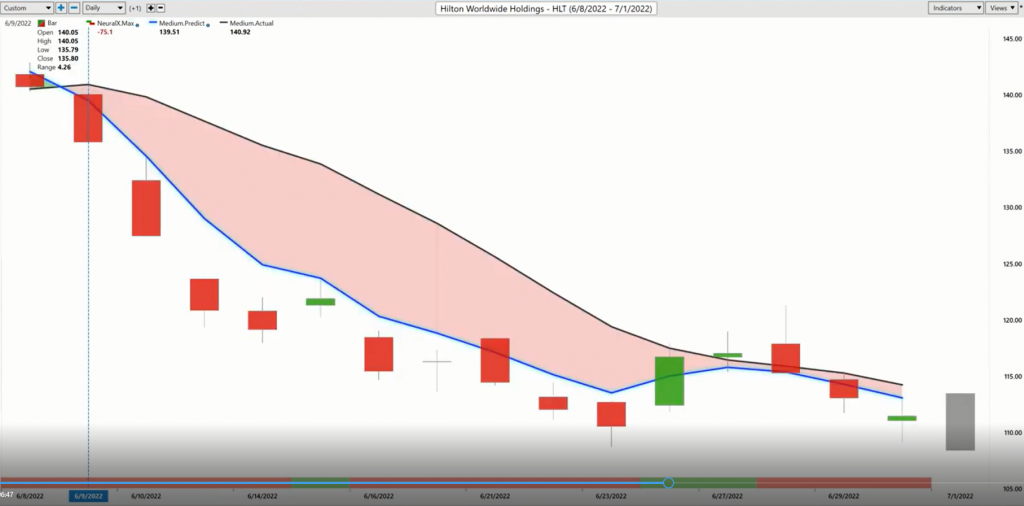
We have Hilton Worldwide Holdings and you see that cross over the downside.
Very similar to Caterpillar. But what you really want to understand about this one is no blue line over black line at all here. You want to find those areas where if you… We had some strength come into the market. We can take a look at Apple again, but you want to be very careful on where you decide to take those bets and at what price levels you might decide to take those bets. Here we see again, we’ll take a look at this overall move to the downside. We see Hilton shares coming off. Let’s see about the overall move here, about a 21% decline.
But even more recently with the recent price action, if you’re looking for an area to potentially short, well, we see that strength come into the market, but it’s very clear that, hey, this is an area where you want to go ahead and potentially look to short or hedge your bets and express those short positions on the portfolio and certainly not take any bets to the long side in these areas where we just see a tremendous amount of weakness here.
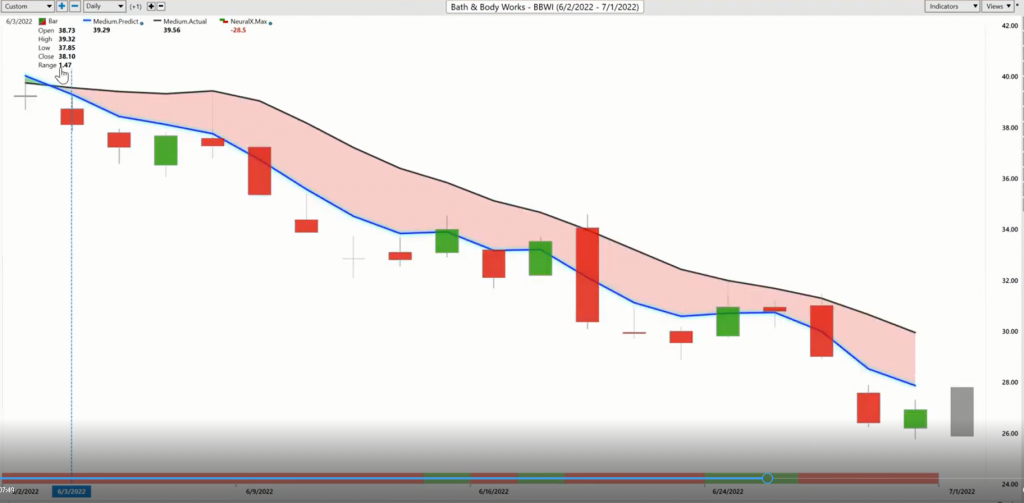
Here’s Bed Bath & Beyond, very similar picture here, blue line crossing below the black line. Little bit of strength from the neural index in here and you see things run a little bit sideways, but you really want to understand that bigger picture. And also, if you are looking for areas to go ahead and get long and benefit if we get that big rally last week that we saw, you want those areas that you can remain short in the portfolio.
VantagePoint makes it very easy to say, okay, well, maybe we’re seeing some strength and there maybe that short-term pop that the short-term indicators are picking up on, but where do we want to go ahead and maintain those short positions and keep expressing that bearishness in the portfolio?
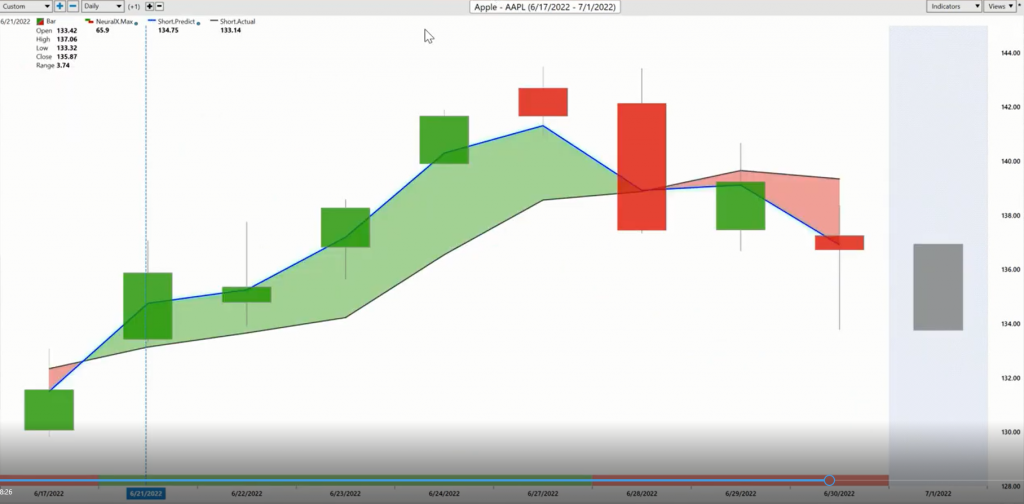
Lastly here, I always want to bring it back to Apple. This is a very short-term forecast, just highlighting… A really good example of this is really highlighting there hasn’t been a lot of strength in the market, but Apple’s a very big company. They’ve got a lot of cash, and this has been a really nice opportunity where you see shares of Apple, we highlighted this blue line crossing above the black line, this predicted low coming through the next day.
If we just take a quick look at this, we can see that, okay, well, from that point where those signals came through, we got about a 6.5% rally out of Apple shares. But Tuesday was a very important day and we had a very important shift in the marketplace. We see here that if you look at the neural index, you see that neural index goes bearish. You see the next day, which wasn’t a great day in the market, but Apple actually did pretty well here. The market trade’s higher, but you do not want to be long here, at least not at these short-term price levels. What’s really interesting about this, as we see the market actually does pull back and even today pulling back to this previous predicted low. But I just highlight this, when you can get these really great entries, take profit along the way, this is where we can really get some nice, like I said, just entries on the marketplace and see how things play out.
As we have the tools to manage this and understand, okay, we want to be long here. Well, things are starting to shift. Go ahead and take that profit. If you still want to be long, look for these cheaper prices to come in and you can always use those profits from earlier on in the cycle. Again, I’m just bringing this in to highlight, again, some of these short-term forecasting tools from the neural index and how they can give you that broader sense of what’s going on in the broader S&P and NASDAQ indexes. Because certainly when you have a big company like Apple, you see that neural index bullish here. But for the past three days, very bearish, and helping you with that short-term trading and understanding what’s likely to occur here, should we be looking for selling at the high end or looking for cheaper prices to get that exposure to the marketplace.
We’ll go ahead and leave it there. Once again, this has been the Hot Stocks Outlook for July 1st, 2022. Thank you all for watching. Best of luck and bye for now.


