Register for a Free Live Training
The Hot Stocks Outlook uses VantagePoint’s market forecasts that are up to 87.4% accurate, demonstrating how traders can improve their timing and direction. In this week’s video, VantagePoint Software reviews forecasts for CarMax ($KMAX), Hess ($HES), Phillips 66 ($PSX), Schlumberger ($SLB), Square ($SQ), CRISPR ($CRSP), Zoom Technologies ($ZM)
Hello again traders and welcome back to the Hot Stocks Outlook for January 7th, 2022. Hope y’all are having an excellent week out there in the financial markets and as always, plenty to cover in today’s outlook, really a lot going on to kick off the new year here.
So we’re going to start out looking at shares of CarMax, but then we’re going to focus more generally on specific areas of the market. So we’ve got Hess, Phillips 66 and Schlumberger. So a group of energy stocks there. And lastly, we’ll look at Square, CRISPR Therapeutics and Zoom. So some quicker moving growth stocks there.
But starting out here with shares of CarMax. It’s a really good example of how to use the software regardless of bullish, bearish, however you’d like to trade the markets.
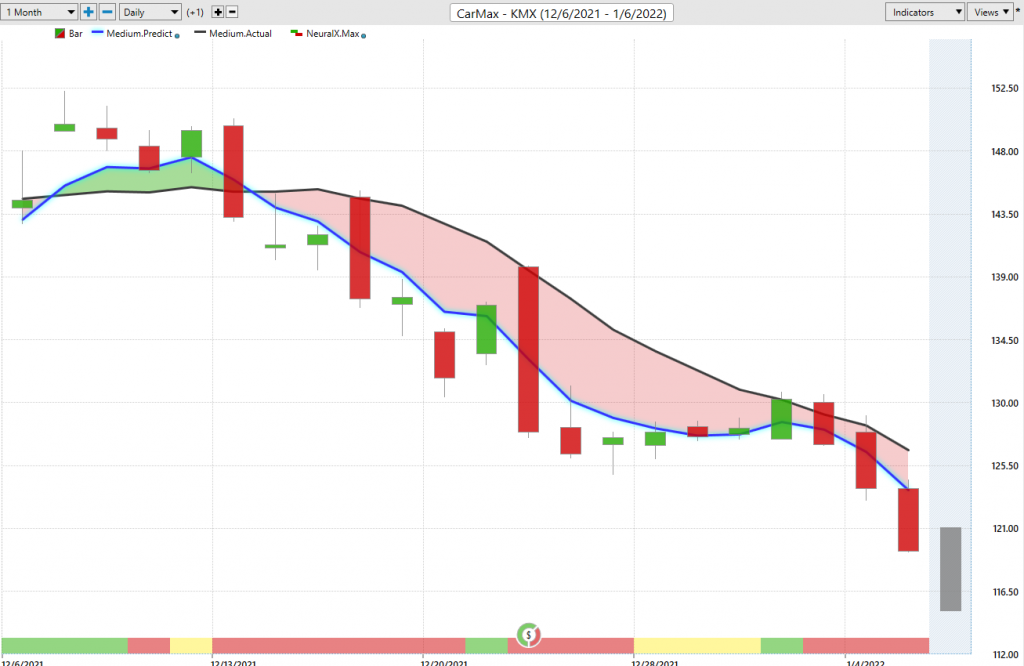
So specifically in shares with CarMax here, what we have here is daily price action. So each one of these candles is a full and complete trading day from open to close and what we have right up against that price data, you’ll see there is a black line and also a blue line. Now the black line that you’re seeing there, that is what is referred to as a simple moving average. It’s a very common technical indicator. In this case, that simple moving average is looking back over the previous 10 closed prices. It adds those all together and then divides by 10. And what that does is smooth out the existing price action and let us as traders know well, where is the market been over a given period of time?
The problem though is traders is we need to be ahead of the next move. So we need to understand where are prices likely to move going next. And so what we’re able to do is compare that black value or what you might think of as a lagging simple moving average to this blue value, which to be generated and calculated every night and then plotted against that chart for the trader, that’s where vantage points technology of artificial neural networks come in. And they’re doing specifically what you’d refer to as intermarket analysis. And it’s very important to understand that when we look at the S&P 500 crude oil prices, ETFs, there’s very important market relationships happening and very important clues that can be pulled out of that price information. However, you really need computers that are able to handle huge amounts of data and artificial neural networks are good at not only taking in that huge amount of data, but then making predictions on what’s likely to occur next.
And so what’s happening is rather than just looking at the past prices of CarMax like traditional technical analysis is the software is looking at intermarket relationships that are taking place in those markets like I discussed, like individual stocks, ETF groups, the broader S&P 500 or NASDAQ, things like the commodity markets, whether they be gold, oil, commodity markets like the grain markets and also global interest rates. Global currency markets like the value of the dollar, the Japanese yen. So all of these things are very important and affect individual stocks and what’s happening as a software understands specifically in the case of CarMax, what are those important market relationships at play here? And what we’re able to do is take that information and actually generate true price predictions. And it’s those price predictions generated via that technology and that inner market approach that are then used to really weight these indicators.
Rather than having an indicator that just looks at the past, this is actually using that predictive price to create a forward looking predictive metric for traders to make better trading decisions. So in the case of the predicted moving average, it’s very simple. As long as that blue line crosses, in this case below the black line, suggesting average prices are going to start moving lower. And you see you’ve gotten a 17% decline here in the past 16 trading days and shares of CarMax. So 100 shares there has about $2,500, just to the downside. An option track for 100 shares, there’s going to be about $2,500 of value as that market moves lower. Now what’s important to understand though is that’s not it though, right? It’s not just that blue line crossing the black line. There is more nuance to this overall forecast that traders can use to get even more of an edge on what’s going on in different timeframes.
So if we look at the very bottom of the chart, you’ll see that there’s this bar that goes from red to green, back to red. And what this is doing is again, updating every single trading day. So this has been the most recent update here and it’s predicting very short term strength or weakness over just the next 48 hours. So it’s not tuned to look at average prices moving forward, but it’s simply looking 48 hours at a time and judging whether there’s short term strength or weakness over that time period. Now to round out this predictive forecast, you’re also given an intra-day predicted high and predicted low level before each and every trading day occurs.
And you see, week after week, we go back and we look at how accurate all of those prediction were, but it’s not just about one prediction. It’s about that updating and adaptive forecast that helps traders make those better trading decisions each and every day that they’re involved in potentially managing that opportunity in the marketplace. And we can see how this works and there’s a lot of different strategies that would benefit from this, but if you have limit orders waiting at these levels in cases like this, you’re going to be getting filled on the open on these gaps up that immediately trade lower and move in the direction of trend. So if you have a strategy that’s going to deal with the appropriate timeframes of neural index for warning of some bullishness and of course tune your entries as far as limiting your risk and understanding what you’re kind of giving up to get into some of these opportunities, but then being able to make the most of those opportunities. So, yes, the market is down 16%, but with numerous entries along the way to really exploit that to maximum potential here.
Now, I just wanted to highlight some more recent things, go back in previous Hot Stocks Outlook. We have some of these longer term moves. We’ve highlighted over the previous several weeks, but more recently we’ve seen energy shares turn higher here. So here we have shares of Hess, Phillips and Schlumberger and you’ll see how similar all of this looks. And this is why this is extremely effective because when you have tools like the Intelliscan that are actually able to scan for you and identify that hey, the neural index is bullish, that crossover has just come through one evening ago, letting you know that hey, there’s something going on potentially in energies. But if I want to trade that, I have the roadmap moving forward, not just for the next day, but the subsequent several days that I might be involved in the market.
So we see here in Hess, we get that blue line crossing above the black line. We can, again, look towards those predicted highs and lows, which again are ahead of the market every single trading day here. So we’ll get a real trading day that’ll fill in what that prediction was. And these are all the previous predictions against the actual market data. So when you have that directional bias and you have this roadmap here that says hey, expect the market to move lower over the subsequent 48 hours and you see you get some lower lows over that time period, but in today, you know where you should be looking for price levels to go ahead and exploit the long side. And this has been very important as we see a lot of crossovers moving to the upside as far as blue line crossing over the black line and we’ve gotten to move here in energy.
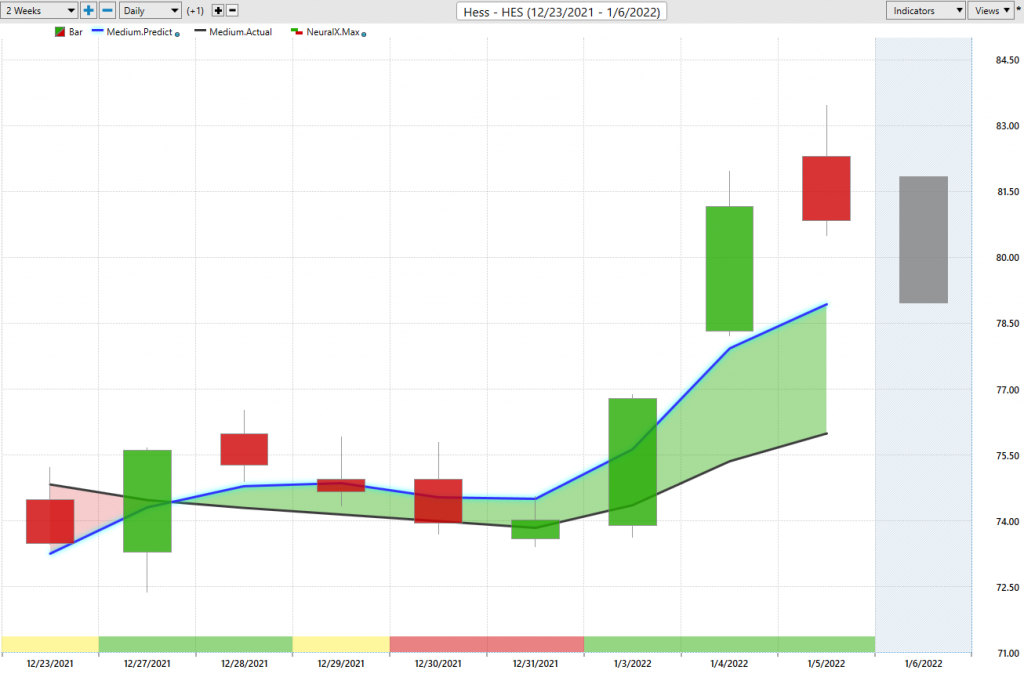
So it’s become very clear going into the early part of the year here on a 10% move higher in shares of Hess and these things are very bullish as far as trend and that short term forecast. So as far as the past couple weeks here, been very clear if you’re looking for long opportunities where that might be, but also where you might be avoiding in some areas of the market.
We’ll go ahead and highlight some of that as well, but here’s Phillips 66. So you see the difference in the individual forecast, but the software doing a good job at saying look, something’s going on here as far as these predicted moving averages and trend moving to the upside, but then when it comes to that individual forecast, you’re going to of want those tools to say okay, well, as far as this market in particular, where do I want to be looking towards those predicted lows to really make the most of this?
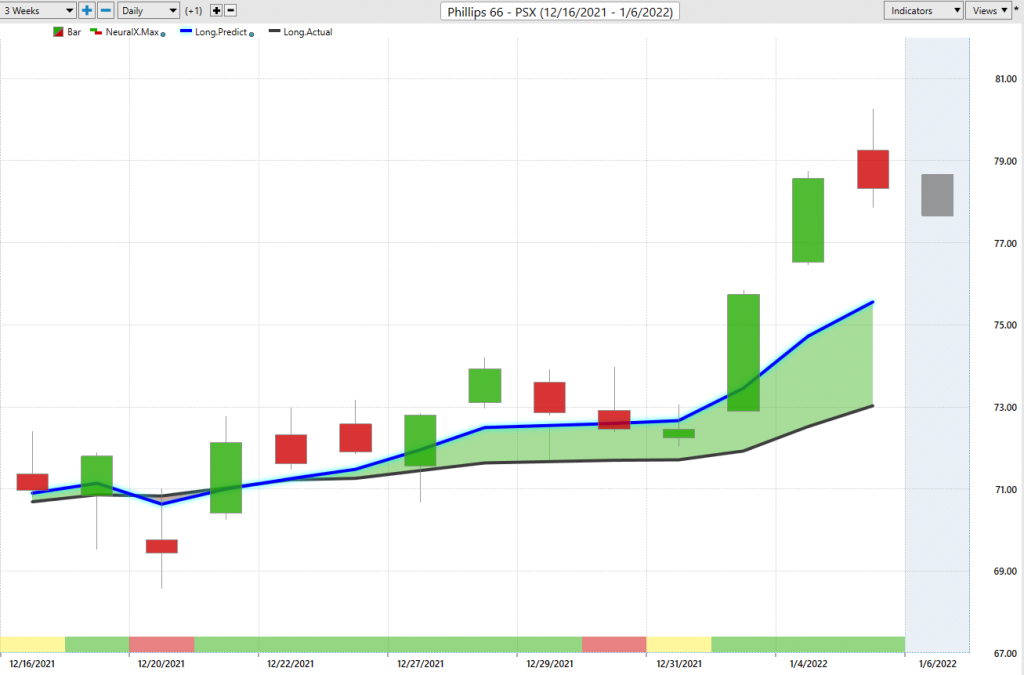
And so when the big macro forces at play really start moving crude oil and energies and things start moving around, well, you’re already in position to benefit from that both on the bigger macro level because you identified that in the marketplace, but also on the very short term level to make sure that you’re getting good entries as far as price is concerned. So here we have, again, another 9% advance. It’s going to be very similar moves here.
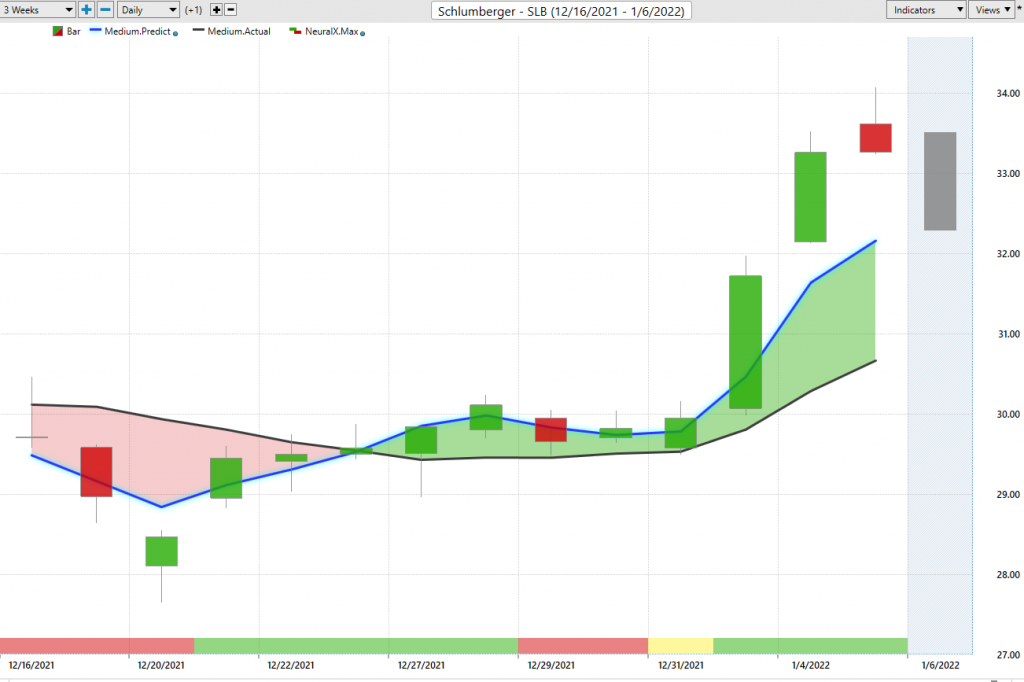
Here Schlumberger. So I just wanted to highlight the difference in the nuances here. The crossovers are going to look very similar. They all come through at the same time indicating that oil looks to be getting bullish here as far as the timeframe of these trending indicators, but you see the neural index get bearish here, you get a little bit of weakness, but you’re going to have intraday levels to guide you.
And so it becomes very clear that look, if you want to hold onto this market, it’s telling you expect the market to potentially trade down at these predicted lows. So if you want to stay long, well, you may have to deal with that. Neural index gets bullish here and market picks up and predictably about a 10% move just like those other shares. Now, I want to go ahead and transition over here to Square.
And so there’s just some things we’ve identified as far as some areas of the market, which potentially may set up with really great opportunities to the upside, but here in shares of Square, you see this longer term forecast has 43% declined here in the past 45 trading days, but more importantly about how you might manage these situations. And so when you understand that okay, energies might be turning higher, but there’s still some issues in at least areas like Square, not only in the short term, but just over the long term here, right?
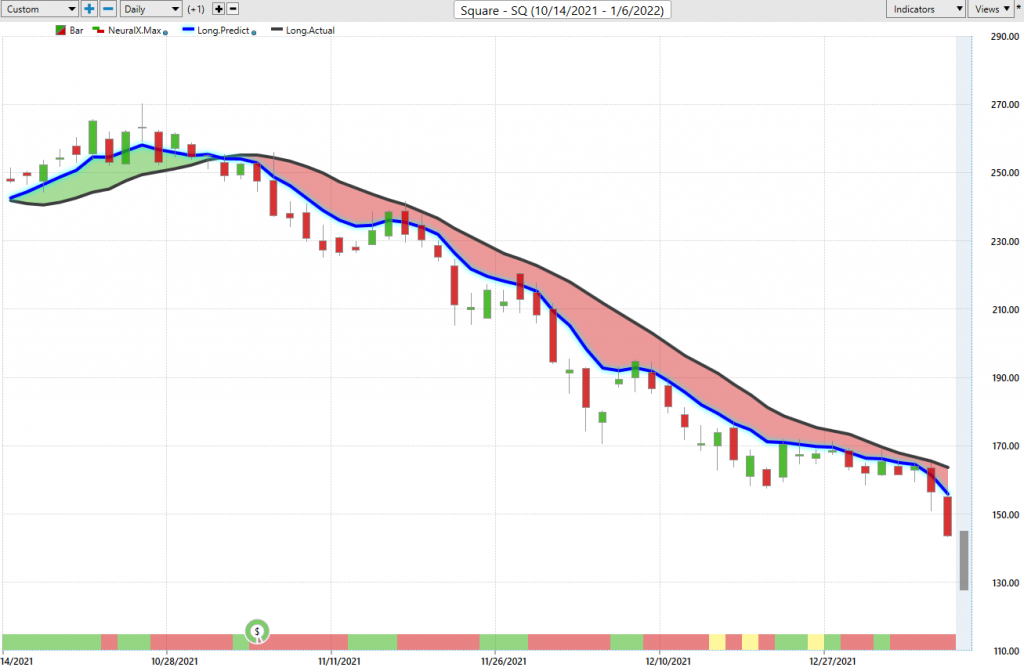
We got all these levels coming in, not just the first day here, not just the first entry into the market, but the adaptive qualities of a tool like this to help you keep making good trading decisions, staying on the right side of the market and exploiting things in the appropriate direction. I keep each week coming in and highlighting days like this where you come out of the area there, but oftentimes you see this where all the bearish price action comes in on the previous day and you’re coming into the previous predicted high hitting that level and continuing on. The bigger point is clearly you’d only want to be short here taking advantage of that 43% and pretend actually being a little heavier when you’re up at these predicted highs, as far as that exposure in a market like that.
So when you understand what’s going on in some of these bigger growth areas of the market and that there’s some issues, well, you can use some of the shorter term forecast to come in and say okay, well, where are we seeing crossovers really in the opposite way that we’re seeing them in Hess and some of the energy space? Where are we seeing some weakness?
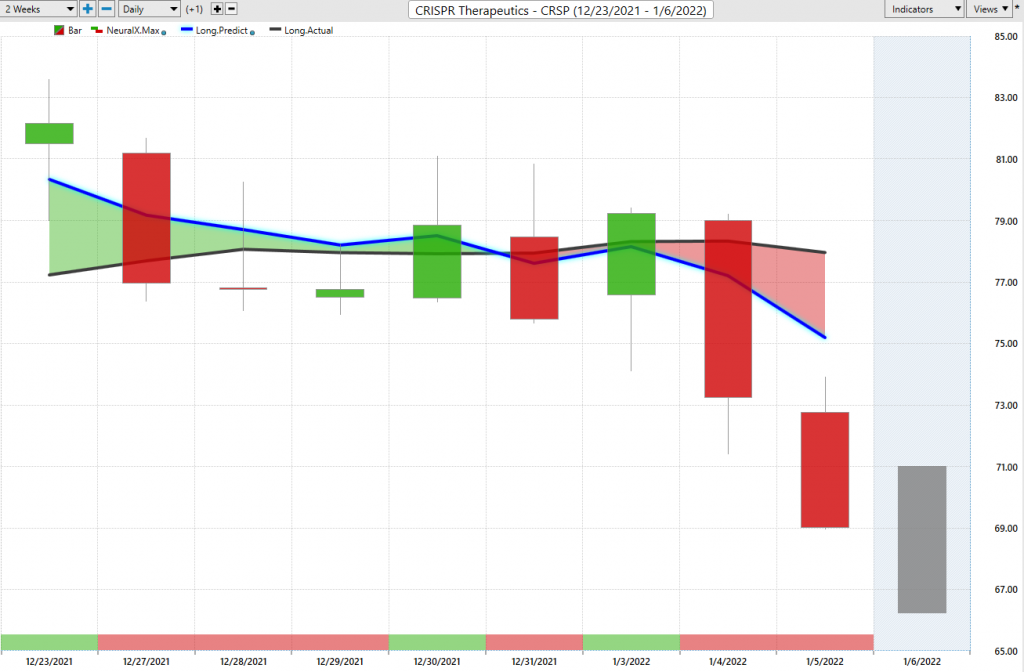
And so here you see CRISPR coming into the beginning of the year. This stock moves a lot. There’s a lot of attention around this stock, but clearly the trend forecast. Here, the blue line crossing below to the downside. You see the neural index getting bullish, bearish, bullish. Well, you’re getting sideways price action, but the bigger move is to the downside. And clearly you’d want to exploit things like the predicted highs if trying to potentially get short in some of these areas.
So you see a lot of the correlations playing out and that really driving where you might want to use some of the short term forecasting to make some trading decisions. So here we see getting some pretty aggressive declines here and shares of CRISPR. And I wouldn’t be too surprised in the near future if we see a lot of these things reverse, but right now the past five trading days, you’ve got 12.5% decline.
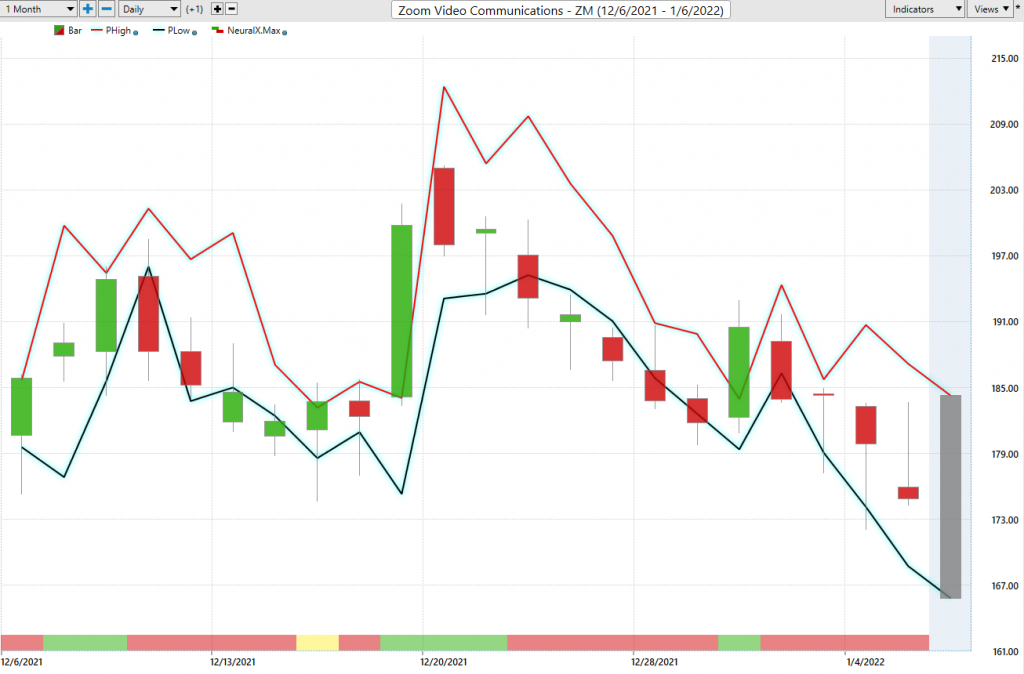
Here’s Zoom video, a very similar picture here. Crossovers to the downside. So clearly some areas where you do not want to be belong. And again, I just want to highlight these areas here where it’s all bearish this day, but it picks out these levels in these short term timeframes to know that all you’d want to be doing is potentially shorting the market, taking profits on those short positions, at least in some of these areas of the market where you’ve identified, again, that weakness.
So really great opportunities opening up. We see things shifting all the time. Some of these longer opportunities still straight through the new year just continuing to trend, but some of these shifts potentially opening up and already seeing some really aggressive moves just over the past few days. So once again, this has been our Hot Stocks Outlook for January 7th, 2022. Have a great rest of the week, great rest of the trading year. Thanks again and bye for now.