Register for a Free Live Training
The Hot Stocks Outlook uses VantagePoint’s market forecasts that are up to 87.4% accurate, demonstrating how traders can improve their timing and direction. In this week’s video, VantagePoint Software reviews forecasts for CF Industries Holdings ($CF), Nvidia ($NVDA), Hanesbrands ($HBI), Genuine Parts ($GPC),TESLA ($TSLA),
Hello again, traders, and welcome back to the Hot Stocks Outlook for January 6th, 2023. Hope you all are having a excellent week out there in the financial markets. And as always, we’ve got a lot to cover here in today’s Hot Stocks Outlook. So if you haven’t already, before we go ahead and get into some of these opportunities, make sure you go ahead and click on the link below in the description. You can get a live demonstration and a lot more of the specifics about how this underlying technology can really help you make better trading decisions in the financial market.
CF Industries Holdings ($CF)
What we’ll do here, we’ll start out. We have shares of CF Industries. We have NVIDIA here, Hanesbrands, Genuine Parts, and lastly, Tesla. And a couple of these we keep bringing in so that you can see those updated forecasts. So for example, NVIDIA, Tesla, some really popular companies. This is what it’s really about, is really identifying these big shifts in the market, but then benefiting from these updated forecasts that are getting updated every single evening for traders.
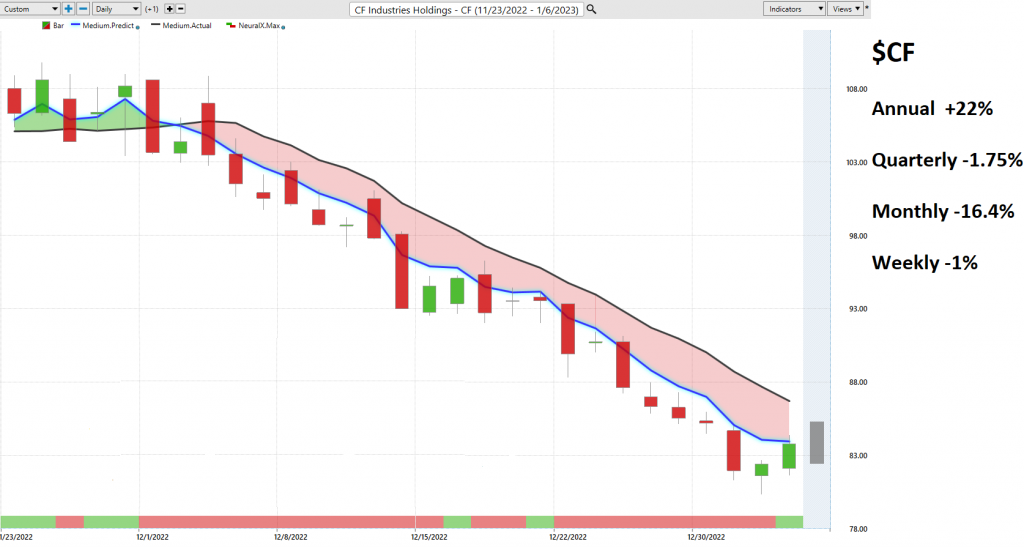
Let me show you how this works with CF Industries. What you have here is daily price action, right? So each one of these candles that you see on the screen represents a full and complete trading day. Right up against all that price data, what you’ll notice is there’s a couple of values there. There’s a black line and a blue line right up against that daily price action. So the black line that you’re seeing there, that is actually a simple moving average. That’s actually a very common technical indicator. No technology going into this. Pretty simple calculation as far as looking back at the previous 10 closes in this case. It’ll add those all together in divide by 10.
What that does is smooths out the existing price action for traders, but obviously traders don’t need to know where the market has already been. They want to know, where’s the market likely to head next? So what we’re able to do is actually compare that black lagging moving average, or simple moving average, and we compare it to this value on the chart. For this number to get plotted and calculated … Essentially, this number is a prediction of average prices moving forward. Well, for that number to get provided for the trader, this is where the technology of artificial neural networks perform what’s called intermarket analysis on the target marketing question that you’re trading. So in this case, CF Industries Holdings.
What the technology is able to do is understand how other markets are known to drive an influence, in this case, future prices of the target market. Now, that can be really obvious things like, “Well, what is the S&P 500 or the Nasdaq doing?” But things like the global dollar index has had a huge effect on the broader markets, on gold prices. So that comes into play as well, but you have to think a little bit more deeply. Well, there’s ETFs where a lot of capital comes in and out and certainly shares some very important market relationships with either tech or financial stocks, whatever specific area of the market that happens to be. And then it gets all the way down even to individual stocks, right? So individual companies that share positive relationships, inverse relationships. Some of these are leading and lagging relationships in price.
This is where the technology of artificial neural networks is able to look at all of this and understand how are these other market dynamics affecting, again, that target market that you’re trading. It actually generates future price predictions based on that information. So then rather than having tools that are entirely based on what’s already occurred in the past, what we have here is a forward-looking predictive tool. So in this case, whenever that blue value, or what we call the predicted moving average moves below the actual moving average, well, it’s suggesting average prices are going to move lower. And as long as that value remains below that black line, well, the overall trend we can think of is forecasted to move lower.
Here in CF Industries, you see there’s about a 21% decline after that crossover move to the downside, and it has remained to the bearish side there. Now, as we work through some of these other charts, you’ll notice we have this indicator at the bottom that goes from green to red and back to green. We also have a predicted high and a predicted low all the way at the right-hand side of the chart that helps traders set limit orders, profit targets, and really navigate short-term price action.
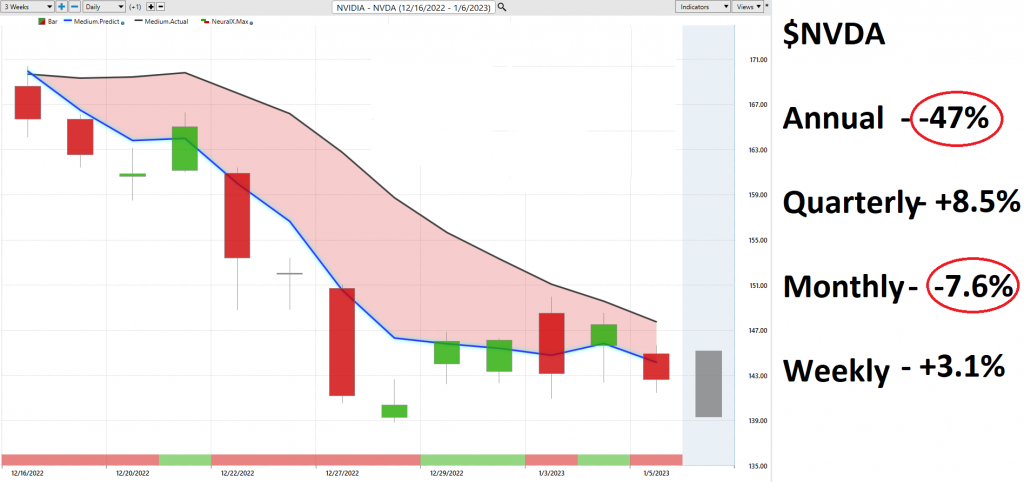
Let’s move forward to NVIDIA and take a look at some of those shorter term indicators. We keep coming back to NVIDIA. It’s very popular stock obviously, along with Tesla. But the point is to understand that these forecasts are predictive, and they update every single day. So for the past week here in NVIDIA, well, we can see that the previous week was a lot more bearish. You had your crossover to the downside. The neural index is very bearish through here. So this is how this works, is that this bar at the very bottom of the chart is tuned to solve a different problem for the trader, and the problem is really short term over the next 48 hours’ strength or weakness in the market. So when this neural index signal is green, it’s suggesting that there’s essentially an 80-plus percent chance that average prices will go higher over the next 48 hours, but the overall trend you want to keep in line with that overall blue line below the black line.
You’ll see here that there’ll be these times where, in this case, the neural index goes bullish. The market quickly goes back bearish and continues lower. But like I said, this gets us right upwards of 80-plus percent accuracy over really all market conditions, whether it’s earnings reports, Fed announcements. So this is how traders can understand that, “Okay, well what’s the bigger picture here?” Well, the overall trend is down. You may get a little blip here, but you see very quickly that do you want to be going long? No, you want to be shorting, taking profits on shorts. You see again that neural index gets bullish. Here you see we start getting that sideways price action. And of course, we can use tools like be predicted high and low here. So this is how this really all works together to say, “Okay.” Well, if you understand that you’d only want to be short, and then you can use the short-term forecasting on top of that to maybe adjust your position or get better entry prices, well, this is how this works, right?
Here in NVIDIA, we can look at those predicted highs and lows just really over the past week, because we’ve already seen these previous weeks here. But you see how this works where it says, “Okay. Well, expect the predicted low range to move up.” You see we get that move to the predicted high. Every day it’s updating, saying, “Okay. Well, expect some strength over the next 48 hours, but also expect the market to move up towards these predicted highs.” But do you want to be long? Well, very clearly, no. The blue line is still very much below the black line, and therefore you’d want to short, take profits on shorts and make money that way is going to be a lot easier, right? So here we have shares of NVIDIA off another 13, 14%, but just this past week, some really advantageous prices to get more short positions and make money this week as the market moved lower.
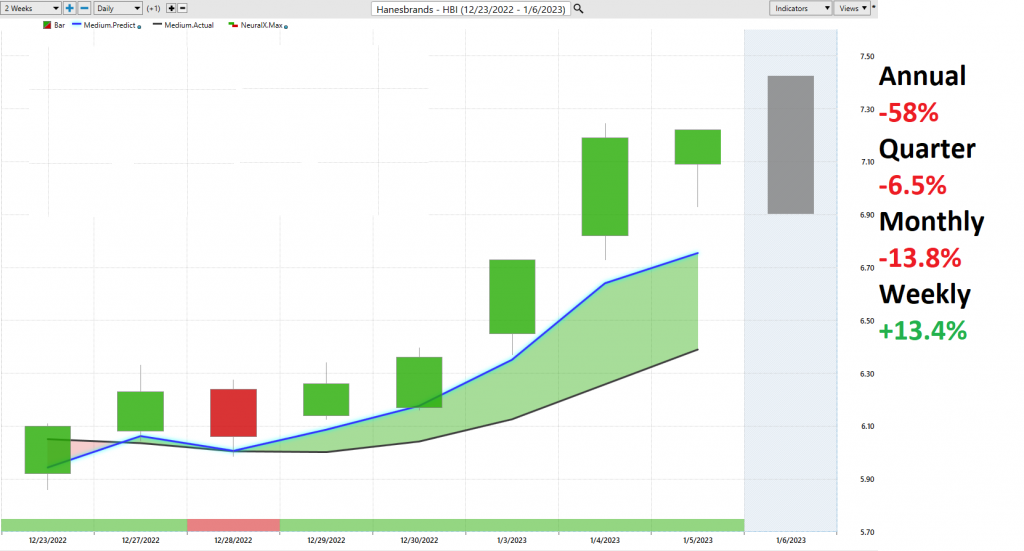
Now, I wanted to bring in, here’s an example of Hanesbrands. Typically, actually, when you have a very weak market, you sometimes get these surprises, right? Some markets that typically haven’t done all that well actually start showing some crossover to the upside and start moving higher. You want tools like this because, well, where might you be trading? Maybe you’re trading NVIDIA. Maybe you’re trading Hanesbrands. But what you need is that information that says, “Okay. Well, after the forecast on 12-27, Hanesbrands has a crossover to the upside.” So if you’re looking for weakness in the market, well, we’ve clearly identified areas where that weakness is present, but now for the past week and a half in Haynesbrands, well, that blue line has been above the black line. So then we can look more closely at the forecast and understand that. Well, this is getting updated every day. It’s letting you know, “Here’s the predicted high and low for this trading day. Here’s the predicted high and low for this day.”
This all comes in before the trading day occurs, at 6:00 PM the night before. I mean, literally 15 hours before the market opens you have these levels that you can prepare for the next trading day. So traders who are trading Hanesbrands understand, “Well, if anything, you want to be a buyer down here at these predicted lows and target the predicted highs.” And you see that, well, in this case … Not many cases. We’ve had a lot of weakness in the market. But in this case, markets up 18% in the past six trading days. So this is where you want to be on the right side of this, shorting the right things and making money as that generalized weakness comes into shares.
You can also see that generalized weakness with features like the IntelliScan. We looked at this a little bit last week, and what it helps traders do is actually see these predictive indicators crossing right as they create those signals. So if you want to set these to look for fresh crossovers that crossed the night before, or you can look for markets that are already established and in trend. It makes it easier for traders to identify markets that meet those tradable conditions, but those conditions are based off of these predictive forecasts to help you make better trading decisions not just for the day you might be getting into the market, but for day after day, after day, after day. This is why we come in and update these forecasts so traders can understand.
When you look at the Hot Stocks Outlooks over the past few weeks, they’ve been very bearish, highlighting the blue line below the black line and all the bearishness that we’ve seen. But, we can still update those forecasts and get that updated information. So if the market shifts, we can go to the long side. But if they stay bearish, we want to keep expressing that bearishness within the portfolio.
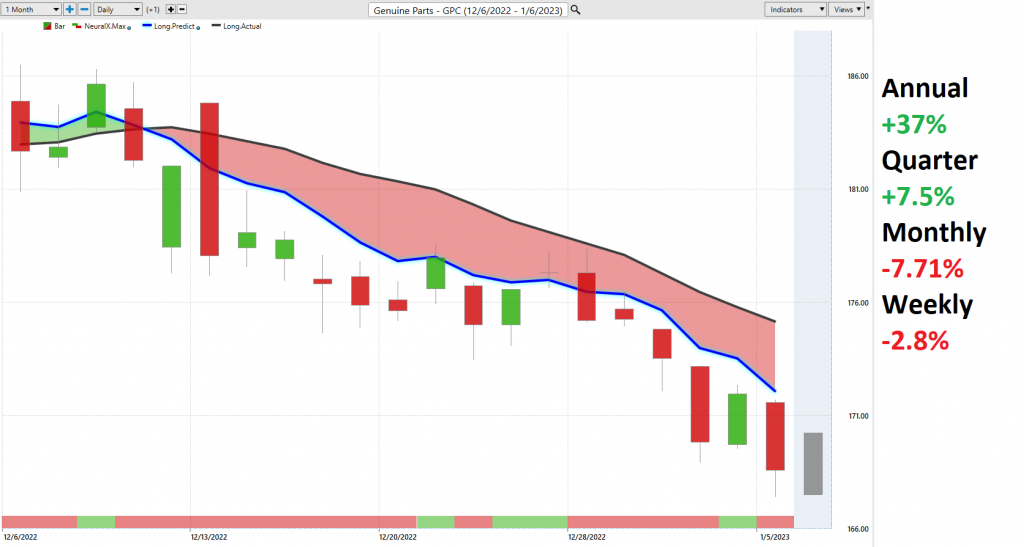
Here’s Genuine Parts here. You see this blue line crossing below the black line. Also notice the neural index. Very bearish over this really long two weeks of time where the market just grinds lower and lower, but it does get bullish here, and you see the market runs sideways for a period of time. But do you want to be getting long? Well, no. See, the blue line is still very much below that black line. You see the neural index gets bearish once again, and that momentum now accelerates to the downside. So again, you see the last five trading days here. Very, very bearish when compared to something like Hanesbrands, which is a complete opposite forecast.
Again, we can look at over the duration here, how these predicted highs and lows held up. This is the whole point, is that you have these levels before the trading day occurs. So potentially, you can have limit orders just waiting up at these predicted highs that get filled at whatever time is appropriate when that level gets hit, and then that overall trend continues lower. You see here one, two, three, four, five, six entries on the predicted high as the market keeps going lower day after day, after day, over longer period of time. So if you’re in there and have the tools and say, “Okay. Well, I know I want to be short. Well, where should I be short?” Well, you’ve got those predicted highs to guide you on the way down, and you see about an 8% move lower over the past 18 trading days with an extra five or six entries to keep shorting among that 8% decline.
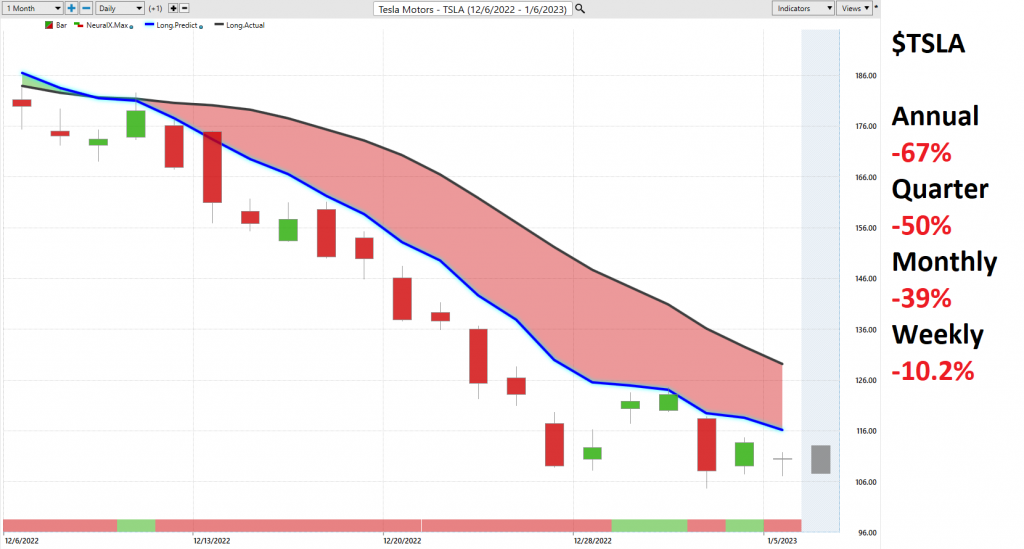
Lastly, here’s shares of Tesla to round things out. A lot of people get excited about Tesla, but what’s more exciting is having a tool that’s consistently accurate so whether you’re trading Tesla or Genuine Parts or NVIDIA, you have reliable information to make good decisions off of. Here again in Tesla, we can just update the last five trading days, because pretty much it’s been every five days we come and bring this in and update the forecast. But the point here being, “Well, what’s happened?” Well, blue line’s still below the black line, but look at these predicted highs and lows. So this, again, the trader has all of this information that is clearly saying, “Well, if you’re going to short or do anything here, short up at these predicted highs. Let’s take profit that way. We already hit the predicted lows here. The momentum’s moved to the downside, but that’s been a much easier place to trade this week rather than trying to get long in the S&P or force things that simply aren’t there.”
Here again we see a really nice move lower, about a 38% decline in just the past 20 trading days. But again, another 5, 6% decline here just over the past week here. When you have the right tools, and then the information will just keep updating that valuable information coming in. It’s not, again, just about recognizing that first day the crossover comes through. That’s important. That’s where the scan’s going to make it really easy to see those big directional shifts in the market and what sectors are starting to move, but what may be more important is adapting to those changing market conditions. If the market is still in a downtrend, well, you want to keep expressing and managing that position. So this can be very effective, especially when you do get in at the right time to really make the most of those opportunities, actually build a large position and make a lot of money in high volatility periods like this.
Once again, we’ll go ahead and leave it there for today, but this again has been our Hot Stocks Outlook for January 6th, 2023. Thank you all for watching. Best of luck, and bye for now.