


Hot Stocks Outlook for the Week of
February 5th, 2021
The Hot Stocks Outlook uses VantagePoint’s market forecasts that are up to 87.4% accurate, demonstrating how traders can improve their timing and direction. In this week’s video, VantagePoint Software reviews forecasts for Amarin Corporation(AMRN), Overstock(OSTK), Dick’s Sporting Goods (DKS) , The Children’s Place(PLCE) and Viacom (VIAC)
Register for a Free Live Training
This Week’s Hot Stocks Outlook
Hello again, traders and welcome back to the Hot Stocks Outlook for February 5th, 2021. Hope you’re all having a excellent week out in the financial markets and as always plenty to cover this week. So we’ve got shares of Amarin Corporation, Dicks Sporting Goods, which have covered over the past few weeks, Overstock, Children’s Place, and lastly, Viacom. So some really good examples of how this software and these tools work to really help you manage a trading opportunity, really, regardless of which market that you’re trading.
Amarin Corporation(AMRN)
But starting out here with Amarin Corporation. What we have here is daily price action. So each one of those bars represents a full and complete trading day. And you’ll see right up against that price data there is a black line there and also a blue line. Now the black line is really our measure of where market prices have already been, that’s actually a simple moving average that looks back over the previous 10 candles, obviously adds all those close prices together and divides by 10, and it’s a good measure of where market prices have already been.
But traders obviously need to be ahead of the move and so what we’re able to compare that value to is actually this blue line. And so for that to be generated and plotted against the chart, what VantagePoint is doing is utilizing its technology of artificial neural networks, type of artificial intelligence, and it’s actually looking at relationships between markets. So it’s doing what’s called intermarket analysis. And what that means is rather than just looking at the past price of Amarin and sort of smoothing out that data, like a simple moving average does. What it’s doing is it’s looking at relationships between Amarin and other individual stocks, it can be other ETFs, also really important things like the futures and commodity markets, like the S&P 500, global interest rates or global currencies as well. And it’s able to understand those really leading and lagging relationships, those positive and inverse correlations. And it takes all of that inner market data and actually generates predictions. So future predictions of average price moving forward, which haven’t yet occurred, and it uses those predictions and actually build it into the value of this predicted moving average.
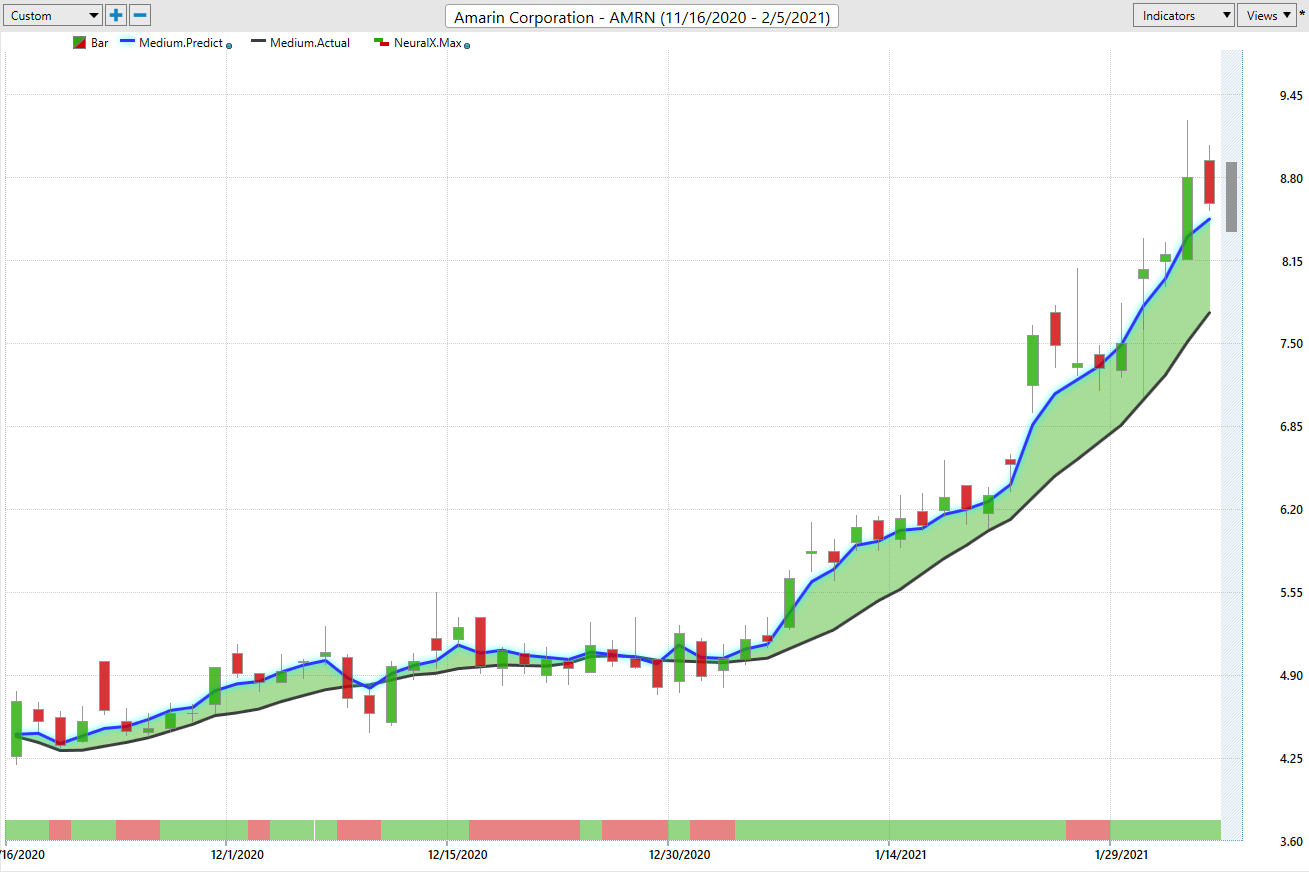
So rather than having a lagging indicator, that just looks at where the market prices have been, here we have a forward-looking predictive tool. Now, in addition to that predicted moving average, though, you’ll see that there is a bar at the bottom of the chart here, and this every single trading day gets updated either green or red. And what it’s doing is actually looking ahead 48 hours. So it’s really tuned to just be very short-term strength or weakness in the market. And again, to the right here, you’ll see this shadow candle here. And this is actually looking intraday at a predicted high and a predicted low. Again, rounding out the entirety of that forecast of overall is the predicted moving average above or below the actual moving average, is there strength or weakness over the next 48 hours and what’s the volatility like as far as the predicted highs and lows. And so what we can look for are these situations where that predicted moving average, in this case is above the actual moving average, you see, going back to December 30th you get a crossover of those two values. And we actually have tools here within the Intelliscan that allows you to identify new trading opportunities or really finding trading opportunities that are in an uptrend or aren’t a downtrend. So you can go in and manage those opportunities with the help of these shorter-term tools.
But you’ll see here that their neural index gets bearish here. You get a little bit of sideways, but once that all straightens out, the overall trend of strength returns to the market, you see it again here with some weakness over the neural index. But that distance between the blue and the black line signaling at the overall trend is strong and you’d want to go ahead and get involved. Now we can also look at how accurate those predicted highs and lows were against the subsequent price action. And you can see that you’re not going to get down there every day, but if you’re willing to buy at, or near that predicted low, you should be getting a good overall entry and then continue to execute that overall trading style here.
So you see here about seven or eight entries, as this market moves higher, but overall from the beginning of that move a seeing really nice rally to the upside. So if we look at this, we’ve got about a 79% move as being a very cheap stock. But regardless of if you’re trading a cheap stock or you’re trading Tesla or whatever it might be, you really have to have those tools that say, okay, well, what price is acceptable to get involved here? What sort of trading strategy am I going for? And taking some of these predictive indicators and really tying them to the timeframe of your trading and your overall approach.
Dick’s Sporting Goods (DKS)
Now here’s, Dick’s Sporting Goods. We’ve covered this quite a few times over the past several weeks, there’s actually a big dip in the market earlier or last year. But here we see at the end of December getting this crossover to the upside and overall with these forecasts, you see when that neural index gets bearish, it’s not saying that the market’s going to start moving lower and go into a downtrend, but it is saying expect some sideways or downward movement in the overall trend. But as long as that blue line remains above the black line, the overall move is up. And you see again, here, you get to bearish here and you get some lower lows, so you can really think of it as the overall volatility, you’re likely to see some lower lows over the next couple of days and be prepared to actually scoop up shares at a lower price. You see it again here as it gets bearish, but the overall trend remaining up.
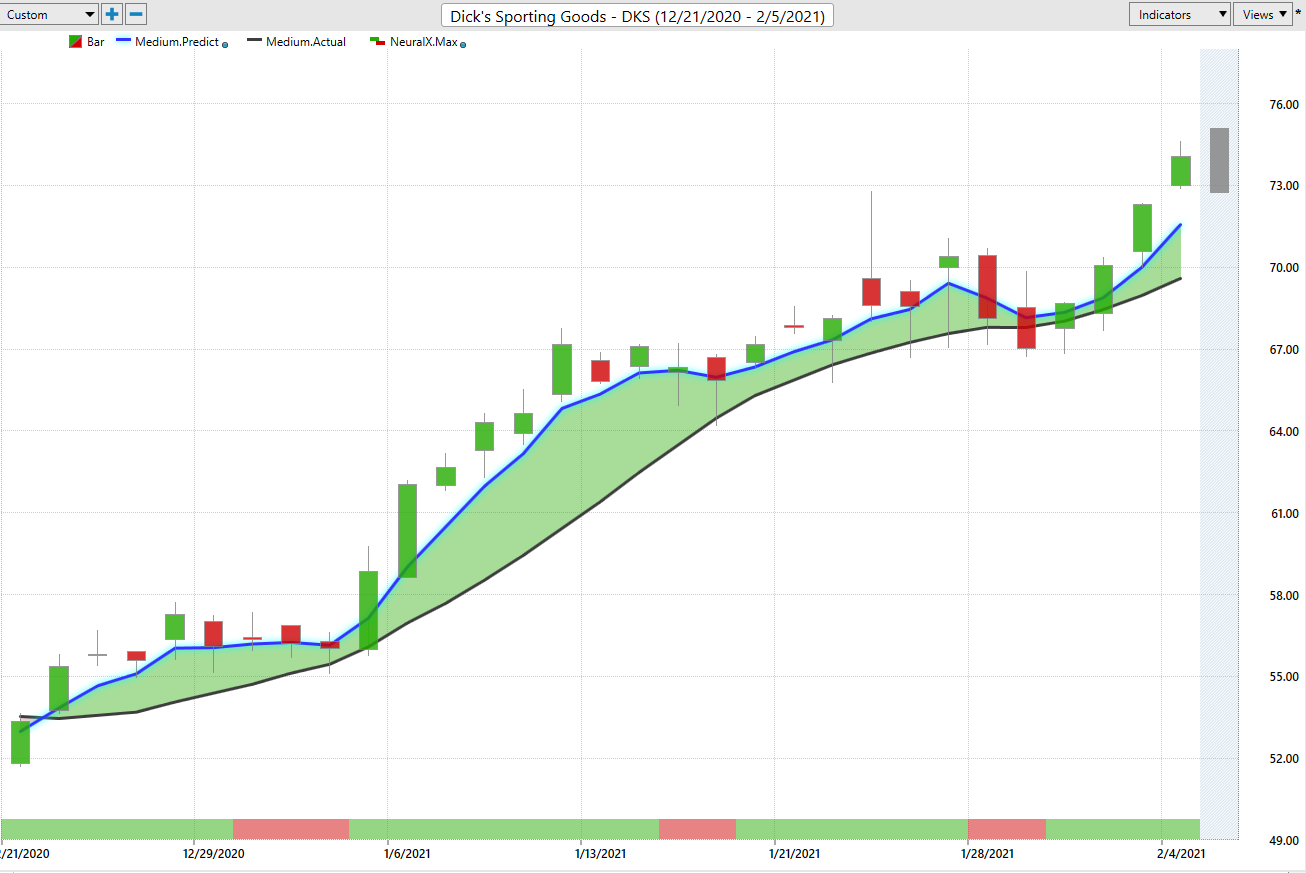
And when we look at again, that overall move, we can say, well overall, we’ve gotten a move, let’s see here, of about 30% in just the past 28 trading days. But obviously as a trader, that’s literally almost a month and a half on the calendar, and there’s going to be a lot of different ways that you may want to approach getting involved in the market. And so when we have those daily predicted highs and lows, you may be buying at the predicted low, taking some profit up here, trying to buy back in at lower levels. There’s a lot of different ways that one can manage these but the big thing is set that directional bias have a reason that, okay, this is where you want to be in the market. And then VantagePoint is going to use these tools, which are very adaptive. They take in those intermarket relationships that are happening and affecting the market, that you’re trading. And as the trade progresses, you want that changing of forecasts to let you know, what should I expect? What sort of timeframe am I working in? Maybe I want to add to an existing position. So you see you get about 30% rally, but plenty of opportunities to be buying at those predicted lows, potentially again, trading options are trading shares against those options. A lot of different strategies here, but you want to benefit and get that overall direction right.
Overstock(OSTK)
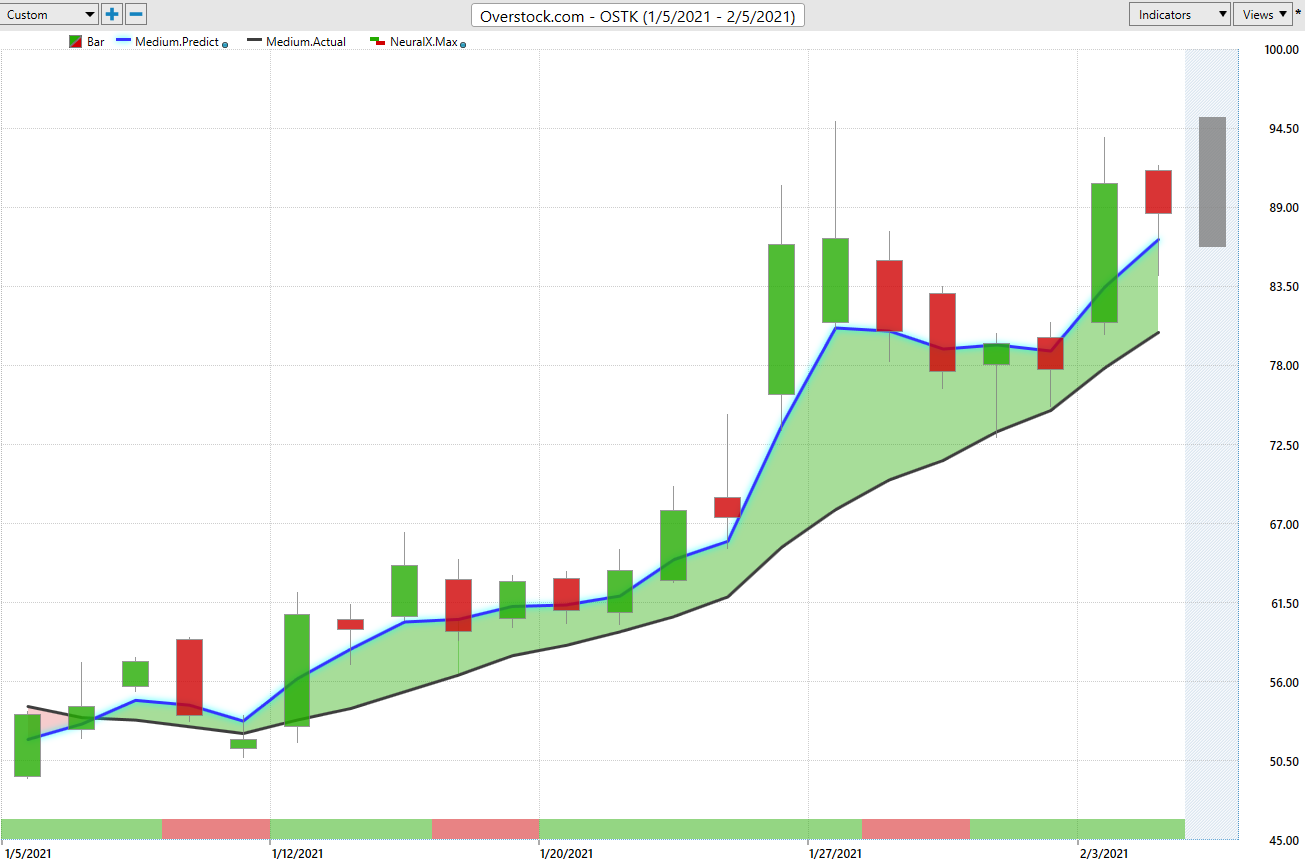
Here we have Overstock.com. Again, you see this crossover to the upside, blue line over the black line. And a couple of these periods where you see the neural index bearish here, you got some weakness and lower lows over the next 48 hours, but those are the areas where you want to actually go ahead and be getting long in the market. You see a once again, you go sideways a dip in the market here with some lower lows over the next few days, but the overall trend is up. And it’s certainly beneficial when you can understand that, okay, well, I want to be buying down at these levels but that’s essentially temporary weakness. That if you’re buying down at those levels, you’re getting a really nice entry and should the market turn around, VantagePoint will update those forecasts. But as long as that blue line remains above the black line, you’re likely getting a very good entry into a market that eventually move higher here. Overstock.com up about 66.4% in just the past 18 trading days. This moving from the 50s pushing up against 90. So a really nice opportunity there as well.
The Children’s Place(PLCE)
Here’s the Children’s Place, a lot of retail actually doing surprisingly well. Things like Gap and Urban Outfitters, some of these areas in the market, well here’s Children’s Place so children’s clothing. But you get that blue line crossing above the black line again, towards the mid point in December, get pretty close here, but you see that blue and black lines still on top of each other, neural index forecasting short-term strength at that point and the market very quickly continuing that uptrend, seeing a lot of volatility. Where again, you get that dip and weakness. But the overall trend very much to the upside.
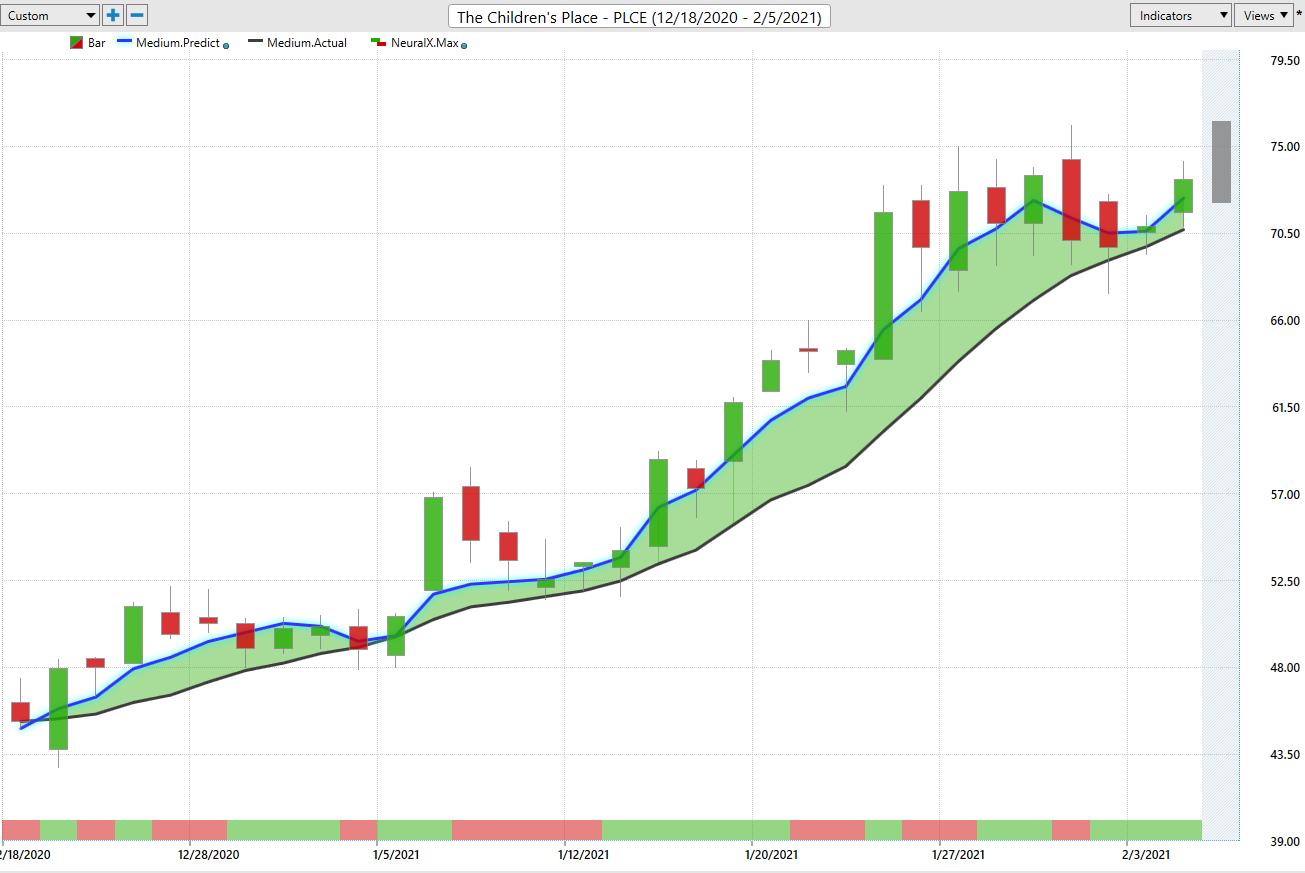
So again, we can take that closer look at the predicted highs and lows. And so when you start a position maybe back here at the beginning of a trend, you want to understand that if you’re taking profit on the upside, where might you want to add back into that position? Again essentially just keep expressing that overall trading approach or working within the timeframes that you like to trade in, but you understand where to get involved and where to be looking on the upside to take profit. So really nice opportunity to here right in the middle of a little bit of a pullback here. But overall, those shares are up 50%. So you really want a tool that, when the market’s moving up 50% in a short period of time, it’s adjusting for that volatility. And even though the daily ranges may be getting wider and wider, well the software is taking that into account and utilizing these predicted highs and lows to really account for that. You can actually see all their predicted highs and lows are much wider around this area than they are back here, as that volatility comes in you want that adaptive tool that’s going to keep you on the right side of things.
Viacom (VIAC)
Lastly, here shares of Viacom. Here again, you get the blue line over the black line, very nice uptrend overall. But in the smaller timeframes, you want to understand, as each day passes here that you may be trading Viacom, where do you want to be looking? And after each day trades, and you see here you get a close a little bit below the predicted low, well, that’s what the software’s good at updating and saying, okay, well the range may slide down a little bit lower here, but the overall trend is up. Days like this are really excellent because if you have a limit order waiting down at that predicted low, while you just get filled right at the open and you see that uptrend resuming here. Same thing here, getting a little fill here, fill here, fill there. Here you have a little volatility as you see the huge range over these couple of days, but then the software again, does a good job at lining up those predicted highs and lows so you can adapt with that position and make the most of that individual trading opportunity here.
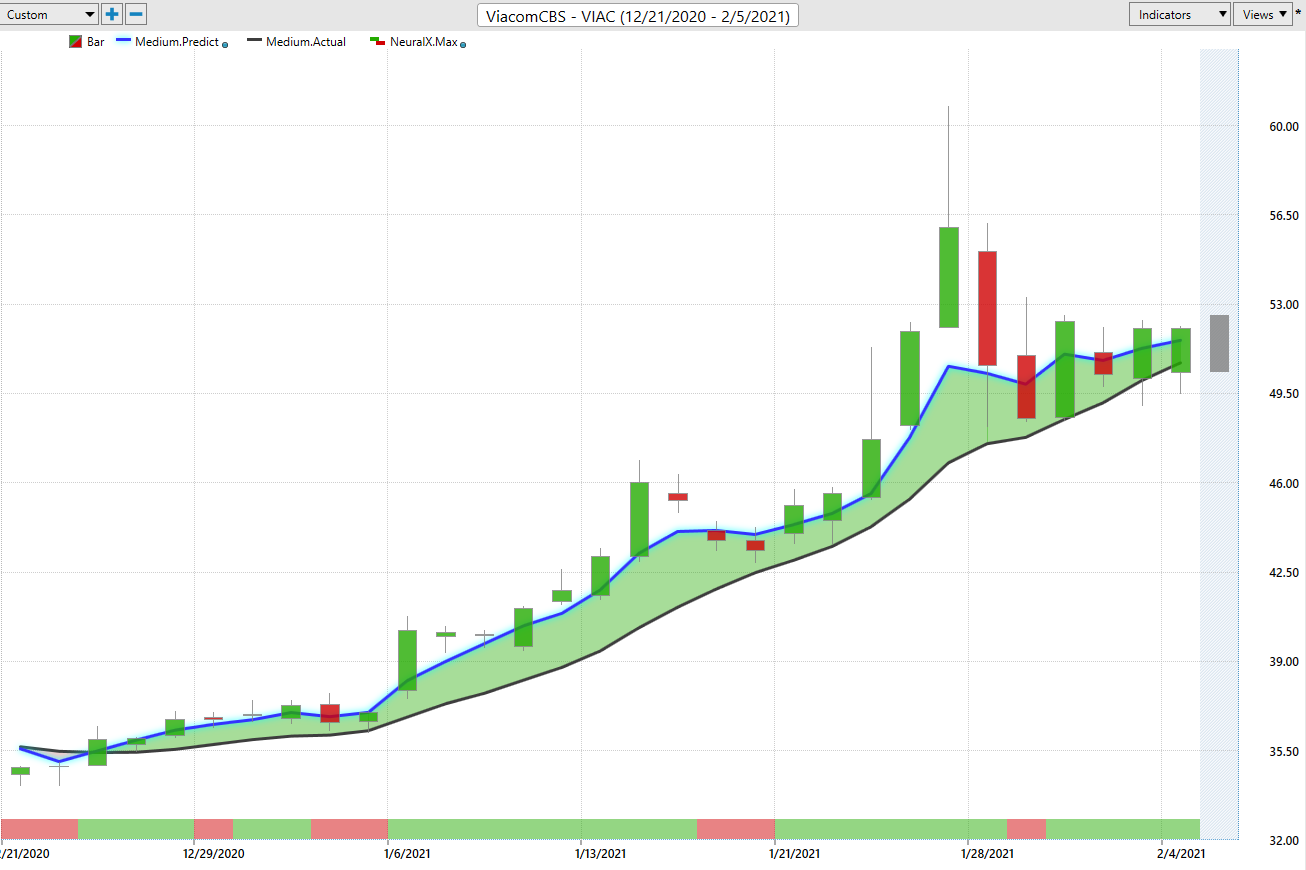
So a lot of markets doing extremely well. We’ve seen crude oil and the overall stock market just keep moving higher. Here you have a rally about 45% in just the past 27 trading days. So many stocks here where you’re getting over 50% moves really just in the past couple of months. And especially when you have that tool that says, okay, the overall trend is up, maybe look to even add to that position. That’s going to make a big difference with your overall trading results and how much you’re able to pull out of each of these opportunities.
So once again, this has been our Hot Stocks Outlook for February 5th, 2021. Thank you all for watching best of luck and bye for now.


