Register for a Free Live Training
The Hot Stocks Outlook uses VantagePoint’s market forecasts that are up to 87.4% accurate, demonstrating how traders can improve their timing and direction. In this week’s video, VantagePoint Software reviews forecasts for Lockheed Martin ($LMT), Schlumberger ($SLB), PDC Energy ($PDCE), Western Digital($WDC), Overstock($OSTK), Oracle ($ORCL)
Hello again, traders and welcome back to the Hot Stocks Outlook for February 4th, 2022. Hope y’all are having an excellent week out there in the financial markets and as always, plenty to cover here in today’s outlook. Now, we’re going to start out really spending some time where we have spent time over the past several weeks, and that’s more in the defense area and energy stocks. That’s where we’ve seen a lot of strength in the marketplace and the software keeps forecasting those markets, as well as crude oil to keep moving higher. And that’s been an easier place to trade if you are looking at energy stocks or just individual stocks or commodities.
But we want to be able to use these tools to identify when things shift in the market, so we got a few tech stocks here that we can take a look at. But Let’s go ahead and learn how these forecasts work really, regardless of the markets that you’re trading.
And so we’ll take a look here at Lockheed Martin. And we looked at like L3Harris, a lot of these things over the past several weeks, but here in Lockheed Martin, what we have here is daily price action. So each one of those bars and candles represents a full and complete trading day.
And you’ll notice that there is a black line and also a blue line right up against that price data. Now, the black line that you’re seeing there is actually a regular simple moving average. It’s a very common technical indicator. In this case, it’s looking at the previous 10 close prices, it adds those all together and then divides by 10. And what that does is smooth out the price data, letting us know where a market has been over a given period of time.
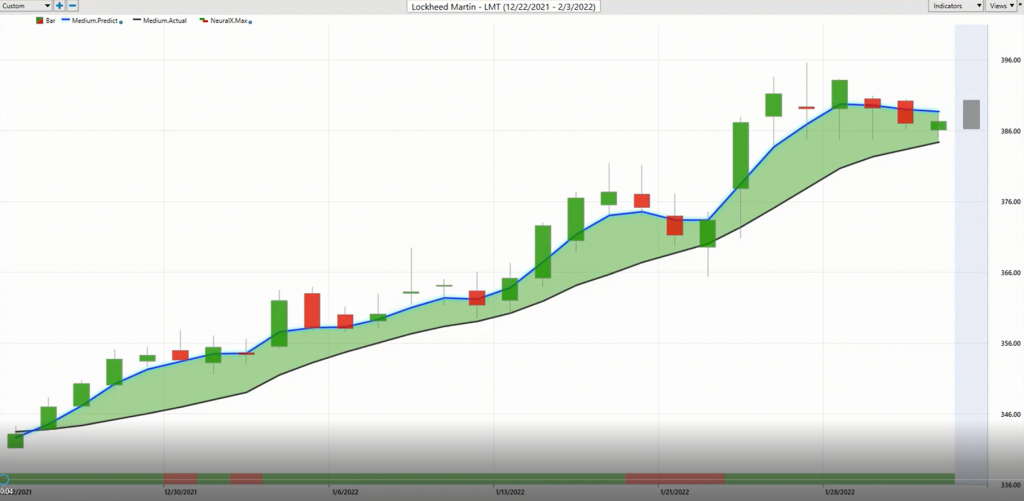
But what VantagePoint’s able to do is utilize its technology of artificial neural networks and specifically it’s doing what’s called intermarket analysis to really derive clues of what’s going on in other markets, and how that might affect the target market that you’re trading. So for this blue line to get plotted and calculated against the chart each and every trading day, VantagePoint’s technology is looking at intermarket relationships. So that means, well, what is it going to look at? Well, it’s going to look at big market relationships like what’s going on in the S&P 500, maybe the Dollar Index or interest rates.
But it’s also going to pick up on subtle market relationships like ETF groups, individual stocks, individual commodities, or the oil, gold, other futures and commodity markets. And it’s able to take all of that information and actually figure out very important clues as to what’s likely to drive and affect future price action. But it’s not just one market. It’s this combination of up to 35 markets that are known to influence short-term price action. And it’s drilling down on that data with that technology of artificial neural networks, that’s actually generating a true price prediction of what’s expected to happen next.
And it’s those predictions that are then built into the value of these indicators turning what we’re lagging indicators that really just get dragged around by most recent price action into a forward-looking predictive tool. So whenever that blue line is crossing above the black line, it’s suggesting average prices are going to start moving higher and you should act accordingly.
Now, that isn’t the entirety of the forecast here. It’s just blue line over black line. You’re also given this bar at the bottom of the chart. You see it goes from green to red. Again, this is updated each and every trading day at the right-hand side, so the most recent data that’s come through. And you’re also provided a predicted high and a predicted low. So think of intraday price levels for the next trading day that hasn’t occurred yet letting you know where you should expect that daily range to play.
And so what we’re able to do is we can look back and see, “Okay, well, how accurate have all of those predictions been?” But maybe more importantly is recognizing, “Hey, this has been a stock that’s in an uptrend in a sector where we’ve identified some strength” and it would make sense for shorter term traders to say, “Okay, well, look, trend is up, but let me use these short-term forecasts like the neural index and predicted ranges to get good intraday levels.” You want to be buying at the best price possible. And you see just day after day, even days like this where you get a down day where the predicted range is already telling you expect some weakness here.
Next day comes in, expect some more weakness, but then the next day is the trading range is actually predicted to go higher. And that’s where you see the market then continue up and these daily ranges doing an excellent job to help the shorter-term trader make better trading decisions really regardless of timeframe. So we’ve had a period here where Lockheed Martin, these defensive shares, we’ve had a lot of news. That’s making these things perk up.
But when it comes to managing those opportunities and getting the best of what’s happening in that particular market, we see about a 11% rally, but multiple, multiple entries along the way to be adding to that position that may have started down around three 50 or so. Multiple entries to be trading that taking profits along the way as the market moves higher, and then resetting the position and rinse and repeat.
So nice rally there in Lockheed Martin and another broad area where you’ve at least identified some strength has been energies, and it’s been pretty consistent here that oil’s strong. The crude oil futures forecasts are very strong here as well. And you see the individual oil stocks are looking very strong as well.
And so here Schlumberger. We’ve actually bought this through, I think a few times over the past several weeks here, but here you see this crossover the upside, very straightforward. But I want to take a look at the neural index a little bit more closely.
So when you get this, neural index goes down to a red and back to a green. This indicator’s also utilizing that neural network technology, but it’s solving a different problem. And that problem is short-term strength or weakness over the next 48 hours of trading. So you can think of it as a forecast for just the next two trading days. So if the overall trend is up, but the neural index is bearish well, expect some weakness or really a good way to think of it as some lower lows over the next 48 hours.
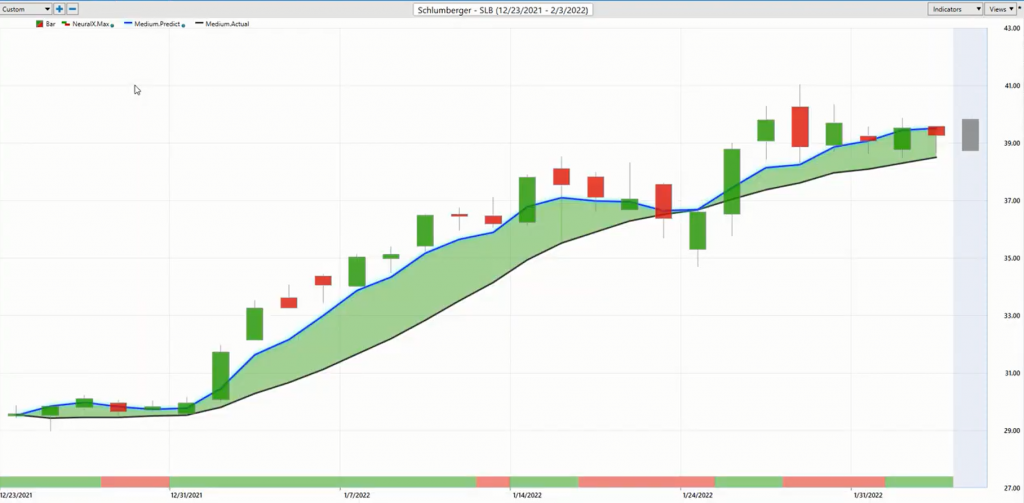
And it gets that right upwards of 85, 86% accuracy across all the market really regardless of Fed announcements, earnings reports and all this stuff. So we see here that neural index it gets bearish here, it gets back to red, it gets bearish here, and we get a little bit more weakness. But what I want to highlight again is the predicted highs and lows. So when you understand that, “Okay, the trend is up, but expect some weakness” and use your intraday predicted levels. But to help you take a long position certainly knowing that energies are strong and the Schlumberger forecast here looking quite strong as well with that blue line well over the black line.
If you need more convincing here about, “Oh, well, why is energy strong?” Well, you can see that through all the other energy stocks. So here you have about a 32% rally in shares of Schlumberger.
We can see just over the past couple weeks here another eight or 9% rally from those predicted lows coming through, but let’s go over to PDC Energy. And it’s just all across the energy space. You’re seeing that, okay, well certainly the NASDAQ and S&P and some of these traditional areas in the market, there’s some weakness. You want to get out of the way.
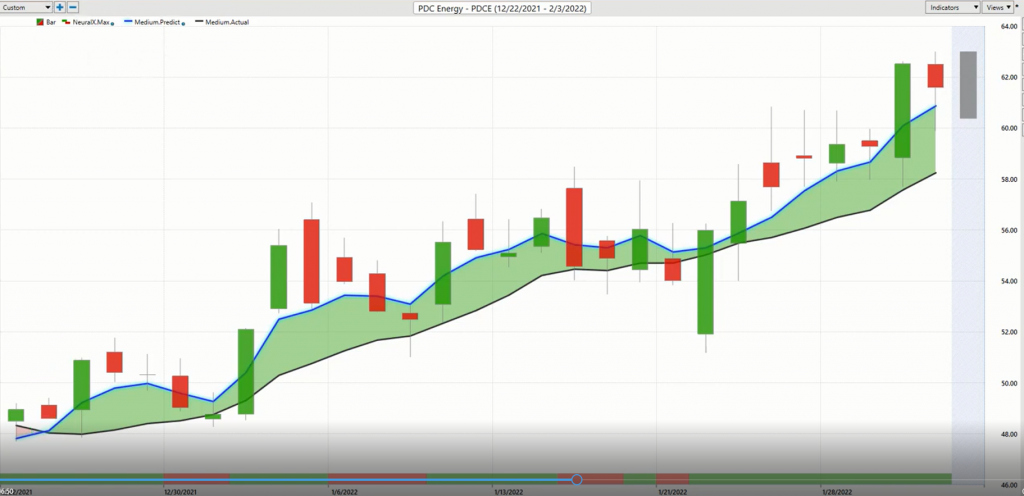
But if you do want to take that long side or potentially get long in addition to some short opportunities that you’ve been taking, well, it makes sense that the energies have been an easier place to go about doing that. And you see you get a little bit of a gappy stock here, but very clearly blue line over black line. Very clearly you only want to be long. And again, I’ll bring up those predicted highs and lows and you can see how even in this market where you’re getting some gaps and movements around, look how effective these levels are each and every day letting you know, “Okay, well, expect a market to move lower here.”
And this is what I love about the software here is you see that, well, all the price action takes place towards the higher end, but that level certainly is waiting for you right there, gets filled and then the up trend continues. And these predicted lows again here. You see, when you have these levels to help make trading decisions after this day telling you to look for this range to come much lower. And sure enough, the overall trend is up. And again, some additional predicted lows hit as the overall trend continues higher.
So it’s all about making those trade adjustments and understanding, well, this hasn’t been just been happening over a week or two. Energies have been quite strong. Crude oil keeps moving higher in a stock market that has seen some difficulty. So here you have 26 and 36% rallies respectively, but in the energy space utilizing the predictive forecasts, you’ve done quite well with your stock trading.
Now, come over here to Western Digital, and we see how more of the traditional stocks have been faring here. Here’s Western Digital crossover to the down inside. And I bring this through to highlight the accuracy of the forecast. Here you have the shift in trend happens here, but the market tends to want to drift higher and drift higher over these subsequent 48-hour periods. But you see that that blue line remains below the black line. The neural index says look for those strength, look towards those higher high highs for the price action to want to move up towards those levels. And you see how well those predicted highs act over that time period to let you know, “Hey, you want to be bearish here and if anything, shorting the market and taking profits on shorts.”
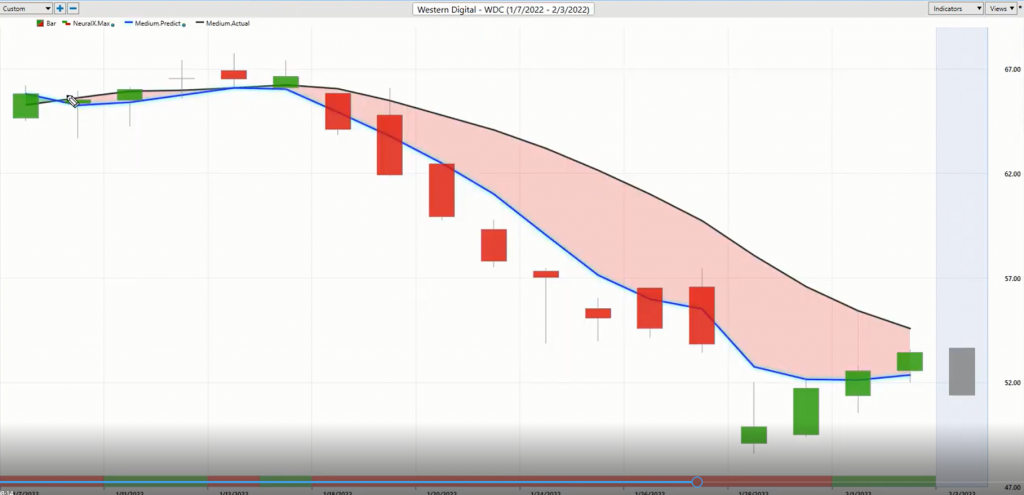
Now, more recently, we’ve seen the neural index gets bullish and we’ve seen some strength come in into some areas of the market, but the important thing is to stick with your forecast. So if you’ve been shorting this market from here and managing that, you can use these tools to continue to manage the opportunity. And this is where I go back to some of these energy opportunities where those continue to move higher. Well, keep managing the opportunity with the help of those changing predicted highs and lows. If the overall trend is still lower, well, you can expect some strength, but you know you’re not going to get long where that blue line is still below the black line.
And you can also recognize when things potentially start to shift. So here we have shares of Overstock have been in a very strong down trend for a very long time. Again, we can bring up the predicted highs and lows and see that, okay, well, when you understand that this is an area where you want to be shorting, you have very good guidance from the short-term forecast, like the predicted highs and lows in neural index to help you guide you over extremely long periods of time where things are happening here.
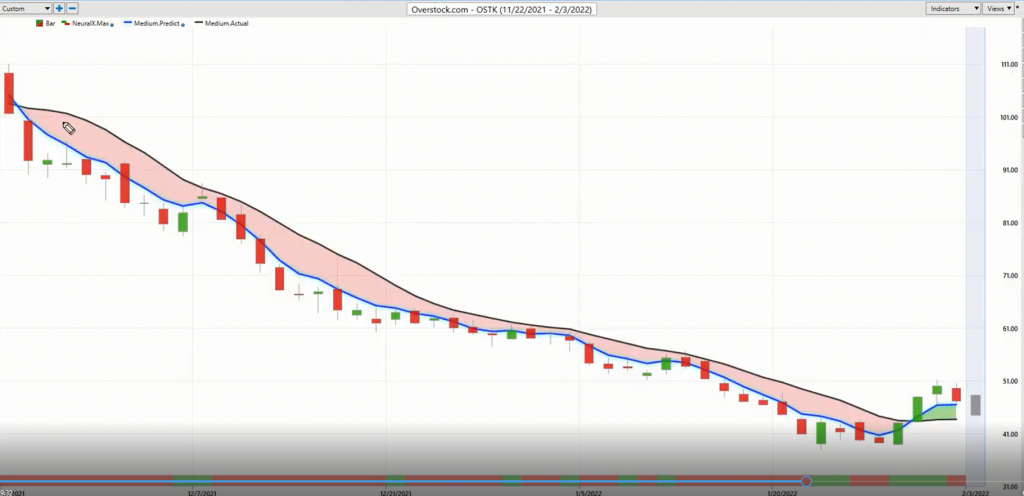
So you see more recently we’re getting this crossover to the upside, highlighting some levels down here at 44 or so where these predicted lows are coming in, but clearly not an area where you probably want to remain short. So if you’ve been shorting the market, this has been fantastic. You’ve seen things like Bitcoin, NASDAQ, a lot going lower here. But if you see that blue crossover above the black line, “Hey, take those profits, move on and potentially even reverse the position.”
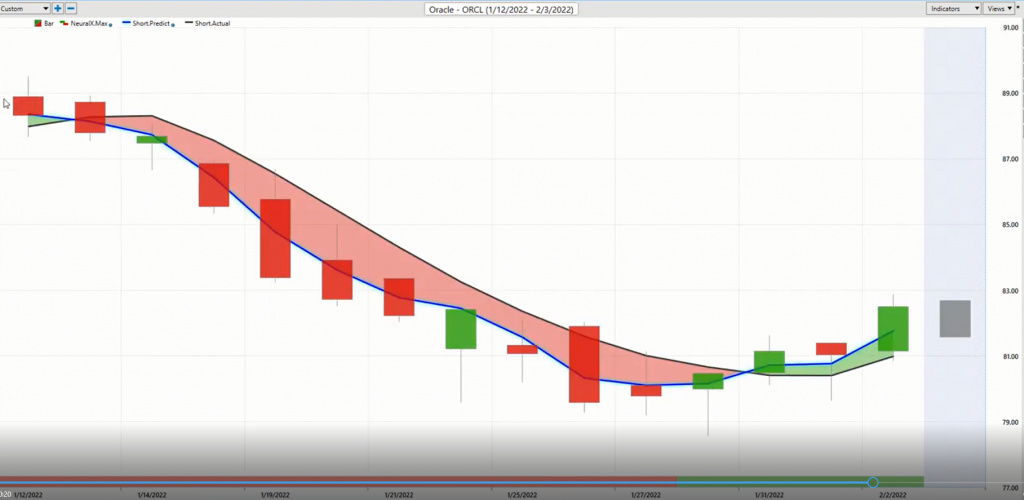
Here in shares of Oracle, this being a quicker forecast here, but I just want to highlight again how these predictive tools from VantagePoint are going to get on your radar and let you know, “Hey, potentially things are shifting here in the marketplace.” So you see Oracle, we get this crossover to the downside here at 87, but something potentially shifting here down here about 80. You see that crossover the upside. You have your predicted highs and lows coming through and highlighting that something may be occurring here.
But what I really want to highlight is we have the help of these predictive tools from VantagePoint and we can go ahead and actually plug these into VantagePoint’s IntelliScan. So if we go ahead and I can open this up and I actually just want to highlight a couple of things here, where what we can do is actually populate these scans. You have all the US stocks here. I can drag them into this scan that looks through these predictive indicators to help find new trading opportunities.
So when you’re trying to identify those shifts in the marketplace and, and identify when things are changing around or when things potentially haven’t changed around and you need to stick with that overall position and game plan for a particular market that you’re trading. This is where this comes in and gets these things on your radar. So when you have these predictive indicators starting to clue in on these signals, because those intermarket relationships are starting to shake around and creating new opportunities. You want those things getting on your radar, so you can recognize them as soon as possible. And understand where you can maintain that narrative and maintain that trading objective.
And also when things need to shift and where they need to shift, which has been very important identifying, “Hey, strength in defensive stocks and oil, not so much recently in the NASDAQ in S&P.” But when that shifts and where that shifts, you’ll be able to detect that, factor that into the portfolio and be an effective trader. So once again, this has been our Hot Stocks Outlook for February 4th, 2022. Thank you all for watching, best of luck and bye for now.