


Register for a Free Live Training
The Hot Stocks Outlook uses VantagePoint’s market forecasts that are up to 87.4% accurate, demonstrating how traders can improve their timing and direction. In this week’s video, VantagePoint Software reviews forecasts for D.R. Horton and Company ($DHI), Franco-Nevada ($FNV), Williams Sonoma ($WSM), Schlumberger ($SLB), Haliburton ($HAL), Home Depot ($HD) and Microsoft ($MSFT).
Hello again traders, and welcome back to the Hot Stocks Outlook for February 25, 2022. Hope you all are having an excellent week out there in the financial markets and as always plenty to cover here in today’s outlook, so let’s just go ahead and jump right into it.
We’re going to start out, we’ve got shares of D.R. Horton, a home builder stock. We’ll revisit a lot of the commodity stocks that we’ve looked at over the past few weeks, and then we’ll move over to the more traditional stocks. We’ve seen this revers on William Sonoma over the past couple weeks, and then the more traditional we’ve got Home Depot and Microsoft here to really highlight what’s going on in the broader market, and how these tools can really get you ahead before all this volatility starts kicking into shares.
D.R. Horton and Company ($DHI)
And so what we have here with D.R. Horton here is daily price action, right, so all of these candles represent a full and complete trading day, and you’ll see right up against that price data there’s a black line there and also a blue line. Now the black line that you’re seeing there is a simple moving average, that’s a very common technical indicator, we refer to it as the actual simple moving average. And what a tool like this does is a simply look back in this case over the past 10 close prices, adds those all together and divides by 10. And so that’s a good tool to smooth out the existing price action and let us know where a given market has been over a given period of time.
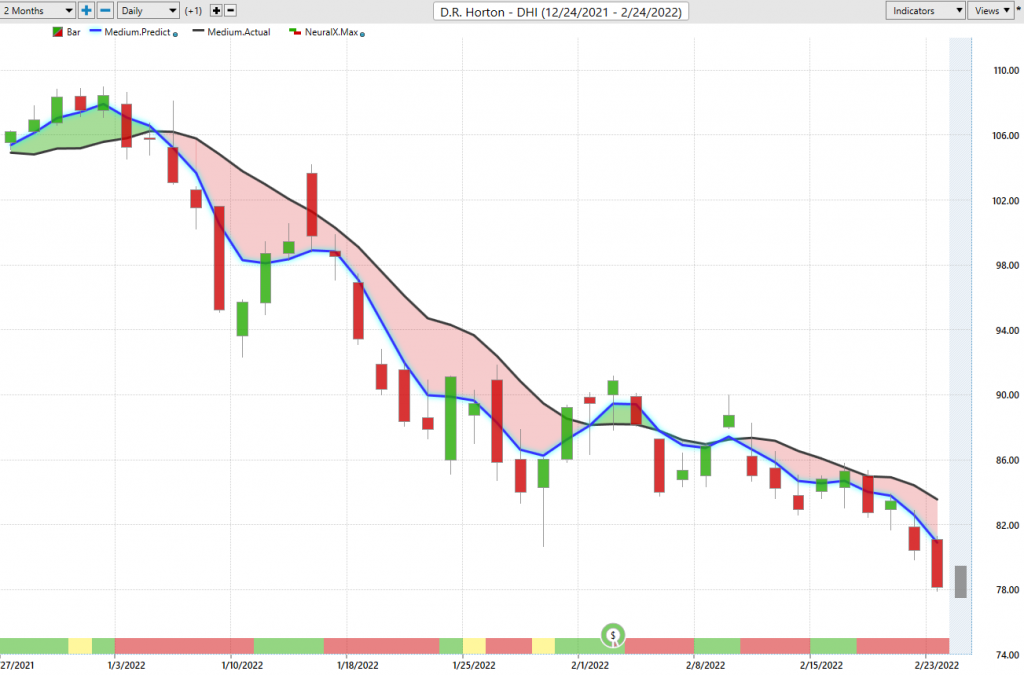
But traders need to be ahead of the next move, and so what we’re able to do is actually compare that lagging moving average or that simple moving average, to this blue predicted moving average, and for this number to get calculated and plotted against the chart every day for traders, this is where vantage points technology of artificial neural networks come in, and it’s specifically doing what’s called intermarket analysis. So it’s understanding the relationships that are happening between markets, and it’s able to use that information to generate highly accurate price predictions of what’s going to happen next.
And so to give you an idea of how that works, well in the case of D.R. Horton and what we’ve seen very plainly throughout the markets and energy stocks and the S&P more broadly is that the broader stock indices have an effect here, right? Whether it’s tech stocks, or the S&P 500, things like the value of the dollar index, interest rates, oil prices, gold prices, right, these all play into the value of individual stocks and individual shares, but there’s subtle relationships that are also playing out within individual stocks, or those ETF groups that wrap up a grouping of the stocks.
And so what this software is able to do is look at those inner market relationships, through that technology generate a highly accurate price prediction, and use those price predictions to actually generate predictive indicators, so rather than having tools that lag behind the market and really just update you as to what’s already occurred, now we have a forward looking predictive tool that can help us understand where are average prices likely to go next. And so when you see that blue line crossing below the black line that’s plainly what it’s saying is average price are going to start moving lower.
Now we really round out the entirety of that technology driven forecast with the help of a couple other indicators. If you see here at the bottom of the chart you have this bar that goes from green to red, back to green, and this gets updated as well every single trading day before the next trading day. And what it’s doing is actually utilizing that technology, but tuned to solve a different problem. And the problem in this case is very short term, looking at really 48 hours, two days of strength or weakness in the market, right, their short term strength, their short term weakness, outside what’s going on with this overall predicted moving average of where overall prices are headed. And so we see this, where you see this neural index will go up to a green configuration for this day, and you get some sideways price action for the subsequent 48 hour period, but the overall trend is clearly down. And again, to round out the entirety of these forecasts we have this 48 hour neural index at the bottom, but also a predicted high and a predicted low.
So what happens this technology of artificial neural networks is trained to solve these different problems, one of which being future average prices with that predicted moving average. One being short term strength or weakness with the help of the predicted neural index. And then you’ve got intraday high and low prices to help you set limit orders, profit targets, whatever you need for your strategy. And so we can see how accurate all of these predictions have been right up against the price date, and this is what we do week to week, but it’s very important for traders to understand that all of this information is known ahead of time. So you understand that hey, these home builder stocks along with D.R. Horton, now is a time to start looking towards these predicted highs to actually set short positions, take profits on shorts, and let the software guide you each and every day moving forward.
So while these crossovers have come through midpoint in February, things shift in the marketplace like we looked at with William Sonoma last week, and we have to say okay, well what’s going on? All right, a little bit of strengths coming in, but the trend is still down and walk this forward so that you understand how to make the best trading decision for that market and that time period that you’re going to be involved in the market.
So shares of D.R. Horton off another eight, almost 9% in the last eight trading days, but we have found areas of strength and repeatedly coming in here and highlighting really the energy stocks, but more recently even Franco-Nevada, and the metal and mining companies.
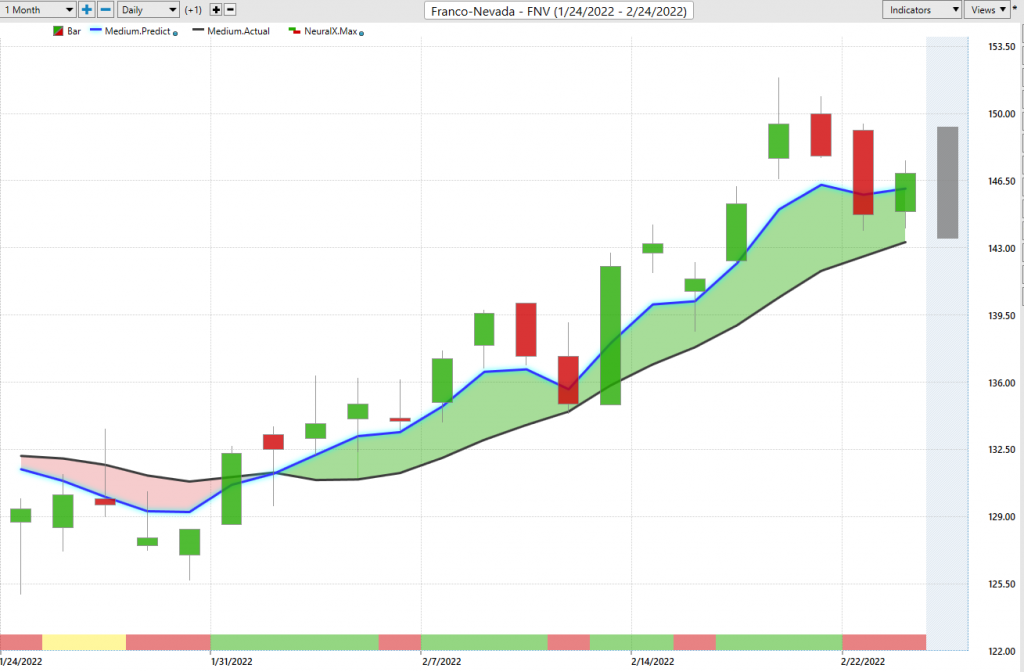
So here is Franco-Nevada, we have this crossover to the upside. And again, if you’re setting up the portfolio it becomes very clear on the areas to avoid and potentially the areas to focus in on. But again, you want that adaptive forecast because you might get into a market at the beginning of February but who knows what the proper actions should be at the end of February. And so we see here with Franco-Nevada we’ve gotten a really nice move, we looked at this last week, and I bring these in just to highlight that yes, there’s been a 10% move just over the past 15 trading days, but more recently here if we just look in the recent past, just over the past couple of weeks we have this predicted low being hit. And even more recently here hitting this predicted low, shooting up here as far as prices and getting some pretty aggressive moves, but in an area of the market where it makes sense to potentially take those shots if you want to get on the bullish side of things.
Now here is shares of Halliburton, and this is very interesting because we keep bringing in Schlumberger to act as an example of what’s going on in energy stocks, right? So you’ve got things like the S&P 500, you’ve got things like the oil, the futures and commodity markets, you’ve got the dollar index, all those things that are going into generating that future forecast. Well what’s happened here is it’s highlighted a very straightforward place to go ahead and get long and take long positions, and you see here in Halliburton that has worked out extremely well over the past what now is almost two and a half months of time here, right, so all these predicted lows being hit along the way here that say okay, well if you want to be a buyer this is a market to potentially look towards.
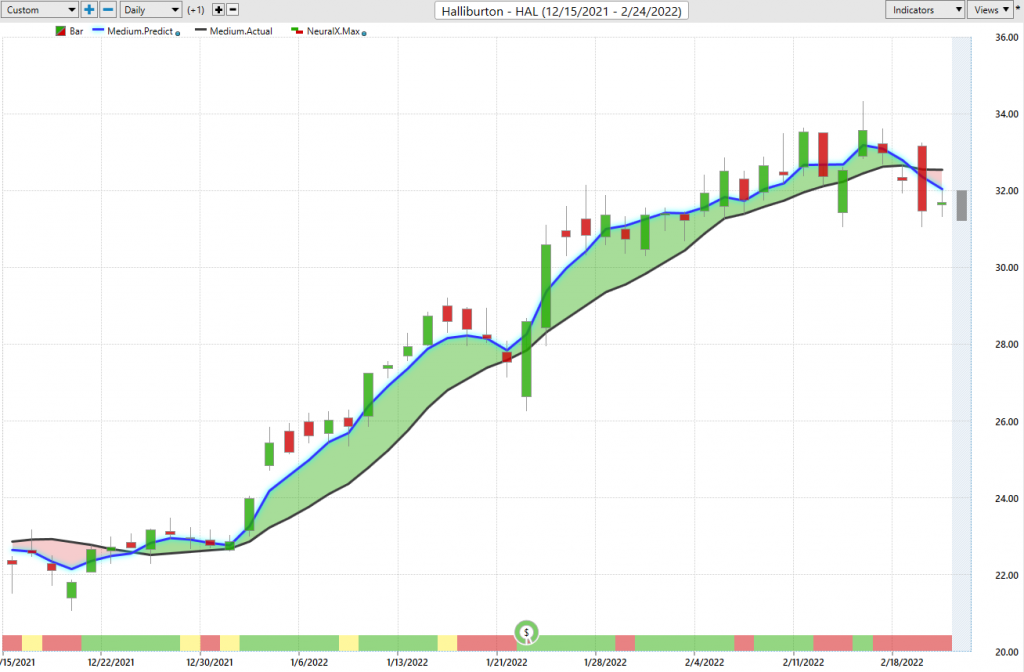
But what I want to highlight here is that we got this really nice rally that again, every week we just keep bringing in and saying look, energy’s moving up, energy’s moving up, let’s look towards that area, and there’s a 41% rally over the past 38 trading days. But most recently in Halliburton you have a crossover to the downside, you’re hitting up against these predicted lows, and we’ve gone lower here, which is very peculiar in a day where crude oil is up significantly, up against a hundred dollars a barrel, but the forecasts are picking up on something here that says well look, in the short term this stuff is moving down to these predicted lows and this is why I want these tools guiding my behavior in the market so that I can factor in hey, how is oil playing into shares of Halliburton, but also how are things like the S&P and interest rates potentially apply into those markets so they I can keep making good decisions?
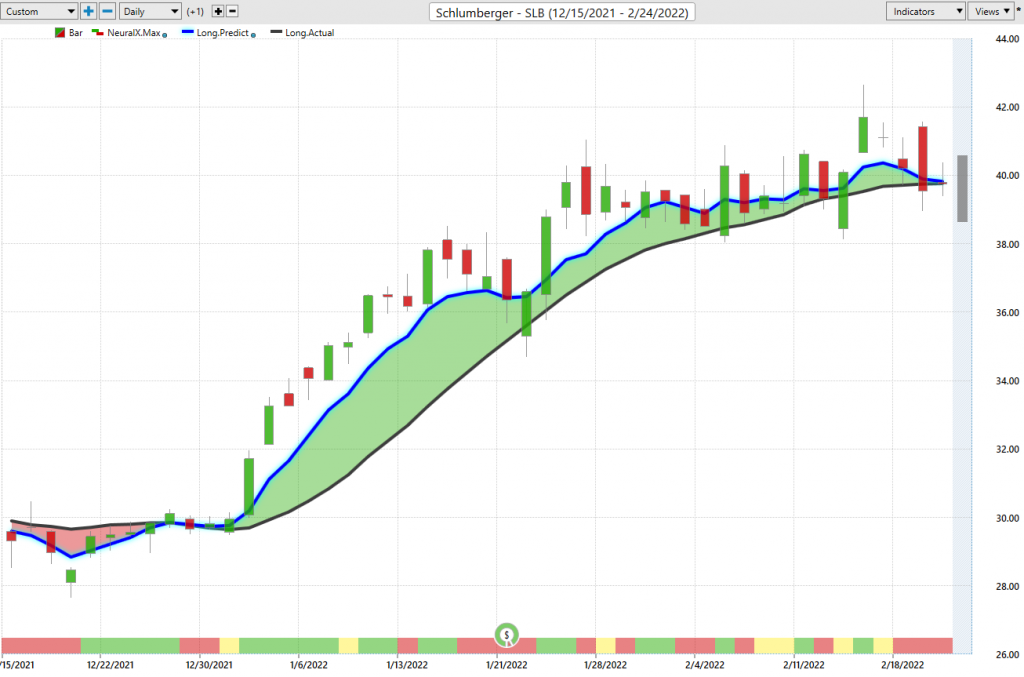
Here Schlumberger, very similar situation where again we see that it has been very clearly a nice ride up here week after week and Schlumberger at 35% move higher, but more recently seeing that these same tools that guide you up here and help you with the predictive highs and lows, all that very clearly say look the crossover is to the downside here. And I peek at these things and we’re sitting down at these predicted lows, we’ve seen the markets aggressively go lower, and you’re seeing how these different market relationships can play into how you might want to be positioned in stocks generally, or oil the commodity or oil stocks.
Here’s William Sonoma, and I’m just bringing this in to act as an example of what’s happened to a lot of the market when we use the tools within the Intela scan. And so we saw at the beginning of February a lot of stocks perk up, and there were a couple weeks where the appropriate play was take long positions, shoot towards the upside of the market, take longs, take profits on longs is sort of the mode to be in.
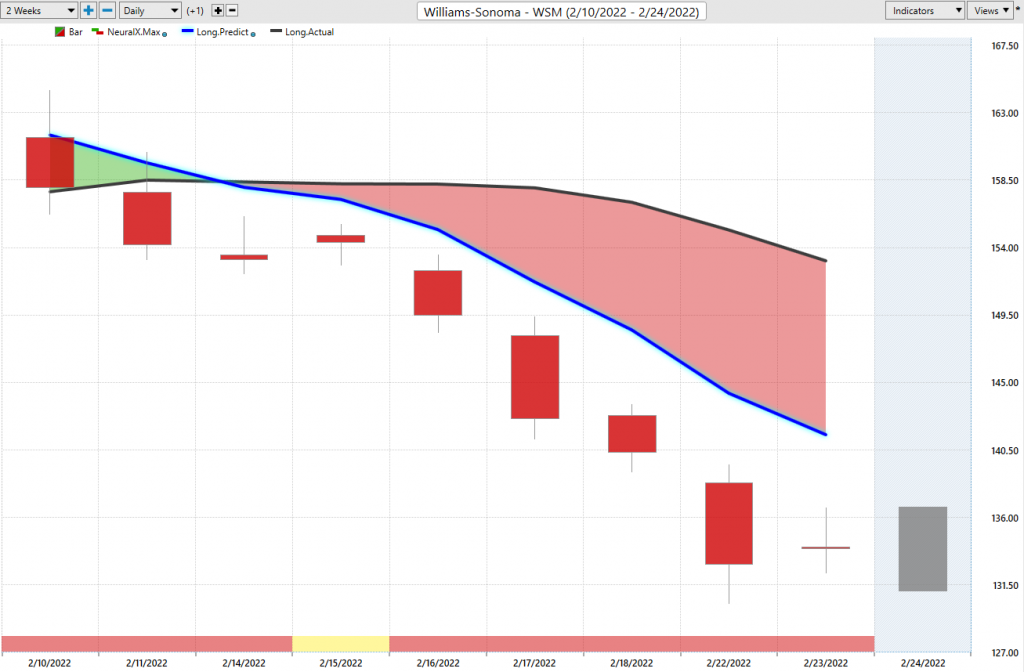
But this is so important is to recognize these shifts, and we highlighted this last week that yes, we’re using William Sonoma as the example here, but there’s been a very important shift in the market that is evidence not just in the markets that you’re potentially trading, but more broadly when you’re running these types of scans throughout the marketplace, so it becomes clear to figure out, okay, where are the areas to avoid? Where are some areas of strength if you want to play that exposure, but then recognize the bigger relationships that are taking place in the market, and whether it makes sense to be bullish stocks in a general sense. So about a 15% decline there.
Well, let’s go over to Home Depot and we see that all through February here you’re getting a market that says look, the forecast is lower here, right, you’ll get these little blips where you see that you get higher highs over of the subsequent price action, but very clearly the blue line well below the black line, and therefore the decision making would squarely be on looking towards things like the predicted high to set short positions to get that exposure on. So when you understand that look Home Depot is struggling, we’ve got stocks that did well at the beginning of February struggling, we’ve got things like the S&P in a down trend, we’ve got crude oil stocks even turning lower even though the commodity is still moving higher, it paints a picture as far as what should the overall portfolio look like and where might positions in it be focused.
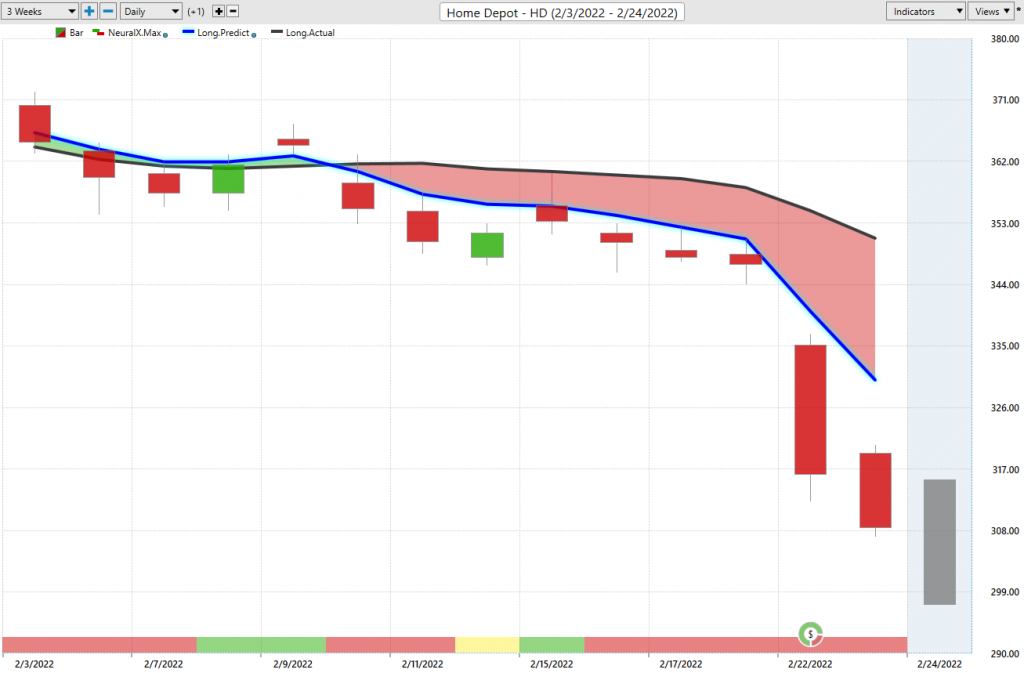
So here we have another 15% decline there in shares of Home Depot, and…
here’s shares a Microsoft, so a very important component of the S&P 500. And sure enough here you get this crossover on $210, and then the guidance from the individual market forecast right, because Microsoft has its own unique set of inner market relationships that are affecting future prices, whether that be in the short term with the predicted highs and lows, or in the long term as far as the overall trend. And so this is again where all these tools are going to come in and help pick up on this. And we highlight things like this all the time where here’s your predicted range, you don’t move at all in the top half of the range, and you see how it’s the next day where you hit that predicted high, and the overall trend is playing out here.
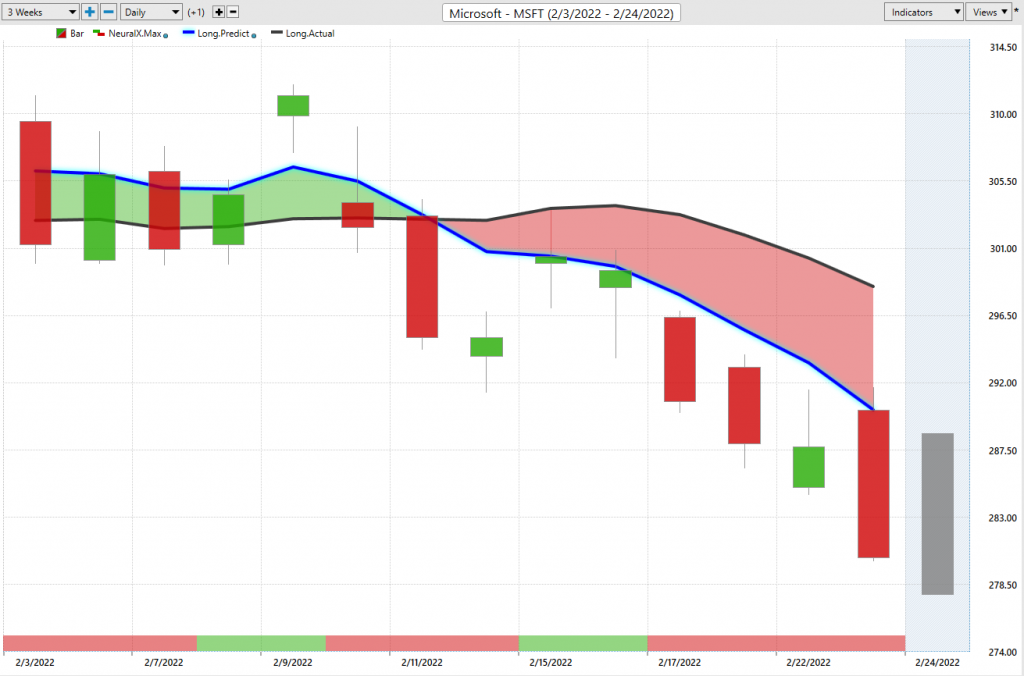
You see a couple more predicted highs getting hit here, even just yesterday here up above 290, I don’t know what the predicted high we can see the predicted high there, $291.62, the actual high was $291.70, so not a bad fill there to get some bearish exposure and clearly on a forecast for Microsoft and a strong down trend, you’re up at a predicted high yesterday, and that’s where we see the bottom dropout and things accelerate going into the day here.
So we’ll go ahead and leave it there, really just updating a lot of the things that we’ve identified over the past several months and just walking those forward. And that’s really where the benefit of these predictive forecasts come in to help you not only recognize these shifts in the market early, but manage them more effectively so you really make the most of each and every opportunity you find yourself involved in, and make sure that you’re holding onto those trends as they continue, but also recognizing those shifts in the marketplace that can help you go ahead and say hey look, go ahead take profits and that’s the trade, or recognize that new opportunity that’s opening up that may be the next profitable trade.
So once again this has been our Hot Stocks Outlook for February 25, 2022. Thank you all for watching, best of luck, and bye for now.

