


Register for a Free Live Training
The Hot Stocks Outlook uses VantagePoint’s market forecasts that are up to 87.4% accurate, demonstrating how traders can improve their timing and direction. In this week’s video, VantagePoint Software reviews forecasts for J.M. Smucker and Company ($SJM), Williams Sonoma ($WSM), McCormick and Company ($MKC), Schlumberger ($SLB), Haliburton ($HAL), Franco-Nevada ($FNV) and Perdoceo Education ($PRDO).
Hello again, traders and welcome back to the Hot Stocks Outlook for February 18th, 2022. Hope y’all are having a excellent week out there in the financial markets. And like always, plenty to cover here in today’s Outlook. And boy, do we have a lot to cover. So a lot of examples here. We’ll start with JM Smucker. Williams Sonoma we looked at last week. We also have McCormick & Company. Schlumberger and Halliburton to cover out the energy and oil space. We also have Franko-Nevada as far as basic materials go. And Perdoceo Education to really round things out here. So I wanted to use JM Smucker here as really just an example of how, regardless of the markets that you’re trading, really, everything works the exact same way. And it’s been a really good example of how you can identify these big shifts in the marketplace.
J.M. Smucker and Company ($SJM)
So when looking at JM Smucker, what we have here is daily bars and candles. So we can see that each one of these candles represents a full and complete trading day. But right up against all of that daily data, you’ll see that there is a black line and also a blue line there. Now, the black line that you see there, that is a simple moving average. So that’s a very common technical indicator. And in this case, what it’s doing is looking back over the previous 10 close prices, adding those together and then dividing by 10. And so what the black line on the chart does is it acts to really smooth out the existing price action and let us know where the market has been over a given period of time.
But obviously a trader needs to be ahead of the next market move. And so what we want to do is actually compare that black simple moving average to this blue predicted moving average. And for that number to get calculated and plotted against the chart, predicting essentially where those future average prices are headed, this is where VantagePoint’s technology of artificial neural networks come in. And specifically what they’re doing is what’s called intermarket analysis.
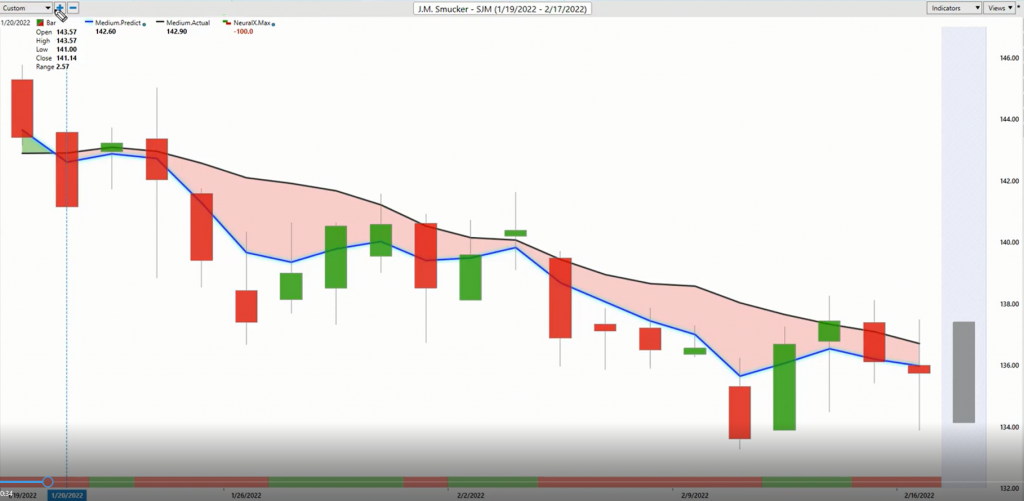
And what that means is, specifically for JM Smucker, which we might call the target market, there’s really dozens of markets that are known to drive and influence future prices here. Now that can be things like just the S&P 500, the NASDAQ, the broader stocks indices, but it could also be ETF groups or individual stocks, but also global interest rates, global currencies, global commodities, like how many stocks. We’ve got Schlumberger and Halliburton here in crude oil futures going up to the roof. Well, what does that all have to do with?
And so that’s what’s happening is these market relationships are affecting the markets that you are trading and taking risks in. And we can actually derive some extremely helpful market clues as to what’s likely going to happen next by utilizing that approach with specifically that technology of intermarket analysis and artificial neural networks looking and doing that intermarket analysis.
So what happens after looking at all those relationships is there’s actually a true price prediction generated via that technology. And it’s those future price predictions that are built into these indicators, turning what were really just lagging indicators, that model what’s already occurred into the market, into a forward looking predictive tool. So whenever that blue line in this case is crossing below the black line, it’s suggesting average prices are going to start moving lower. As a trader, well, fairly simple, you might want to short, take profits on shorts, is the way that I might think of it. But there’s more to the overall forecast here. And this is how traders can really set up their portfolio and recognize these shifts.
So if you see at the very bottom of the chart, you see you have this bar that goes from green to red, back to green. And what that’s doing is it’s updating every single 24 hours, but it’s actually an indicator that is extremely accurate, upwards of 86% accuracy when you look across really all the markets and through Fed announcements and all this news events and things. An extremely accurate indicator at forecasting short-term strength or weakness in the market, again, looking ahead just 48 hours. So you can think of it as two candles at a time, short-term strength or weakness.
And then to round out this forecast, you also have a predicted high and a predicted low. So it’s this technology that’s underlying these indicators that’s picking out these levels for you, whether they be the direction of that moving average, the short-term strength or weakness from that neural index so you can be prepared over that 48 hour window of trading, but then you’re also getting a predicted high and a predicted low. And it’s a separate set of this neural network technology that’s honed in to try to pick those out for you and you can use them to make better trading decisions.
So I know a lot covered there, but it makes for a very simple forecast to interpret and understand, okay, well, if you’re going to be trading JM Smucker, well, it looks like you might want to short and take profits on shorts. And what we can do is look and see exactly how accurate all of those predicted high and low predictions were against the actual market data. And so when you understand what direction you want to trade the market, and you have this technology that is not only updating and letting you know where future prices are headed, but when something occurs in the market where you see that down trend picks up, you get a new close here, this is where these predicted highs and lows do an excellent job of adjusting every single trading day to help the trader make intelligent trading decisions.
So while we’ve gotten a nice move lower here in shares of JM Smucker, it’s not just about this move lower of about 5% over 19 trading days. If we look very closely here, we can see there’s about one, at least two, three, four, five, six, seven, eight entries along the way as this moves lower. But knowing all you’d want to be doing is shorting, taking profits on shorts. Again, you see these predicted lows being hit, acting as good profit targets, doing all of that behavior as well. And it just, again, it’s about using these forecasts really regardless of the way that you trade to make better trading decisions on a day-to-day basis in those markets that you are involved in.
So I want to bring in William Sonoma, which we looked at last week. And this was an example of these markets where we started to see strength coming in at the beginning of February. And there was certainly a selection of markets where there was that glimmer of strength coming in as far as stocks. But as far as Williams Sonoma’s forecast, you see, okay, well, there’s the crossover to the upside that says, “All right, well, there’s a period where you might want to start looking to the bullish side and making a bullish case for buying the market, taking profits on longs, hitting these profit targets.”
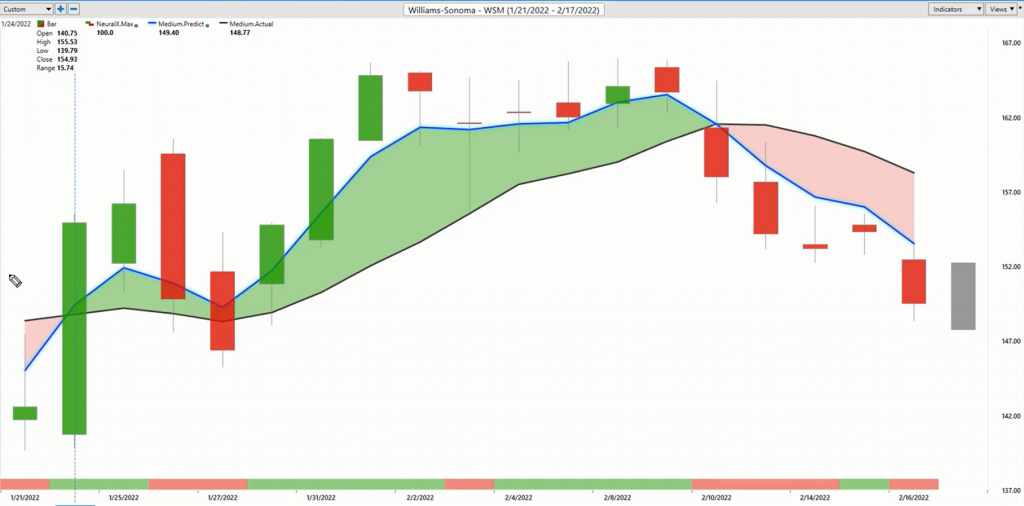
But then we get a shift in the market, and this is why things are so important. As you see, we get that blue line crossing below the black line right there. I mean, it’s letting you know going into the next trading day there’s been a very important shift in at least this stock, which looked like it pivoted going into the beginning of the year. So you need to be conscientious of there’s market shifting here. And this is where VantagePoint’s Intelliscan feature gets these things in front of your face, so that you recognize that, hey, what was a bullish case just a couple weeks ago, well, VantagePoint doesn’t predict two weeks ahead of time. And once we got to this area, it says, “Okay, things have shifted. Now look to definitely take profits on your longs. But if anything’s short, take profits on short opportunities.” And we’ve seen some weakness come into the market.
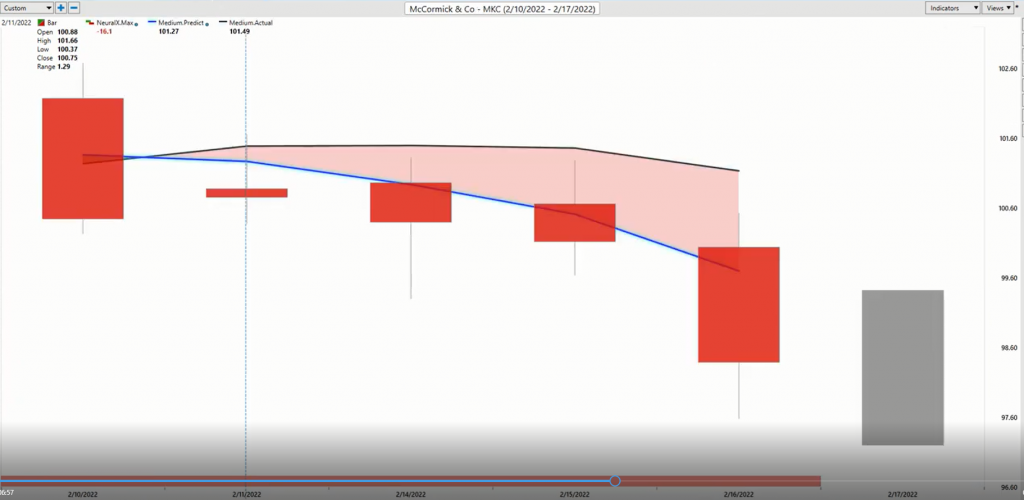
Here’s McCormick & Company just laying it out here of the types of crossovers that you’re going to see when you start running these scans and can start building a very strong case that, okay, well, some of these things you don’t want to stay in that bullish case. So if the blue line remains above the black line, great. Stay long. If the blue line crosses below the black line, like here in McCormick, well, this is an area where you either want to take profits or short and take profits on those short positions.
But when it comes to the energy space, here’s Schlumberger, which we’ve been bringing the energy things for six, seven weeks now, as far as just I want to mix up the markets that I show you. So I can’t bring Schlumberger in every single week here. But you see we have this crossover quite a long time ago, going back really to about Christmas time period there. Blue line crossing above the black line. And just like I mentioned, with these intermarket relationships, things like the crude oil market, natural gas prices, but also those individual stocks that are also in the energy space, ETFs, right, the XLF ETF. All these things are going to drive the future price of Schlumberger. And we can have very good clues as to short-term future price prediction.
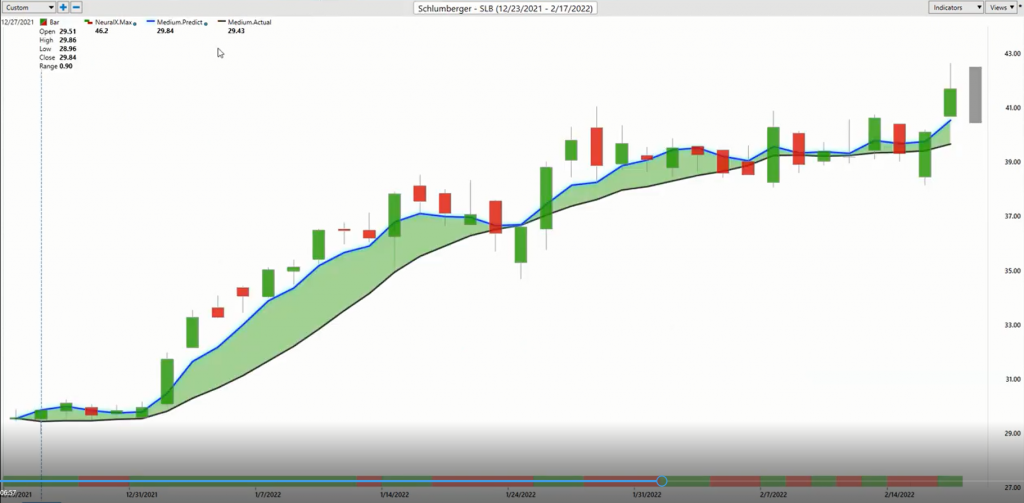
So here in Schlumberger, we’ll go ahead and look at those predicted highs and lows, but you never get that blue line crossing below the black line. So it’s not like William Sonoma that says, “Okay, well, what was a bullish opportunity, nope. Things have shifted. You need to shift as well.” This has said, “Look, this is still bullish here.” And you’ve gotten a move from about 37, 38 now pushing up against 42, 43. So really nice moves here, but very clearly an area where you identified strength quite a long time ago. So there’s those more recent things that have been shifting in the market, but also those things that have been in place for a long period of time and have been obvious places to exploit as far as directional trading in the market. So you got Schlumberger shares up about 39% now, just over the past 36 trading days. I mean, even just a couple hundred shares, you got about a $2,400 move there in just a couple months of time.
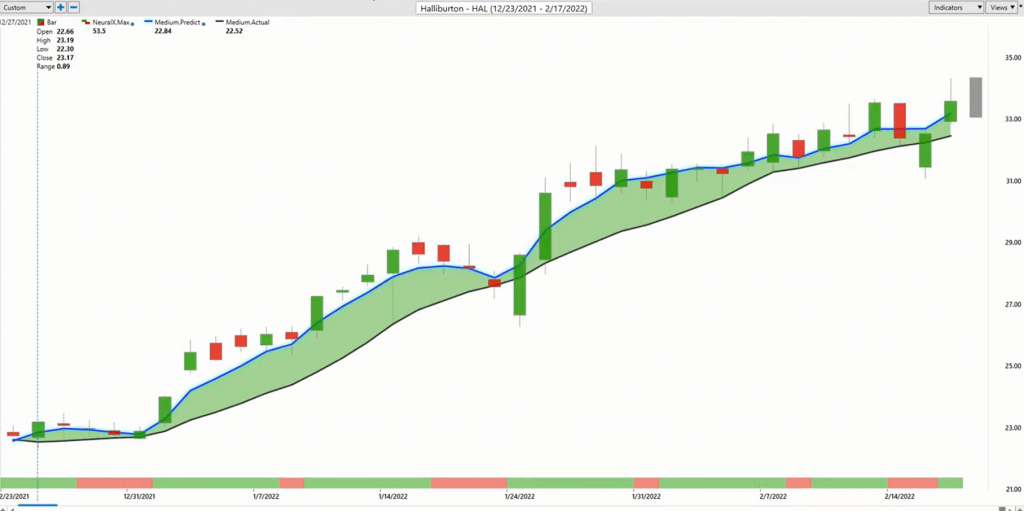
Here’s Halliburton, a very similar picture, where you get that benefit of sort of infrastructure and energy, but similar crossover to the upside. And very clearly that this is an area in the market where there is some strength that you can exploit. So the short-term trader understands that, “All right, I’ve got this roadmap here as far as predicted highs and lows, but I know I’m only going long, taking profits on longs.” And that has been the way to go here.
Here’s Franco-Nevada. And we’ve seen a lot of the metals, gold really start to perk up and you see that it will, in the case of Franko-Nevada, very clearly, you’re not getting that crossover to the downside. And what that’s opened up are some opportunities to get some bullish exposure and some very advantageous places in the market. Even very recently here, we see bouncing off of these predicted lows and accelerating higher. But overall a pretty decent move here in shares of Franko-Nevada. But something that is in an uptrend with some interesting types of volatility that we’re seeing in different areas of the marketplace, the futures’ market. There is a lot going on and potentially opening up some really great opportunities to get that exposure to.
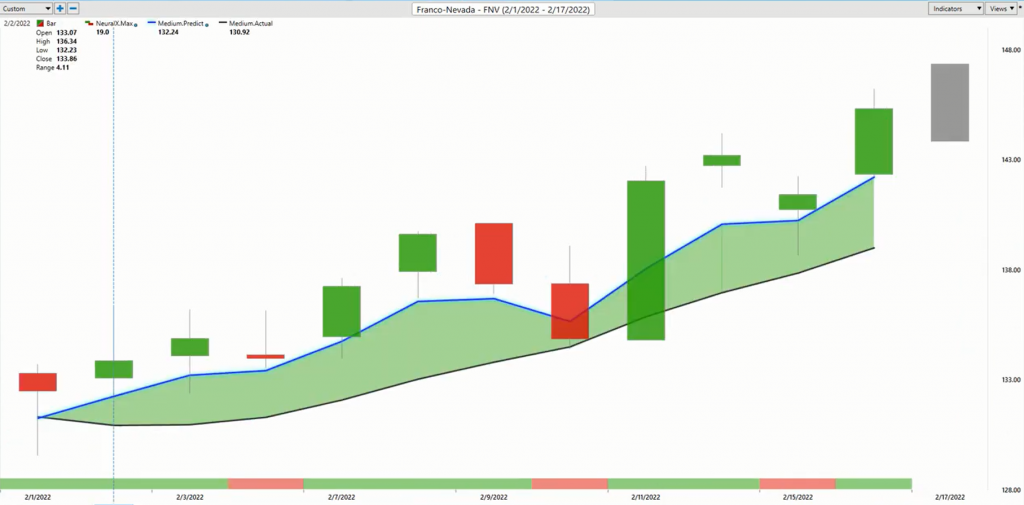
So again, here just a couple hundred shares, as you have a couple thousand dollars, about an eight and a half percent move in the past 10 trading days. And again, to that point of there are some areas where you may have set up some short opportunities and that’s a great hedge to have if you are long as well in your portfolio, but some of these things have persisted.
So you have Perdoceo Education here, crossover up here at about 11 or $12 or so, but this again has persistent weakness. So all you’d want to be doing is shorting, taking profits on shorts. You’ll get these periods where you see the neural index goes bullish here.
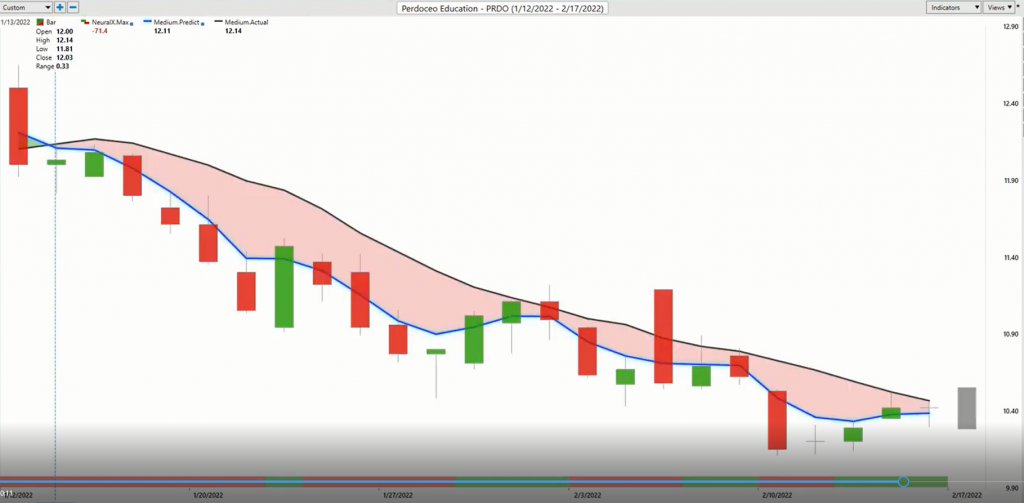
And what I often want to observe here is you see that the market four or 48 hours is running sideways there. That’s generally what you can expect when you get those little blips there. Here, you see again, 48 hours, the markets are sort of running sideways and hanging up. You get a big sort of gap up here, which this is a low volume stocks. Sort of know those things can happen. But immediately back lower. And then the software again says, “Okay, well, let’s get these things back online, short, take profits on shorts.” And again, the only way that you might want to go, but something that may be sitting in the portfolio for a while. So if things start to shift here, you can cover those opportunities and maybe we’ll see a lot more strength come in. But it is a very mixed market and why it’s extremely important to have a tool that’s really going to direct you to the areas of potential, in this case, weakness on JM Smucker, but more importantly, some of the strength around the basic material stock. Pretty straightforward ride up there for the past few weeks here.
So we’ll go ahead and leave it there. But once again, this has been our Hot Stocks Outlook for February 18th, 2022. Thank you all for watching. Best of luck, and bye for now.

