


Register for a Free Live Training
The Hot Stocks Outlook uses VantagePoint’s market forecasts that are up to 87.4% accurate, demonstrating how traders can improve their timing and direction. In this week’s video, VantagePoint Software reviews forecasts for Walt Disney ($DIS), SPY ETF ($SPY), Tesla Motors ($TSLA), Caterpillar ($CAT), Netflix ($NFLX), American Express ($AXP)
SPY ETF ($SPY)
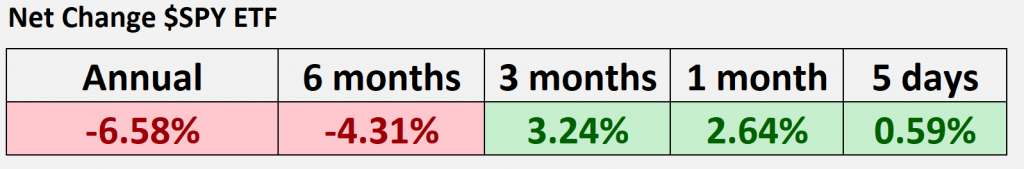
Hello again traders and welcome back to the Vantage Point Hot Stocks Outlook for February 17th, 2023. Hope y’all are having a excellent week out there in the financial markets, and do we have plenty to cover here in our outlook. So as we typically do, we can take a look at the SPY, the S&P 500 ETF, and we’ve had a really nice run here over the past few months, but we’ve actually seen a fresh crossover to the downside very recently, and that’s why we’ve been highlighting some of this mixed nature that we’ve seen in individual shares. But if we go ahead and look at the broader market over the past year, we can see that over the past year we’ve down about 6.5%, about six months off about 4%, but we’ve actually had some strength and that’s what we’ve been highlighting with things like Amazon and Disney, a lot of these stocks moving to the upside, but there’s been some important things going on out there that we need to be aware of.
So we’ve had this nice move over three months and sort of running flat over the past few days here, and that’s what we need to be paying attention to, is are there those shifts out there in the marketplace?
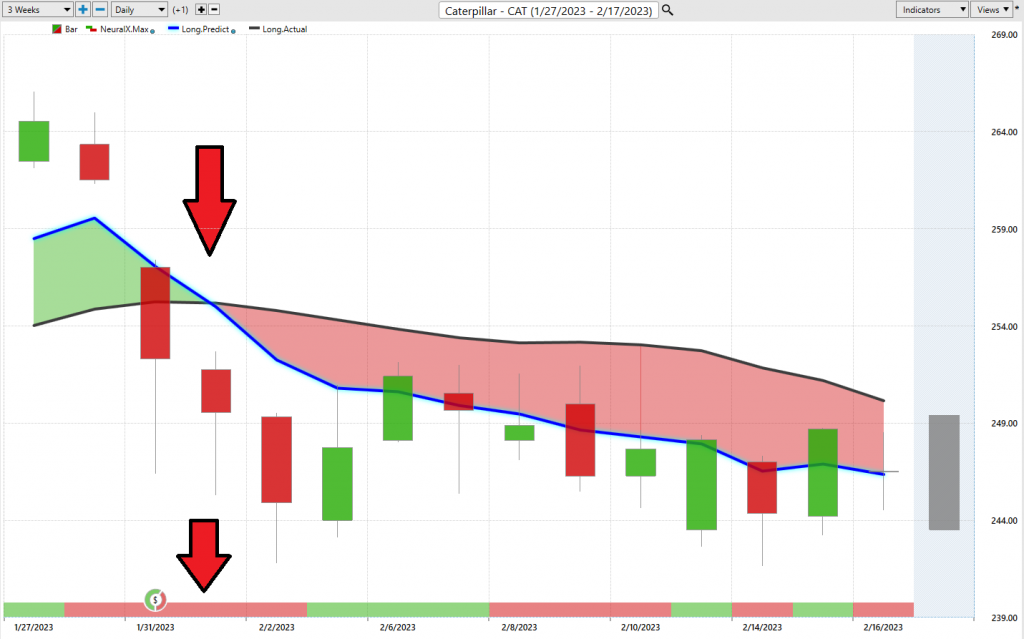
So let’s go ahead and we can start in shares of Caterpillar. And I bring this through really to highlight that this is a few weeks ago we brought this through to highlight that there is some weakness out there in the marketplace. So there are some stocks like Tesla and things doing extremely well, but in Caterpillar here I just wanted to highlight the predictive indicators and how this all works. So what you have with Caterpillar is daily price action. So each one of these candles represents a full and complete trading day, but right up against that price data, you’ll see that there is that black line and also the blue line.
So the black line that you’re seeing against the chart, that is a simple moving average. So it’s a very common technical indicator and in this case it actually looks back at the previous 10 closes. It’ll add those all together and it really smooths out the price action for us as traders to let us know where market prices have been over a given period of time. But traders need to be ahead of that next move in the marketplace. So what we’re able to do is compare that black, or we could think of it as a lagging moving average to this blue proprietary predicted moving average, and for that number to then get plotted for the trader each night for their analysis, this is where the technology of artificial neural networks are performing what’s called intermarket analysis, meaning that they’re training the AI on really the data sets from markets that are known to drive and influence the target market that you’re trading.
So for Caterpillar, that can be things like specific ETFs around the capital goods and construction space. It can be individual stocks that share important market relationships. But then we get over to the macro side and there’s very important relationships with things like the dollar index or global currencies, interest rates, gold and other futures markets, commodity markets. So it’s able to take all of this into account, even down to other global currencies, other futures markets, individual stocks. And what it does is then generate a price prediction, future prices that haven’t yet occurred but are based off of that artificial intelligence, that forward looking approach. And then it takes those predictive prices generated via the technology and uses that to create your indicators. So rather than having lagging moving averages that just get pulled around by the most recent price action, you have a forward looking predictive tool.
So it isn’t just this blue line over black line with a predicted moving average, though. We have another problem to solve, potentially very short term strength or weakness in the market. And this is how at the very bottom you see this bar that goes from green to red and back to green. This is the predicted neural index. It’s using that same technology of artificial neural networks, utilizing intermarket analysis for the data. But what it’s doing is solving a different problem for the trader. And that problem is short-term strength or weakness over the next 48 hours. So you can think of that as a couple candles.
So when you combine the overall trend with that expectation of short-term strength or weakness, we can get a good idea of where things are headed, but that’s not it. You’re also provided an intraday predicted high and low level for the next trading day. So what I just want to highlight is that we’ve had some really strong markets and we’ve been highlighting those in the Hot Stocks Outlook, but if you have a portfolio, it makes sense to maybe hedge that portfolio. If we start seeing volatility in the macro space in the S&P 500, you want a portfolio that can benefit from longs and shorts. So while Tesla’s doubled in price, it may make sense to get some shorts in the portfolio and these areas where you’ve identified some weakness, and now we’re seeing dollars start to move higher, some weakness in some equities, and it’s especially important why you need to be careful and not have all your eggs in one basket and expect the market to accelerate higher here.
So you see a lot of entries here on the upper end of this, but also numerous opportunities to take some profit and reassess that position, get it back on potentially better prices. So this is what it’s all about, is recognizing where these predictive indicators are really skewing to let you know where those opportunities are and you’ll see numerous opportunities for a short term trader to take pieces out of this market, whereas some markets moving higher but not here and not here for now a few weeks. Now let’s go over to Netflix, another very popular stock, and this really highlights the mixed nature of some shares. So you see the S&P ETF, it went up actually this week, grinded higher, but now you’ve gotten that shift. So it was never really all that bullish, you had a lot of sideways price action, and it’s not difficult to identify, where is that sideways or down price action occurring.
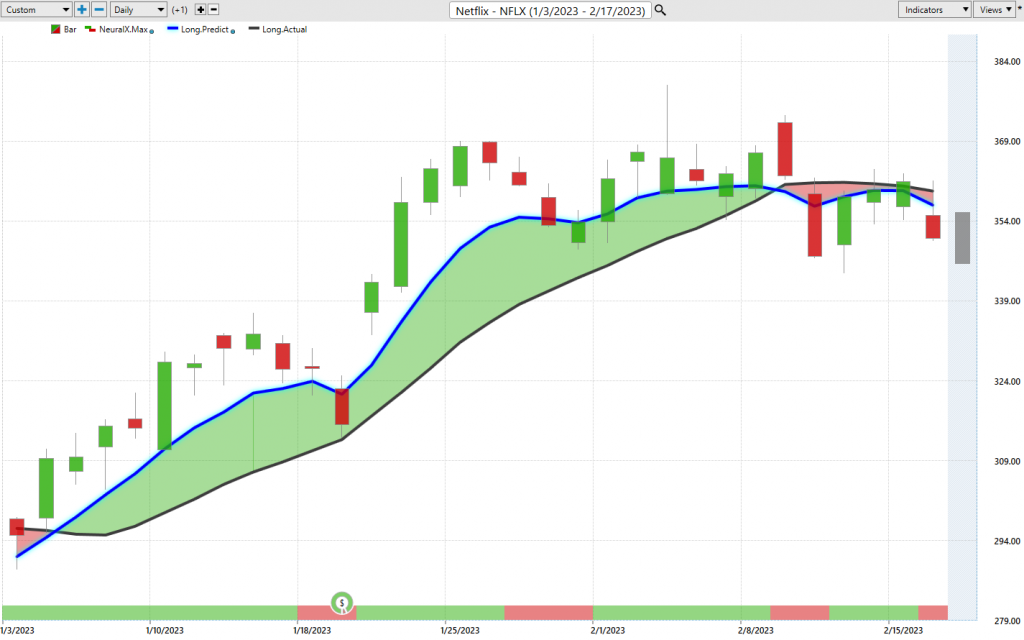
So there’s caterpillar onto Netflix here. Over the past few weeks you see that blue line crossing below the black line, but this is what I love about this. So here’s the neural index, and like we just covered, that’s a short-term forecasting, short-term strength or weakness in the market over the next 48 hours. Well, what’s happening here? There’s higher highs, some strength over the subsequent 48 hours, but what about that predicted moving average? Where’s the overall trend going? So it really helps traders not get fooled here and understand that, “Look, I should be shorting, taking profits on short positions. And you see we’ve gotten a pretty healthy decline there, about a 5% move. But again, more importantly, we’ve seen a persistent market. The markets are running sideways. But still you identify some areas where you should only be shorting here, take profits on shorts, and then just…
Really, this is pretty impressive. Look at this overall forecast. Neural index bullish here, bearish here, bullish here. I mean, it’s really warning you of that short term strength that’s coming in, but you don’t want to buy that strength. And especially I think going into this weekend here on Friday, we can see some problems here and you certainly want to be positioned well for that volatility to pick up and help the portfolio, not hurt things.
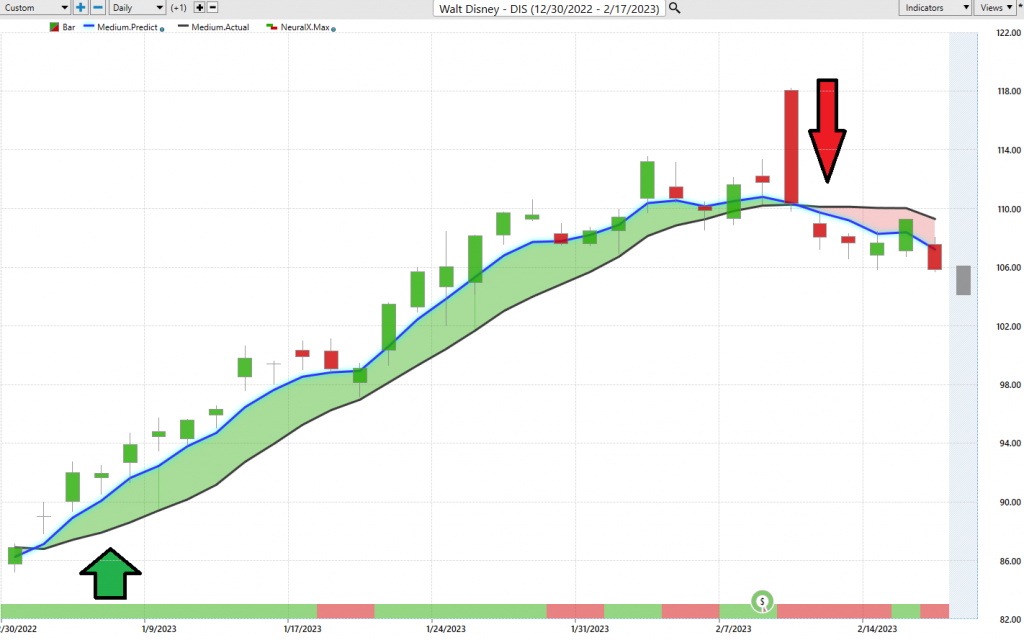
Here are shares of Disney and we went over this ad nauseum here. Amazon picked up at about the same time. There’s a lot of similarities in these charts between Amazon and Disney. When we look at the broader market, the ETF, we had a lot of strength, but we’re seeing some very important shifts in the marketplace. So we can look at Disney overall here and say, “Okay, well that blue line over black line, look at these numerous opportunities to be a buyer in the market.” `This buy, buy, buy, buy. And here’s earnings.
So this is where the software obviously can’t account for earnings. It’s using that intermarket data, looking at these price relationships, and generating extremely accurate indicators. But when earnings comes out, it’s a mixed bag of what you’re going to get there. And you see how confused the market is. It shoots up. We talked about last week that closing down at those predicted lows. But what are you seeing in shares of Disney? It’s making this quite clear that there’s a crossover to the downside, there’s other places where the blue line is still above the black line. You could still potentially be trading there. But you’re really seeing some warning signs here to get defensive, hedge, and make some money on the bearish side as well.
So even if we just go ahead and look at the past few days here in Disney, and I’ll just go ahead and zoom in on this, we can take a closer look, see this crossover to the downside. You have your predicted highs and lows to then guide you and say, “Look up here if you want to go ahead and get short or potentially get out of your longs. Get out of the way here, the trend is now down,” and you see going into now the end of the week, a lot of weakness and things potentially accelerating to that bearish side of trajectory here. Now of course, let’s go ahead and bring in Tesla here.
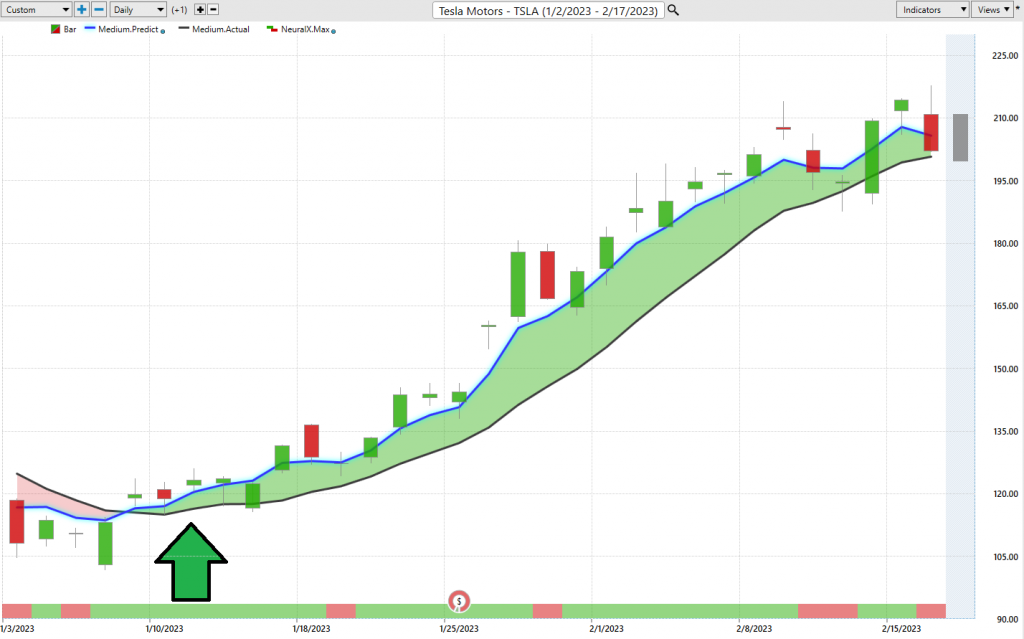
We just week after week, bring this through because the whole point is to have these tools that are adaptive. When you get into a market and recognize the trend is continuing, you want to maintain that position and manage it as effectively as possible. If this were Disney or Amazon. We have a much different scenario as far as the crossover that blue line has been below the black line. But you see here in shears of Tesla, there’s a lot of attention in the market here. And we can even see last week where this being last Friday, Monday, end of the week, huge move. It’s like week after week after week, getting some exceptional levels to be a buyer from and seeing that market accelerate higher. But once again, we’re starting to see at least some short-term weakness, even in the strong stuff, some crossovers to the downside, and you really need to be prepared, and like I said, have those hedges in the portfolio so that while you’ve captured a really nice move in Tesla, about a 76% rally, you’re also making money on bearish positions in the portfolio as well.
And what you can do is adapt and shift that position based on what you’re seeing. When it’s time to buy Amazon and Disney, great, let’s go ahead and bring those into the portfolio.
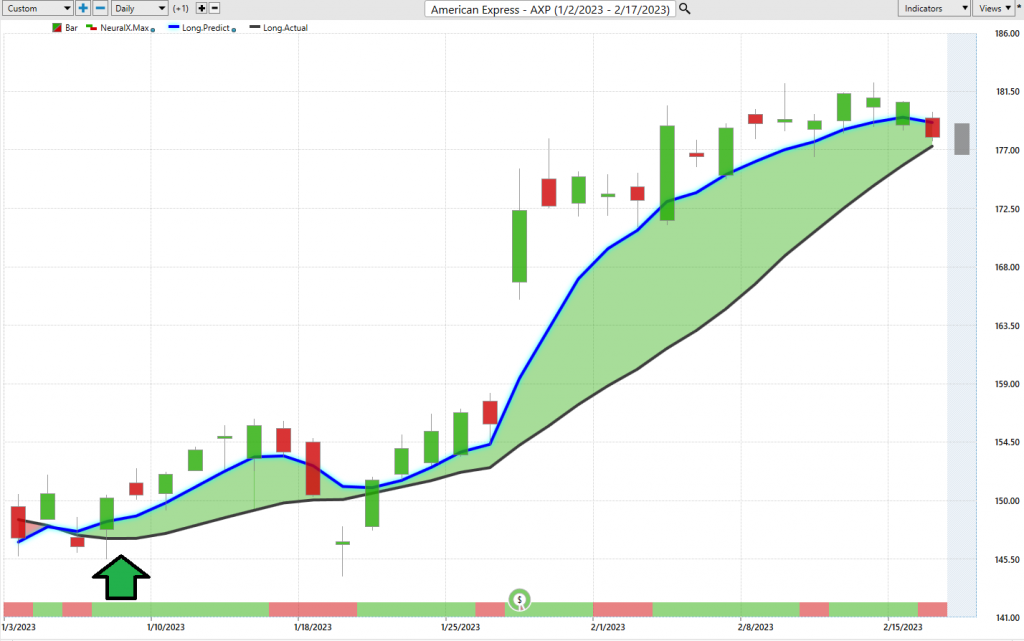
But when you see those shifts, you want to move money around. Move into the things that are working, away from things that are not. Lastly here we have American Express, and again, a good example of what’s been going on in the markets. Now, earning seasons here, so in all these charts, we’re going to see a lot of that, but a really nice move to the upside. But again, I do want to highlight that even from these forecasts where you’ve seen a lot of strength, we’re seeing that broad based weakness.
So every stock isn’t going to match exactly what the S&P 500 does. Some will grind higher over time, even when the S&P 500’s going lower. But you want to really pay attention to these areas like we’ve had recently where there’s been so many tremendous rallies, great opportunities to the upside, but also recognizing is when in those individual markets you’re trading, when things are starting to shift and you need to accommodate for that, adapt to that, and make sure that you’re positioned properly for the next big shift in the marketplace. So we’ll go ahead and leave it there. Really great Hot Stocks Outlook for the week. Some really exciting opportunities opening up. Once again, this has been February 17th, 2023. Thank you all for watching, best of luck, and bye for now.

