


Register for a Free Live Training
The Hot Stocks Outlook uses VantagePoint’s market forecasts that are up to 87.4% accurate, demonstrating how traders can improve their timing and direction. In this week’s video, VantagePoint Software reviews forecasts for SPDR SPY($SPY), QUEST ($DGX), Ulta Beauty Supply ($ULTA). NVIDIA ($NVDA), Copart ($$CPRT), Apple ($AAPL), Salesforce ($CRM)
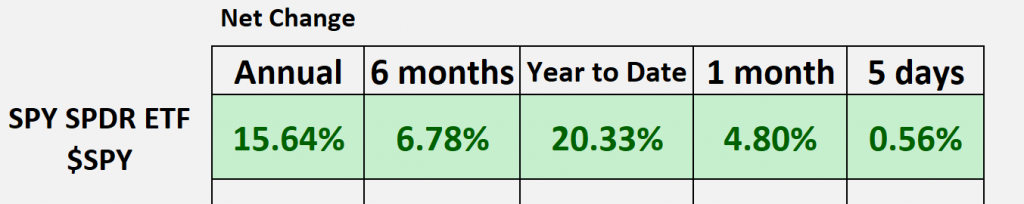
SPDR SPY ETF ($SPY)
Hello Again Traders and welcome back to the Hot Stocks Outlook for December 8th, 2023. I hope you all are having an excellent week out there in the financial markets as always. We’ve got plenty to cover in this week’s Outlook. So, if you haven’t already, make sure you go ahead and click on that link in the description below and you can get a live demonstration to learn all the specifics about how this technology works. Whether you’re trading stocks like we have here in the Hot Stocks Outlook, or Futures, currencies, Forex, Commodities, whatever markets you’re trading, a very high level of accuracy associated with these predictive forecasts.
Now, when we look at SPDR SPY ETF ($SPY), back at the Spy ETF, well we can see that year-to-date we hit that 20% mark. Very exciting stuff, but we’ve had really sideways price action for the past few weeks, really going back to Thanksgiving. That week leading into Thanksgiving, we’ve just sort of led sideways with a little bit of bias to the upside on the Spy. But this is where individual stock positions, you want to be really careful and be ready to adapt should these market conditions change. So, let’s go ahead and we can open up the Spy ETF again. We’ll take a look more uh deeply at each one of these individual opportunities, but we can see that Spy, since that blue line crossed above the black line, up about 9%, and more recently, with that sideways price action out of the markets, well, we can see those predicted highs and predicted lows working each and every single trading day. You see here over the weekend, we come down to the previous Friday, and then most recently gapping up there and now again running sideways here, running into a lot of the news coming out here on Friday. But really, excellent forecast here via the SPY.
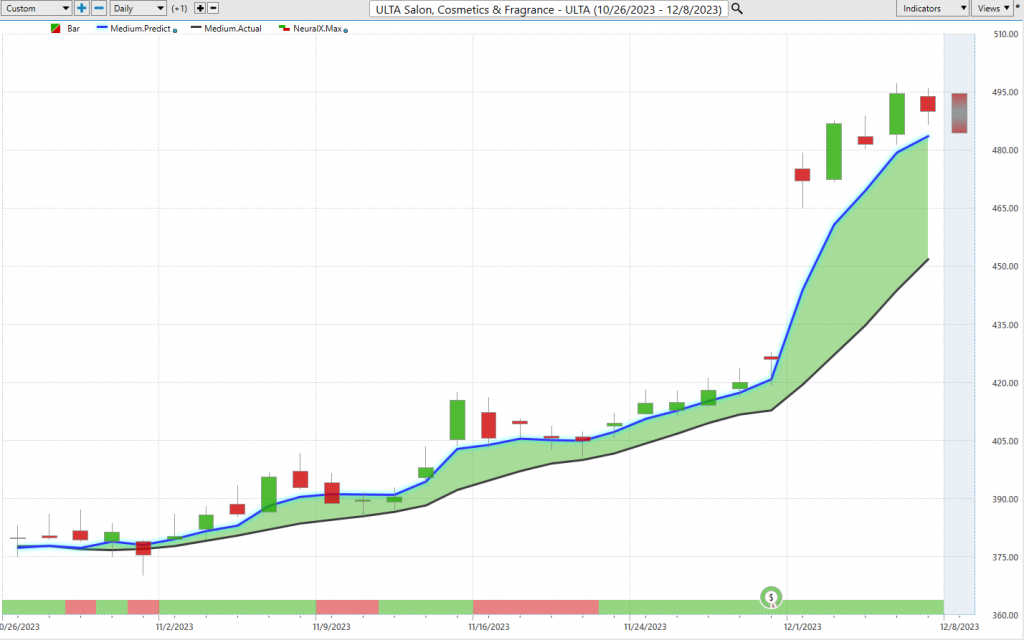
But let’s go ahead and look at something like Ulta Salon ($ULTA). Like Ulta, and we can break apart all of these predictive indicators. So again, what we have is daily price action here. Each one of these candles represents a full and complete trading day. And so, it’s right up against that price data. What you’ll notice is there is a black line value and also a blue line value. Now the black line that you’re seeing on the chart, that’s a very traditional technical indicator. That’s actually a simple moving average, and in this case, it’s a 10-period simple moving average. So what it does is it just takes the last 10 closed prices, adds those all together, and then divides by 10. And so, that works as a measure of really letting us know where market prices have been. But it’s obviously non-predictive, and all of that data from the previous 10 days has already occurred and is lagging the market. And so what Vantage Point Traders are able to do is actually compare that 10-day simple moving average or lagging moving average to this proprietary predicted moving average. Essentially, whenever that blue line crosses above the black line, well, it’s suggesting average prices are going to start moving higher. And this is where this technology of artificial neural networks comes into play.
So traditionally, again, to generate a moving average or just take that past data, add that all together, well, what Vantage Point is doing is looking at really dozens of markets that are known to drive and influence the future price of Ulta. Well, this can be things like the Spy. This can be things like other individual stocks, maybe in the consumer cyclical and makeup space. This can be broader ETF markets, it kind of groups up large groupings of stocks, all the way down to things like the dollar Index or gold or copper or oil prices. So depending on the individual stock, it’s going to have its own unique set of intermarkets that are known to affect and drive future price. And so what we do is we take those intermarket relationships, use those to generate future price predictions, essentially you know the data set for those neural networks taking in that huge amount of data is all the relevant markets that are known to share market relationships. And it’s those price predictions that are generated by the technology that are actually used to construct these indicators. So rather than all the values being lagging behind the market and really just readjusting to what’s most recently occurred, well, now we have a forward-looking predictive tool.
So whenever that blue line crosses above the black line, again, you can think of that average prices. Trend Traders can really use this to get ahead of the trend and identify reversals and shifts in the marketplace. So here we see Ulta up about 29% in 29 trading days. Not a bad place to be, starting through the month of November there. But more importantly, you really hone in on the forecast here. We have very short-term indicators to help the trader navigate this situation. And so you see that this blue or this red and green line at the bottom of the chart, this gets updated every single day, and it’s forecasting short-term strength or weakness. So it’s not looking at the overall trend like our predicted moving average. It’s short-term strength or weakness over the next 48 hours. You can think of that as two candles moving forward for those forecast. And this has an extremely high level of accuracy associated with its predictive indicators, upwards of, you know, 80 plus% across a wide number of markets, whether again Futures, stocks, Commodities, ETFs.
And so whenever we see that blue line cross above the black line, and that neural index bullish, well, we should expect that momentum to heat up in the market. But markets don’t always go straight up, and you see how the neural index gets bearish here. We get a little bit of sideways price action, some lower lows over the subsequent couple of days. But that’s what Traders need to understand to say, okay, well, the trend is still up. We may get weakness over the next couple days, that doesn’t invalidate this trade idea.
So lastly, we’re even given a predicted high and a predicted low. So now we’re within the overall trend. We’re within 48 hours. We’re down to next day’s predicted highs and lows, and you see how these levels just are excellent for Traders to be aware of. Here in Ulta, we get these nice opportunities early on in the move. We actually had earnings here, where we see a lot of this volatility heat up. But this is a market where there’s plenty of opportunities to establish positioning, give yourself plenty of cushion going into those earnings. We see again some really nice moves actually where we see those earnings reports. So good example there from Ulta.
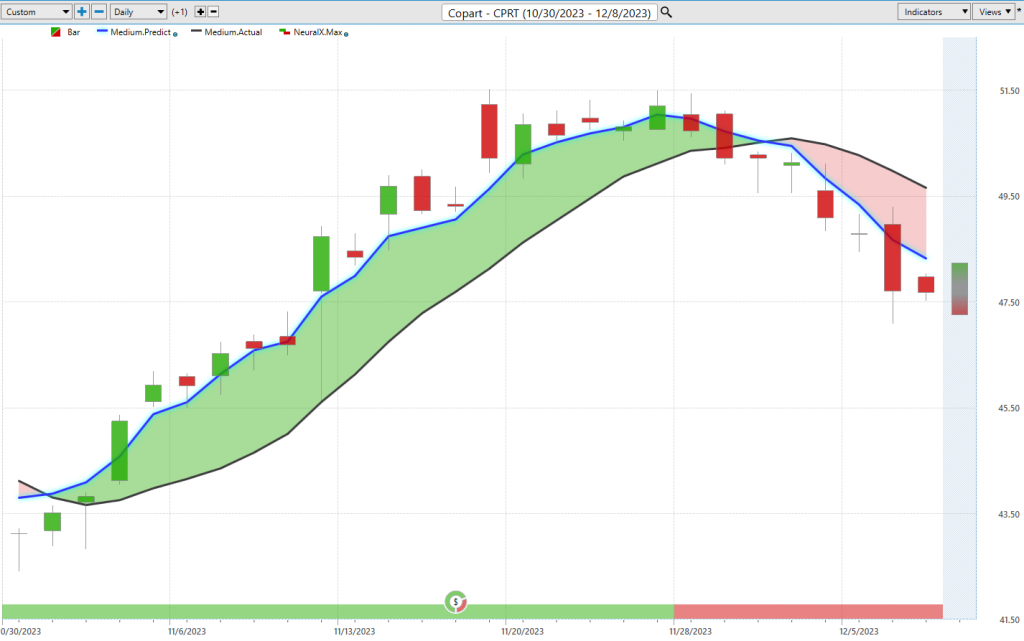
Let’s take a look at Copart here. It’s a really strong stock, but look at this forecast. We get the Blue Line crossing above the black line, neural index bullish. But something has drastically shifted here. So in November, if you wanted to trade Copart, well, excellent – you had a blue line above the black line, and the neural index was bullish. We had all these guidance from the short-term predicted levels to accumulate a position. But when we start seeing that short-term weakness shift, and of course, the Vantage Point predicted moving average shift, well, not only should we not be going long and take profits if there are any long positions, but potentially even short. We see it came up to this predicted high, and we’re seeing that weakness play out in certain stocks. This is where you need to be really careful because we may have a shift here. If the dollar starts moving up, it can push stocks lower. So we may get a real mixed bag as far as which stocks hold up and which stocks really get punished here, potentially due to some dollar strength.
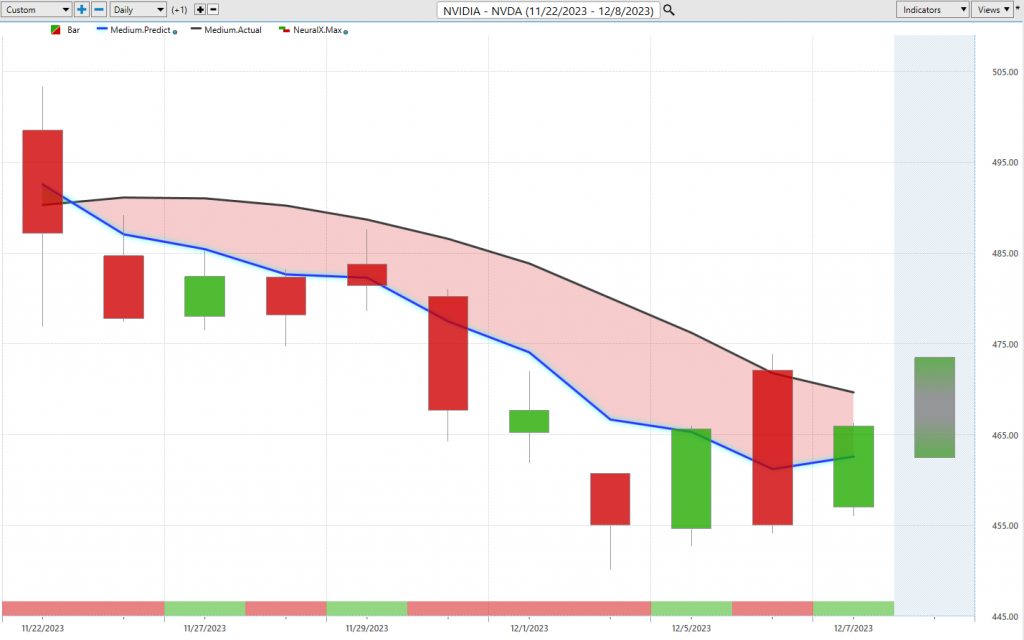
Now, here’s Nvidia ($NVDA). We talked about this last week – again, one of these really strong stocks and potentially a warning for some weakness in the broader market. We’ve seen a lot of strength in Nvidia, as it’s one of our leaders in the broader market. Here, Nvidia, you see this crossover to the downside. We talked about this last week, whether you want to be shorting or going long on Nvidia this week. We can see that even this week, well, the easier trade has been short, up towards these predicted highs. We start moving lower. Maybe it’s not the best place to short, considering Nvidia is a strong stock, but it’s highlighting that this is not in an uptrend. And if we start seeing things shift lower like Copart and Nvidia, these will certainly be the areas that are primed to suffer.
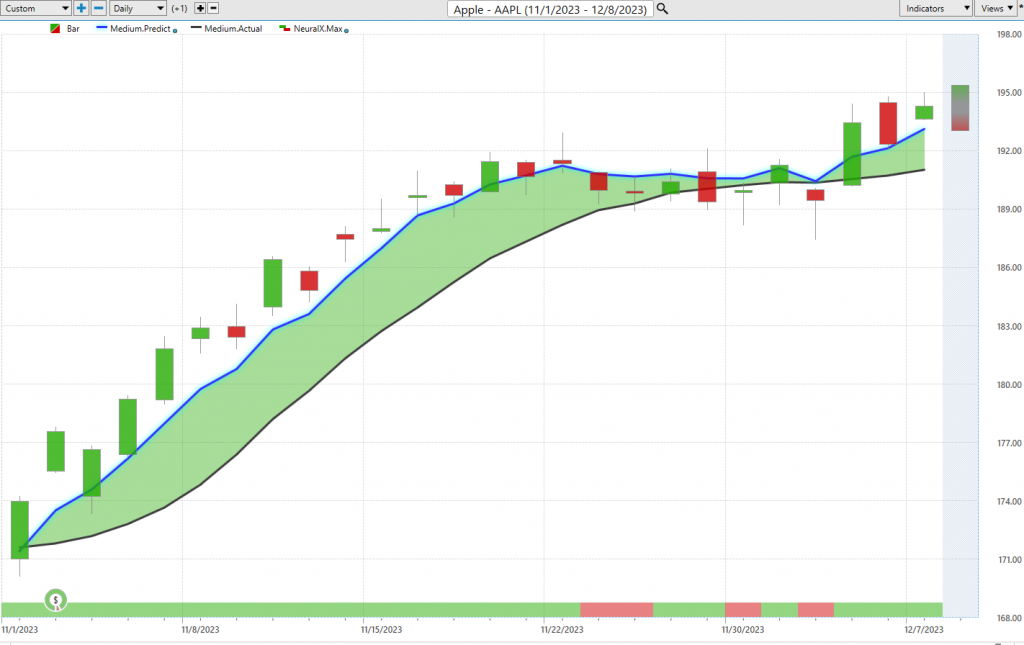
Here are shares of Apple ($AAPL) we spoke a little bit about this last week. Just as an example of okay well there’s other places that don’t look like Nvidia right where that blue line has maintained above the backline, and open up some better places to trade this. Looking a lot more like that spy ETF and again highlighting all these areas down here at these predicted lows. Sometimes when you come over the weekend here you’ll see this and as you utilize the technology you’ll get more familiar with identifying these price levels but here’s a Friday and you see that what happens you get that ILliquidity over Friday through Monday. You run right in through the Friday predicted low and you were immediately moving higher and continuing that uptrend there so a little bit more strength there uh in shares of Apple again. A really nice move over the month here we’ve had you know really a lot of different stocks where you can get exposure to this nice move um through the broader markets, but you see about a10% rally here here uh since those predictive forecasts have gotten bullis hand many opportunities to buy take some profit as the market grinds higher.
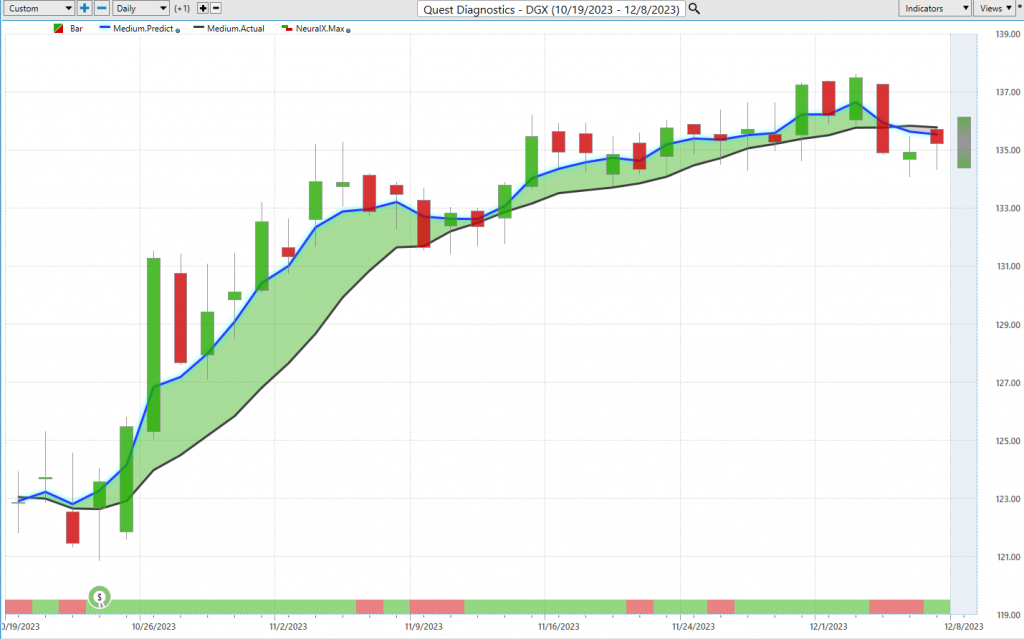
Now, here’s Quest Diagnostics ($DGX). This was an opportunity that we brought in before November because we had this crossover to the bullish side. There was a lot of momentum in the stock, and I wanted to keep bringing this in week after week to highlight the accuracy of the predicted highs and lows. So as the volatility kicked in, you see how these predicted lows came in every single day, updating each week. You know, we can’t change these levels after they’re set in, but you see that something started to shift here in Quest Diagnostics. We had numerous good buying opportunities, but as we see, just like that blue line crossed above the black line here, preceding this, we had probably about an 11 or 12% move at certain points in the trade. But now we’re seeing that crossover to the downside. So again, identifying those markets where previously it was a great market to trade and take some money out of that bullish side. But maybe it’s time to navigate somewhere else in the market – maybe just trade the Spy directly and be more direct with your exposure if you still want to stay on the bullish side. But something is potentially shifting here, again, like we saw with Nvidia two weeks ago, highlighting that this is not really the place currently.
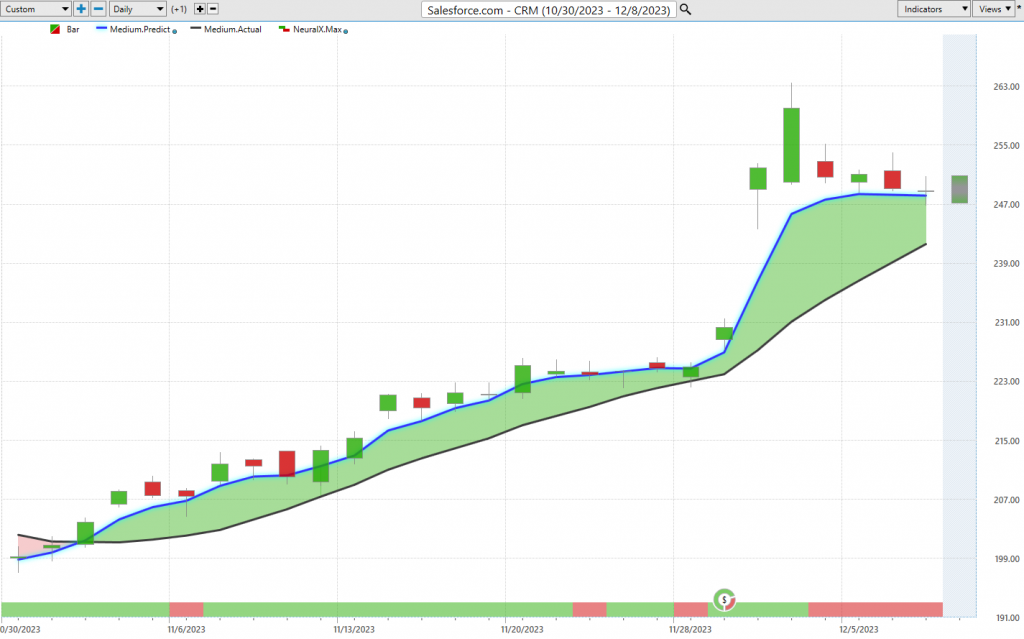
Lastly, we have shares of Salesforce ($CRM). Another good example of just a really bullish market in a broadly bullish market. We see this blue line crossing above the black line. We can look at those predicted highs and lows. And again, you don’t know exactly which day you’re going to move down to these predicted lows. But as a trader coming in, you know each day or throughout the week, you really know where you want to be, identifying some good places of value to accumulate a position. So you see here, you got one, two, three, four, five, six entries in the three or four weeks preceding this big acceleration and move to the upside. So again, really nice opportunities. But you know, a lot of this started in November. So when you can establish those positions and identify where those predicted moving averages are remaining above the actual moving average, well, great – that’s an area where you can trade.
In Ulta, we’ve got Quest Diagnostics, the early part here with Salesforce. But where you see that weakness, especially if you’re a shorter-term trader trading week to week, you just want to get out of the way. This is a pretty serious decline here, about a 5% decline, getting as bad as probably 7.5% as we see the predicted moving averages move below the actual moving average.
So, we’ll go ahead and leave it there. You do want to be a little bit cautious out here. We do have a dollar sort of moving around and trying to pick a direction. So we’ve seen a lot of big moves out of currencies like the Japanese Yen, and this all affects the markets that you’re trading, especially the US equity market. This is where the Vantage Point software does an excellent job of looking at those relationships, seeing how things are moving, and getting back on track. So you have a good tool to keep assessing this scenario and keep executing your strategies as efficiently as possible.
Once again, this has been our hot stocks outlook for December 8th, 2023. Thank you all for watching. Best of luck, and bye for now.


