Register for a Free Live Training
The Hot Stocks Outlook uses VantagePoint’s market forecasts that are up to 87.4% accurate, demonstrating how traders can improve their timing and direction. In this week’s video, VantagePoint Software reviews forecasts for IBM ($IBM), Electronic Arts ($EA), Gladstone Land ($LAND), McCormick and Company ($MKC), Crocs ($CROX)
Hello, traders. And welcome back to the Hot Stocks Outlook for December 30, 2021. Hope y’all are having a excellent week out there in the financial markets, and as always plenty to cover here in this week’s Outlook. So, we’re going to go ahead and revisit shares of IBM. We also have McCormick, which we’ve looked at over the past few weeks, but we’ll also look at EA, Electronic Arts. We’ve got Gladstone Land and lastly Crocs. So, a really great time to look at all of these opportunities, but also how the feature set here within Vantage Point helps traders make better trading decisions, really important going into a new trading year.
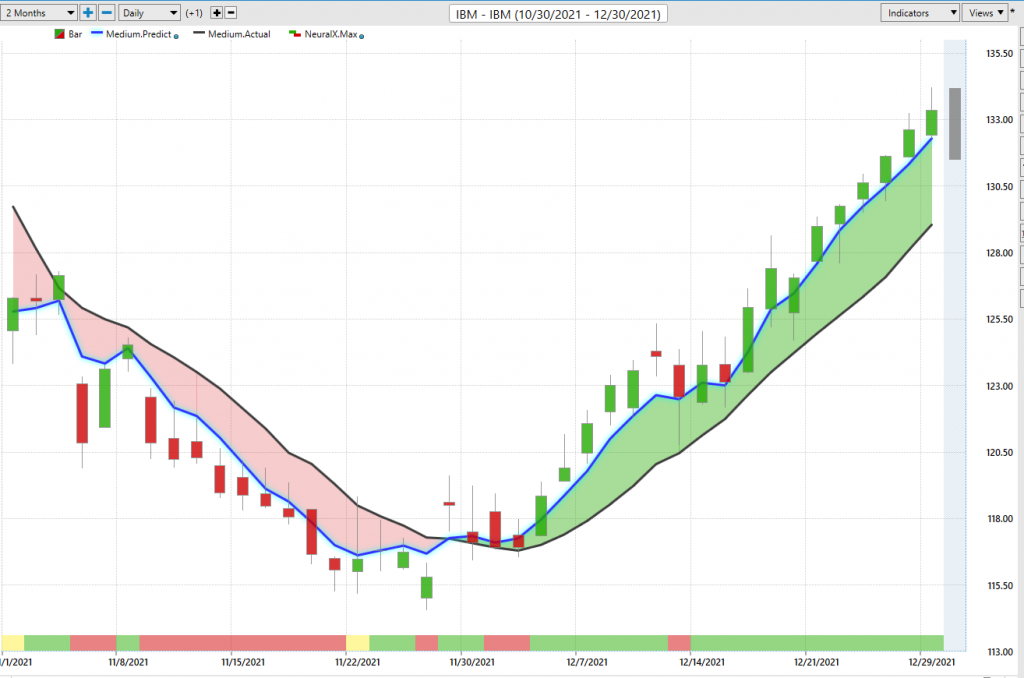
So, we’re going to start out here with shares of IBM, and what we have here is daily price action. So, each one of these candles is a complete trading day, and right up against the price action we have a black line and also a blue line.
Now, the black line that you’re seeing there, that is a simple moving average, and that’s a very common technical indicator. And what it does for us here is it looks back over the previous 10 close prices. It’ll add those all together and divide by 10. So, what it does is smoothes out the price data, and lets us know where market prices have been over a given period of time. But traders need to be ahead of the next move. And so what we want to actually do is compare that black value, or that simple moving average, or what we might call a lagging moving average, to Vantage Points proprietary predicted moving average. And for that number to get calculated and then plotted against the chart for the trader each and every trading day, this is where the technology of artificial neural networks come in. Now, specifically for shares of IBM, what’s going to happen is those neural networks are going to look at important market relationships that are known to drive and influence future price of IBM.
Now, that can be things like ETF groups. That can be things like individual stocks, global currencies, interest rates, global commodity to markets like gold, oil. So, what’s important to understand is that some of these relationships can be leading. Some of them can be lagging. Some of them be positive or inverse correlations. And that’s what neural networks are able to do is understand huge amounts of data, synthesize that and derive the important information that can be pulled out of that. But more importantly, what they’re also very good at doing is predicting what’s likely to occur next based on that data. And so that’s what’s going on is this data is incorporated into generating true price predictions that are then built into these indicators to make them actually forward looking and predictive. So, rather than having a moving average that is just going to get dragged around because of what has already occurred in the market, this is actually going to look forward and actually predict where things are headed next.
Now, it’s not just that predicted moving average. It’s just one aspect of this technology being applied to solve all of these different problems. But we can see that as that blue line crosses above the black line, we’ve seen really nice move in shares of IBM, about a 13, almost 14% rally in the past 21 trading days. But if you look at the very bottom of the screen here, you’ll see that you have a bar that goes from green to red, back to green. And this is also a indicator, and it’s utilizing that neural network technology, but for a different problem. And this problem being really short-term strength or weakness in the market over a 48 hour period. And it does is with an extremely high level of accuracy, upwards of 86, 87% accuracy across markets.
And so you can think of it being very conservative of getting it right, four to five times, as far as that short-term strength or weakness in the market. So, this is what’s going to help the traders navigate, hey, if I want to stay long, maybe there’s some short term weakness over the next 48 hours. Maybe I should look for cheaper prices. How you want to utilize that information depends on your trading style. Now, at the very right-hand side of the chart, though, you’ll also see that there is a, what you might call a shadow candle. That has a predicted high and a predicted low. And that’s provided before each and every trading day for the traders who actually have levels to set limit orders, profit targets, and it’s really the combination of these indicators that round out the forecast and how this technology is predicting what’s likely to occur next.
And so what we can do is take a look at how accurate all of those predictions are, and that’s really what we do each week to week. Look at these opportunities, bring them back in, show the up dated forecast. And so here in shares of IBM, we’ve seen the market continues to move higher, but potentially more importantly for the trader is having these predicted levels. You see these predicted lows being hit in the market pretty quickly and moving to the predicted high. Now, I keep pointing this out week to week, or these trading days like this where you see the market gaps down here. It trades up, and it doesn’t quite get to the predicted high. But then the next trading day, it gaps up and immediately goes and hits that predicted high. So, the level that’s being pulled out of there, very applicable, it’s just lagging a little bit.
And it’s the next trading day that it then comes through, and you see this often where it even looks like these predicted highs and lows are potentially off, but then you look a little bit more closely and see that it’s just hitting that previous day and continuing on. So, really nice opportunities here in shares of IBM. Just the past couple of weeks here about another 6% rally over the past seven trading days. So, a much smoother ride up. We’ve seen a lot of volatility around the S&P, but here in IBM, very straight ride forward and about a 6% rally.
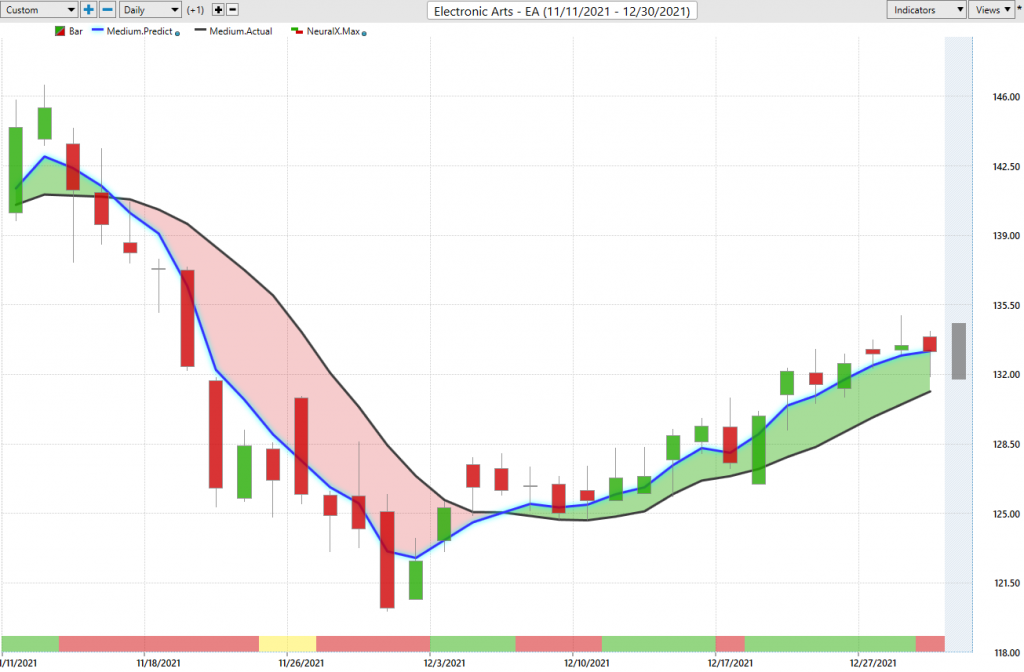
Now, let’s move forward with this same understanding of how this rounded out forecast helps the trader make better trading decisions. So, here in EA, we get this crossover the blue line crossing above the black line, but you’ll notice that the neural index is actually bearish there, which is atypical.
You typically don’t see that on a crossover, but you’ll also notice that you have lower lows over the next 48 hours of price action. Another way to look at this is if you have a accurate prediction of the predicted moving average, well, expect the market prices to trade below that or potentially towards those intrade predicted lows that Vantage Point provides. So, you see here again that predicted low being hit saying, hey, anticipate the market may want to move down there. It doesn’t quite get down there, but, fair enough, neural index gets bullish, and the trend starts moving higher. Things like this are just pretty phenomenal here. You get this closed down here at the low. The updated forecast is telling you before this trading day even occurs, expect the low to trade down here. And sure enough, the market gaps down, immediately trades higher, and then the trend continues.
Getting close here. You’re not going to hit these predicted highs and lows every day, but still acting as a very good guide is saying, where do you want to look for profit targets? And hitting this predicted low and at least intrade bouncing a little bit higher. And you actually see short term saying, hey, expect things to actually be a little bit weaker in the short term. So, every single day getting these updated forecasts, but that’s really what it’s all about is the adaptive technology working behind the scenes here. And once your trading starts incorporating those forecasts and start responding to these levels, you start getting the benefit of this technology manifested in your actual trading behavior. So, pretty nice opportunity here about a 6 1/2% rally here in just the past 14 trade days. Not a huge move, but more importantly, these short-term forecasts and how they work to help traders, really regardless of timeframe or style, make better trading decisions, minimize risk, and do all these things that you want to do here.
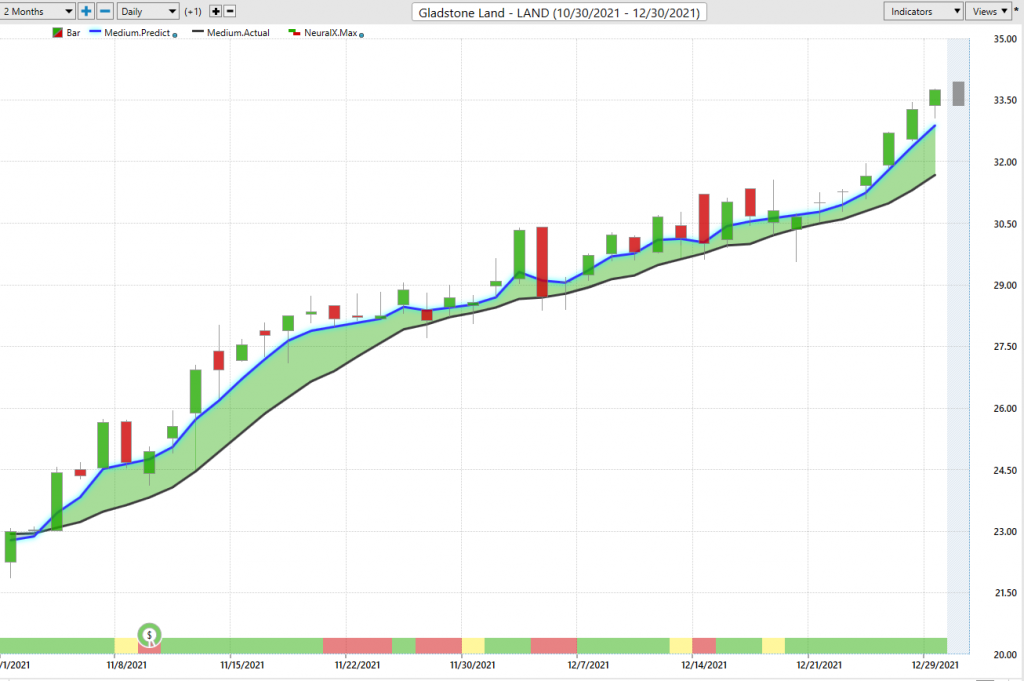
Now, here’s Gladstone Lands and I just wanted to bring this through, because this has obviously been an up trend for a long period of time. But if we look broadly at the forecast, we can see the neural index, getting bearish over some of these periods and things tend to run sideways. But I just wanted to have some of these longer periods like Gladstone and McCormick here to highlight some of these predicted highs and lows. And you’ll see periods like this here, where I just love things like this, where you move up and next day you see that you gap down. You go right to that predicted low level, and the trend continues. You see it again here. The trajectory airs to the upside. You blast past the predicted high, but this volatility comes in, where is it moving? To that predicted low level that you had identified. And then the market continues higher here.
Really great levels here. Even when the market runs sideways, you have a tool like Vantage Point and you can be taking pieces out of the market, and still be around for when that trend continues.
So, we see a very similar situation here in McCormick, which is now several weeks, we’ve been bringing this through and just highlighting that there’s been some areas of strength. Here used to be about a 38% rally. The consumer non-cyclicals McCormick leading the way here. But just, we’ve got a really nice move over the much longer term. So, that’s no mystery here. We identified that several weeks ago, and keep bringing this through. But what about the shorter term here where all this volatility is coming in? You see your train at 87 pushing up on 95 now.
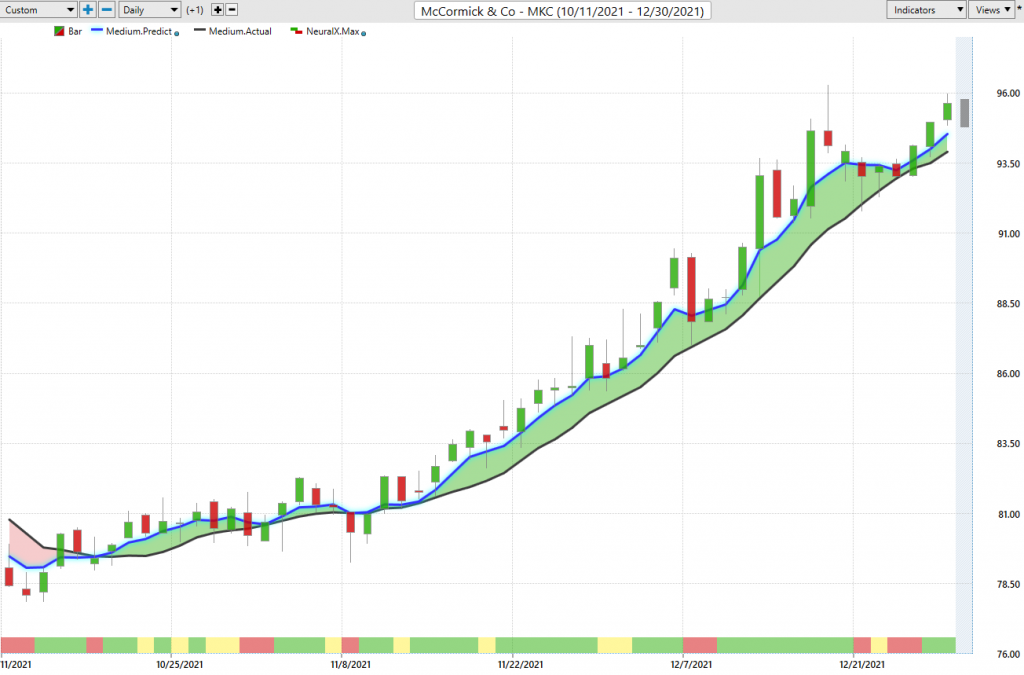
Well, what sort of guidance and levels are you getting from the tool? And so you see that moving forward you only want to be long. Just some really nice levels here. About this is the only day you get squirly at all, but just bullishness, very straightforward as far as the overall trend is up. You’d only want to be long taking profits on longs. You see neural index gets a little bearish here. You run sideways for the next few days, but once you get bullish things bouncing higher again. So, we’ve looked at this opportunity multiple times, but I just want to bring it through, update it, just to highlight that aspect of it’s not just about a big sweeping move, the 20% over 50 trading days. It can be more about those periods where you’re buying at predicted lows, taking profit, even when the market runs sideways, like it did in this period here in Gladstone. A lot of opportunity to make money with the right approach and management techniques but, of course, need to identify those opportunities and those important levels.
Now, each week I keep bringing in some bearish opportunities as well. Because as the S&P and markets have moved and hit new highs, the Russell hasn’t, and stocks generally are quite mixed. You see some things doing well, other things not quite picking up the steam that you’d really want them to. And there are some great areas where you can hedge the portfolio.
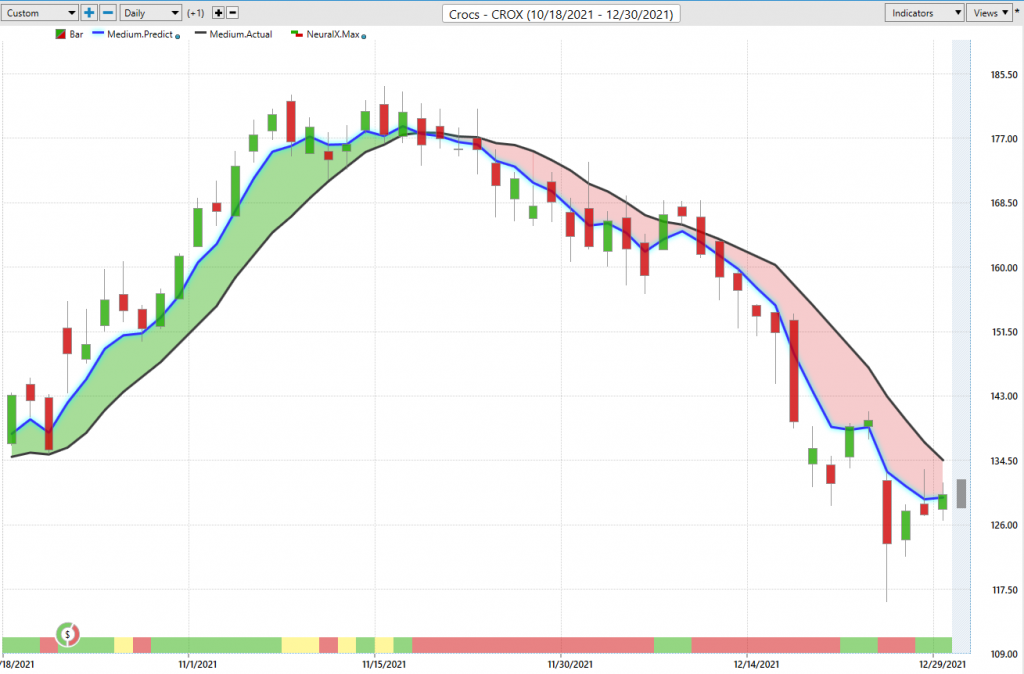
So, here in the exact same way you recognize this weakness here in Crocs’ blue line below the black line, really a lot of weakness, as far as just neural index over this time period as well. Indicating, look, all you’d want to do is short the market, take profits on short positions. But you see when these forecasts come through and you’re actually able to use tools like the Inteliscan to identify shifts like this in the market early, you can get those really great entries.
And those entries really act as nice safeguards to insulate the portfolio during periods of volatility. So that even if the S&P starts pulling back 2 or 3% and starts taking everything down with it, you have things in the portfolio that are really working and tend to accelerate in periods like that. So, here you see shares of Crocs, and just the updated forecast. Don’t mind the move from 179 down to 129. That’s fantastic. But all every single day where you get these updated forecasts so that you’re prepared to know where should you be looking to improve the position and really make the most of what’s in the portfolio and each individual opportunity here. So, 27% decline in the past 28 trading days where the S&P’s hitting new highs, but you don’t want to be in the wrong thing, certainly in a period like this. So, we’ll go ahead and leave it there. This will conclude the last hot stocks outlook of the year for December 30, 2021. Thank you all for watching. Best of luck, and bye for now.