Register for a Free Live Training
The Hot Stocks Outlook uses VantagePoint’s market forecasts that are up to 87.4% accurate, demonstrating how traders can improve their timing and direction. In this week’s video, VantagePoint Software reviews forecasts for Oracle ($ORCL), J.P. Morgan ($JPM), Hasbro ($HAS), Fastenal ($FAST), Take-Two Interactive ($TTWO), and Under Armour ($UAA)
Hello again traders, and welcome back to the Hot Stocks Outlook for December 2, 2022. Hope y’all having a excellent week out there in the financial markets, and as always, plenty to cover here in today’s outlook, even with a little bit of a shorter holiday week this week.
We’re going to be reviewing many of the markets that we looked at over the past couple of weeks, it’s a really great time to really understand how these short-term predictive forecasts update for traders. But if you haven’t already, make sure you go ahead and sign up in the description below. You can get a live demonstration and learn more of the specifics about how this technology is going to help you as a trader make better trading decisions, which is really what it’s all about.
So we’re going to start out here, we have shares of Oracle, we’ve got JP Morgan, Fastenal, Hasbro, Take-Two, and Under Armour. Again, a lot of markets we’ve looked at over the past few weeks. But starting here with Oracle, it’s a really good example of how all of these predictive indicators work together. So if you’ve never seen a Hot Stocks Outlook before, this will get you up to speed.
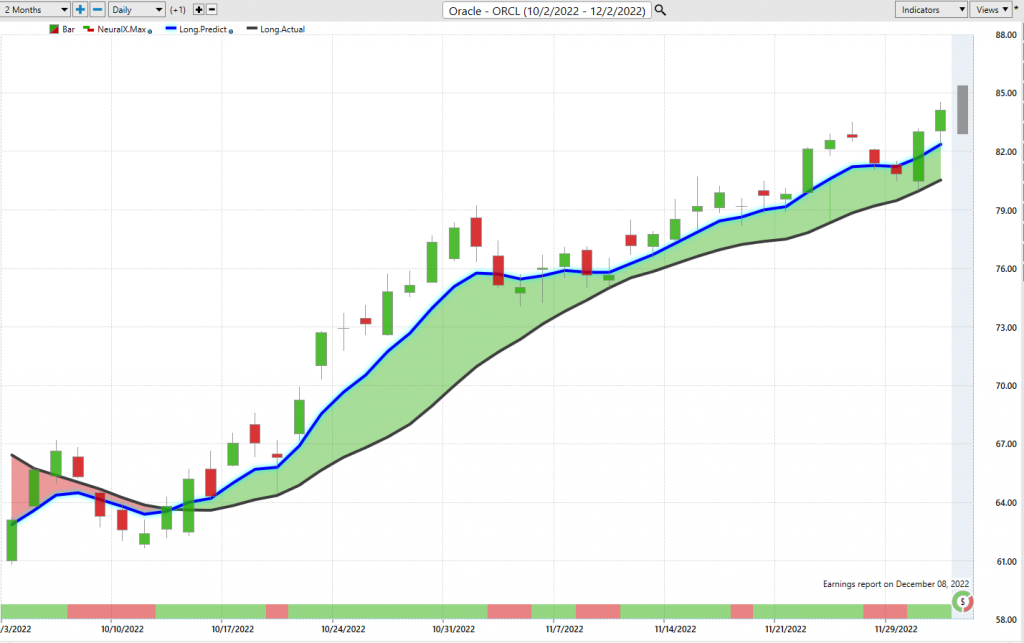
And so what you have here is daily price action, so each one of those candles represents a full and complete trading day. And right up against that price data, what you’ll see is there’s a black line and a blue line. So that black line value, that is actually a simple moving average, and in this instance, it’s a 10-day simple moving average. So it just looks back at the previous 10 close prices, it’ll add those all together and divide by 10. So what this acts as for us as traders is really is a baseline, letting us know where the market has already been over a given period of time, but obviously a trader wants to know where’s the market headed next. And so what we’re able to do is actually compare that black, lagging simple moving average to this blue line, or what you might call a proprietary predicted moving average. And for that number to get plotted and calculated every evening for the trader, this is where the technology of artificial neural networks come into play, and what they’re performing is what’s called intermarket analysis.
So what that means is it’s understanding how markets are driving and affecting the future price of Oracle, but that’s going to be markets like things like the Nasdaq, things like ETF groups. If you’ve been looking at currencies, you’ve seen the dollar index has been going lower, and you’ve seen stocks and the indexes do quite well, and asset prices do quite well. Gold shoot up. So all of these things are factoring into your portfolio, but specifically for Oracle, well, how might individual stocks, or the value of crude oil, or the gold market, or interest rates be affecting that market that you’re trading as well? So what it’s able to do is take in all this global information, use that neural network process, and generate highly accurate predictions, which that’s what artificial intelligence and neural networks are good at, is taking in huge amounts of data, leveraging that data, and making a highly accurate prediction. And so what we’re able to do here is actually use that predictive data to generate these indicators. So rather than having a rearward looking tool that’s going to get dragged around, we have a forward looking predictive tool.
And so when we see that blue line cross above the black line, it’s suggesting average prices are going to start moving higher essentially, and we see we got a 9% rally over the past 15 trading days here in Oracle. So again, just 100, 200 shares there is up over $1,000 just over the past few weeks. Now here’s what’s important though, is there’s these other tools here. If you look at the very bottom of the chart, you see this bar that goes from green to red, back to green, and this is another indicator but tuned to solve a different problem. And the problem here is very short-term strength or weakness in the market. So again, you’re utilizing that neural network process, but it’s not looking at future average prices like our predicted moving average, it’s looking at just short-term strength or weakness over the next 48 hours. So very short-term, it’s only looking ahead very short-term, and then it gets updated.
And so what you’ll notice here is as you see that neural index towards the middle of the chart go bearish, you’ll notice that you actually do get some lower lows over the next couple days. You’re trading below that close, that previous close. You see again here, the neural index gets bearish, and again, some lower lows over the next 48 hours, but the overall trend is still up, that blue line is still above the black line. And so we can see here, if we want to round out the forecast of really its entirety, you’re also provided this predicted high and predicted low range. So very, very short-term levels to let you know where they’re likely buyers or sellers in the marketplace so you can plan your strategy and approach. Well, what we can do is look at those predicted highs and lows against the actual market date. And so last week what we’re looking at is, “Okay, well, really great entries early on here.” You see, you can always buy a little bit before that predicted low knowing that, “Look, that’s the area where you want to be looking for prices to move.”
And we talk about this quite a bit is when you have these predictive levels, you will notice sometimes the market goes and hits one of those previous levels. Now when you know that that’s there, and you know want to be a bull, well, this gets quite simple. But you’ll notice here, this is this week, and this is what I want to highlight as we work through these subsequent forecasts, we got this sell off Monday, there’s news out of China and Monday also, you just get this gap down. But this is where artificial intelligence and neural networks are really great, is understanding what shifted there, what changed, and how important is it? How is it affecting things moving forward? So you’ll notice that the predicted highs and lows, look how accurate these are all through the week, letting you know, “Look, the overall trend is still up, but expect the market to move down to these levels.” And sure enough, we get that really strong rally on Wednesday, and where does it benefit?
Well, Oracle benefits because Oracle’s, well, still in a pretty strong up-trend as we see that blue line still well above the black line. So again, we can bring in those predicted highs and lows, and you just see the overall forecast that if you know you want to be a bull here, you’ve got a very good outline and roadmap moving forward to help you manage that opportunity. And this is really what it’s all about, is managing opportunities, and adjusting and adapting to the changing market conditions.
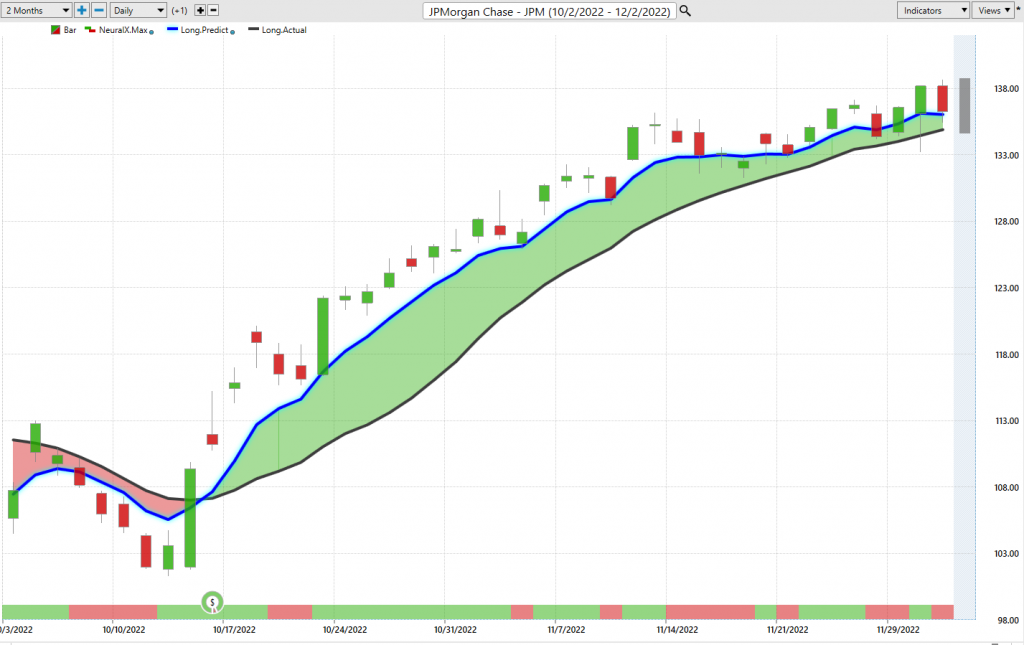
So here’s JP Morgan as well. Again, I just want to update the past few days here with these predicted highs and lows. But you again, see that Monday we get that move lower, but the overall trend is still up here. So let’s look at those predicted highs and lows and say, “Okay, well, how do we want to think about the week going forward?” Again, look at this day. You have a predicted low, the very next trading day, it gets almost exactly to that level. We can see exactly here we have a predicted low level of 133.35, the actual low was 133.19, not too bad.
Next trading day, same thing. We have a low 135.43, the predicted low, 136, and you see you close right in the middle there. Now you are seeing, you’re getting a downward slope, you have that neural index bearish. So again, some information to help you manage the potential opportunity, but this is critical here. Now, if we move forward, and again, well we can look at the total opportunity thus far, we’ve had a really nice rally there, but we’ve had a rally throughout the marketplace. So it’s not just JP Morgan, there’s other financials and things doing well. 22% rallies over the past 34 trading days getting a pretty significant move of a couple hundred share purchase.
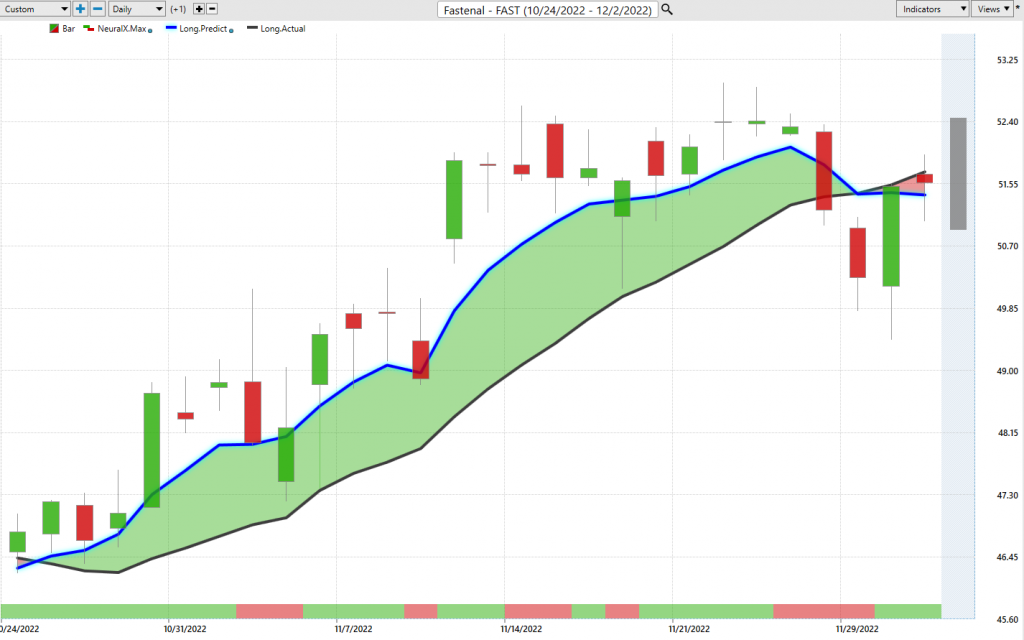
Now, here’s Fastenal, I just wanted to highlight how things can be different. So we looked at this a couple of weeks ago, but look at what happened here Monday. You got that move lower, but this created this blue line crossing below the black line. And so very different from what you’re seeing with Oracle, JP Morgan. Something very important has shifted here, and you want to take that into account.
So again, you’ll notice that, well, what was the next day’s predicted high? While it’s about right here, the predicted high is 51.48, the next day is high, there was 51.54. But you see that if you’re thinking about continuing strength in the market, well, there’s probably better places to do that than Fastenal, that blue line’s still well below the black line and not looking like in some of these other opportunities. So this is how you can skew the portfolio into things that are working and get away from things that are no longer working. So got a really nice rally here, some great opportunities as the market rally, about 11.5% move, we can of course take a look at those predicted highs and lows over that time period. And you get many entries, as this market continues to move up, where you can be taking profit. But what you want to understand is when that shifts, where you need to shift the behavior and adapt.
So moving forward, let’s take a look at Hasbro with that same theme.
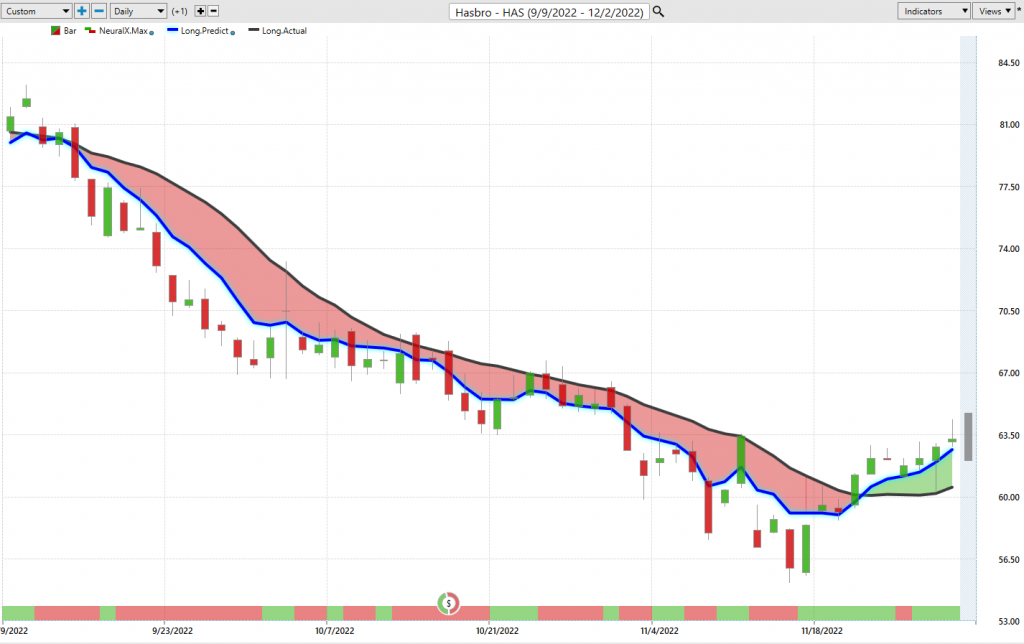
So Hasbro is one of these markets that I just kept bringing in week, after week, after week, because it kept looking very bearish. And so if you have things that are working, and the trend is still moving lower, well, just keep highlighting Hasbro, and keep using the predicted lows to get short and take profits on shorts. But last week, what we highlighted is that there’s been a very important shift here, and when you understand that that shift has occurred, well, let’s look at the subsequent predicted low and high values. Well, here’s your predicted lows getting hit in a bullish market. This was a market where you clearly wanted to short… Take profits on shorts. Well, this last week, what’s been the appropriate play? Well, actually buying down here, let’s see what the predicted low is down here at 61. So buying down here at 61, and the market just recently topped out at 64 just yesterday. So again, this is what short-term traders can use. You might be a day trader, shorter term trader.
What you really need to understand is when these shifts occur in the marketplace, and when that behavior should change from shorting and taking profits on those shorts, to actually going long and taking profits on some long positions.
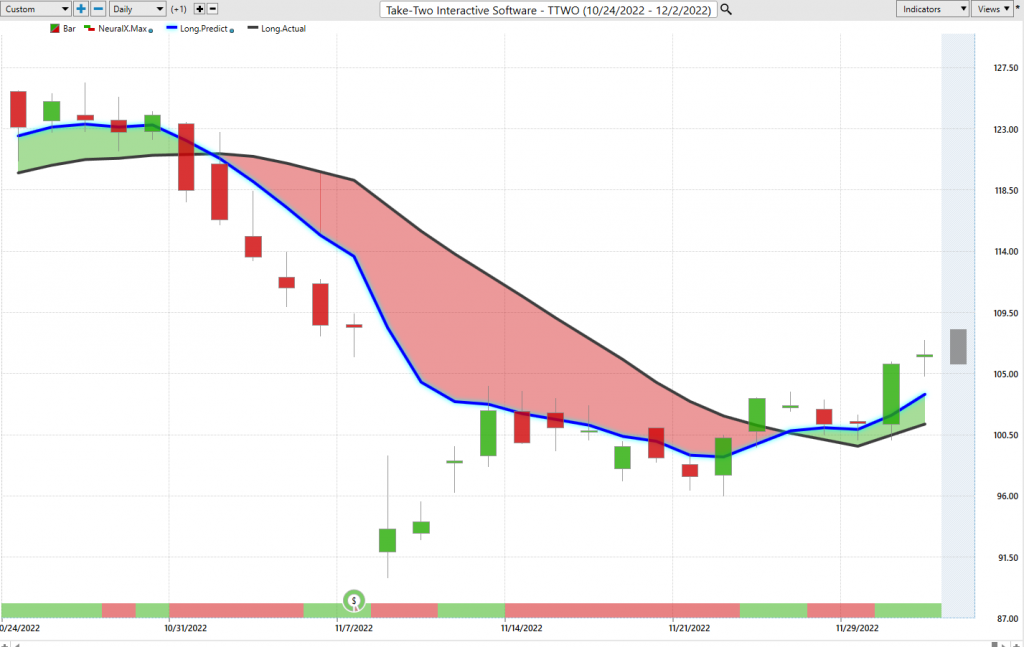
Take-Two Interactive, another one of these opportunities we highlighted with excessive weakness. We saw shares like EA and other tech stocks actually doing really well, and bouncing higher, video game stocks, but not here in Take-Two until, just like Hasbro, we see this crossover to the upside, neural index bullish. Now, you see the neural index gets bearish here, and you get those subsequent lower lows over the next 48 hours, but clearly you can see that that blue line is solidly above the black line, and you therefore, again, would want to be looking to buy down at these levels and looking for a move to the upside, and then take profit at higher levels. So again, just very short-term, these are things that are shifting, and we’re just really updating these forecasts. But this is the whole point.
So as you, as the trader, can understand when these shifts are occurring in the markets that you’re participating, and then structure that portfolio to stay bullish where you want to stay bullish, but then also take some profit or maybe even hedge some opportunities where things look the opposite. Things look bearish, it might be a good hedge for some of those bullish opportunities. Lastly here, shares of Under Armour, and again, one of these things that we’ve brought through a couple weeks ago, but blue line over the black line. You see you get this sideways price action for a while here as that neural index goes bearish, but the overall trend’s still remaining up, that blue line is definitely above the black line. And you can say, “Okay. Well, how am I going to think about this moving forward over the past couple of weeks?” Well, you want to be buying down at these predicted lows, taking profit on the longs, but certainly not selling or going short as we’ve seen shares continue to move higher. And as the S&P ticks higher and dollar goes lower, well, a lot of these things really benefit.
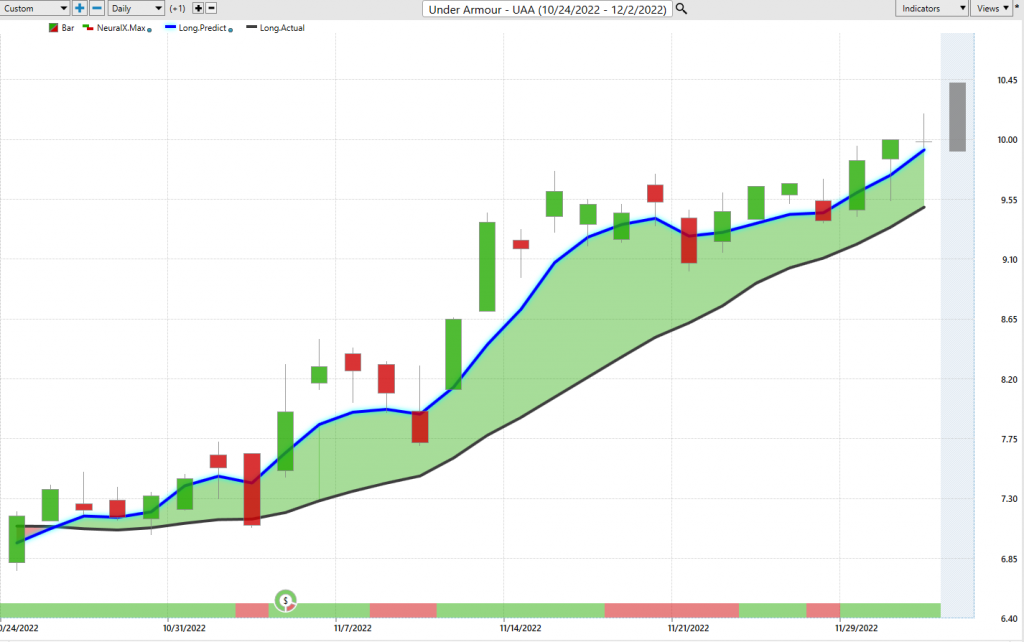
So here in shares of Under Armour, there’s a 38, 39% rally over the past 27 trading days. Obviously, this is a very, very cheap stock, you can bump that up to 2000 shares pretty easily, and you’ve got a pretty strong position working for you. So we’ll go ahead and leave it there for today. I really just wanted to update a lot of these short-term forecasts. So the whole thing is having this tool day in and day out to make those better trading decisions and adapt as a trader. And so what we’ve seen in the marketplace is a lot of things do really well, a lot of markets and bullish trends, but there are some dangerous areas out there, and some things where if it’s clearly in a down trend and not working, you just don’t want to be in those markets. So while you’ve seen, again, the S&P do well, a lot of these markets do very well, you want to be cautious and you want to have some good tools that are going to be working for you to make those better trading decisions in a consistent way.
So we’ll go ahead and leave it there. Once again, this has been the Hot Stocks Outlook for December 2nd, 2022. Thank you all for watching. Best of luck, and bye for now.