Register for a Free Live Training
The Hot Stocks Outlook uses VantagePoint’s market forecasts that are up to 87.4% accurate, demonstrating how traders can improve their timing and direction. In this week’s video, VantagePoint Software reviews forecasts for SPDR SPY($SPY), QUEST ($DGX), Nucor ($NUE), McDonalds ($MCD), Ulta Beauty Supply ($ULTA), Darden Restaurants ($DRI). NVIDIA ($NVDA), Royal Caribbean Cruise Lines ($RCL),
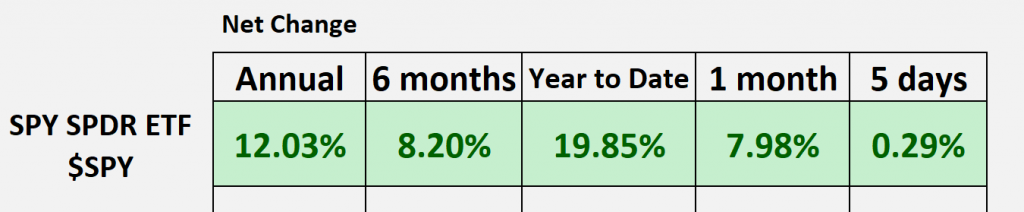
SPDR SPY ETF ($SPY)
Hello again, Traders, and welcome back to the Hot Stocks Outlook for December 1st, 2023. I hope you’re having an excellent week out there in the financial markets. As always, we’ve got tons of new opportunities to focus on in this week’s Hot Stocks Outlook. If you haven’t already, make sure you go ahead and click on that link in the description below. You can get yourself a live demonstration and learn all the specifics about how this artificial intelligence technology can help you make better trading decisions in the marketplace.
Now, as we typically do, we like to take a look at that SPY ETF, essentially, to get that view of the broader Equity markets. And so what we can see is really over the past couple of weeks, we talked about this last week and how Vantage points predicted highs do a really good job, the predicted lows and highs, even when the Market’s running sideways, and not doing much. And that’s really been the last couple of weeks in the S&P 500. That’s coming off an excellent month of November, right? So we saw all those indices start to turn up, the S&P, the Russell, and it opened up a tremendous amount of new opportunities. And that’s pushing this year-to-date number up towards 20%. So really exciting things out there in the marketplace.
But of course, we want to have the right tools to identify where are those opportunities opening up.
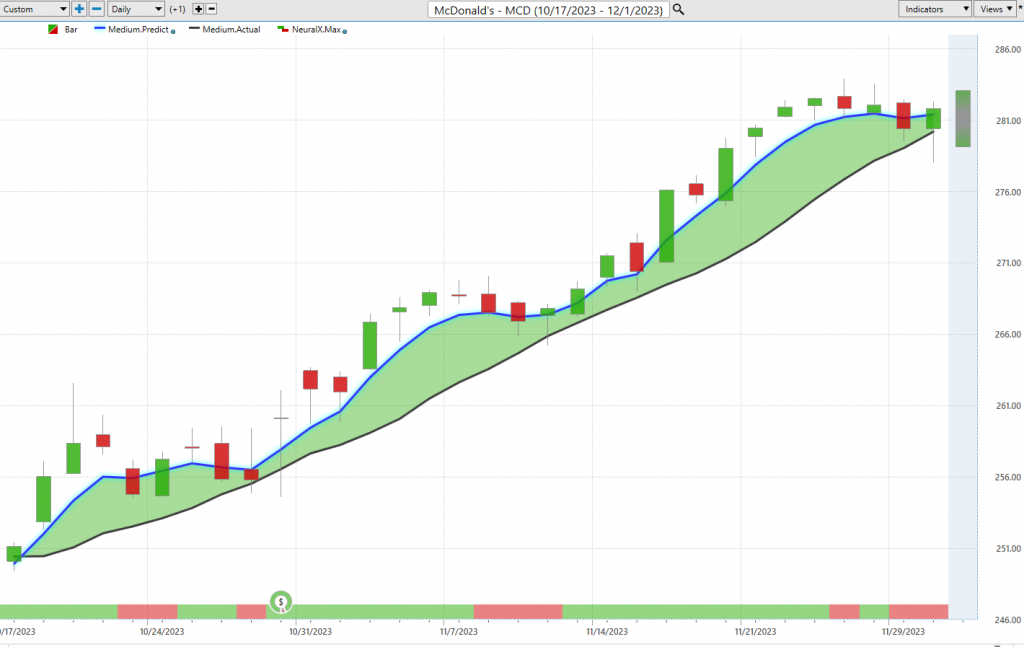
So let’s go ahead and start out here with shares of McDonald’s. This is a really great example of how this really collective suite of indicators work to help Traders navigate the marketplace. And so with McDonald’s here, what we have is daily price action. Each one of these candles is representing a full and complete trading day. And it’s right up against that price data. What you’re going to see here is a black line and a blue line value.
Now, what that black line value is, is that is a simple moving average. This is actually a very common technical indicator. We refer to it as the actual simple moving average. And in this case, what it does is just look back over the previous 10 closes. It’ll add those all together and then divide by 10. And if you’re familiar with moving averages, well, the problem with that is that all that data is really just coming from the past and those previous close prices that have already occurred. And obviously, Traders want to be anticipating what’s coming next and get ahead of that move.
And so what we’re able to do is compare that actual or simple moving average to this proprietary predicted moving average. And you can think of this essentially as a forecast of future prices. And so whenever that blue line value crosses above the black line, it’s suggesting average prices are going to start moving higher, and therefore the trader can think about their trading strategy. Maybe you’re a swing Trader wanting to get started on a move. Maybe you’re a day trader and recognizing that, okay, now’s the time to start exploiting that bullish side. Regardless, you have a really complement of tools here to help you navigate.
So, the first thing is what we see once that blue line crosses above the black line, and we’ve seen that it has not crossed back below, well, we’ve had an 11 and a 12% rally over the past 31 trading days. But really, the beauty of all this technology and how this all works together is really this suite of indicators from our predicted moving average, the neural index at the bottom of the chart, and we also have a predicted high and a predicted low that’s provided before each and every trading day, going into the next day. So you really have excellent levels to know where the market is likely to trade and where there’s places of value.
And so what we can see here is with our predicted neural index, as opposed to the predicted moving averages, it’s going to give us that overall trend direction. The predicted neural index is tuned to solve a different problem for Traders, and this problem is short-term strength or weakness over a 48-hour period. Right? So these neural networks have been trained to really hone in on that 48-hour period and have a very high accuracy rate attached to its indicators. So what you’ll notice is as that overall trend is up when the neural index gets bearish, we tend to get these sideways price actions, and you see some closes coming in a little lower than those previous closes. But as the trend resumes and neural index gets bullish, we see all that momentum come back into the market.
Now, that alone would really help Traders navigate things day-to-day. But on top of that, we’re given this predicted high and predicted low range. So every single day, again, before the trading day occurs, what will occur is we’ll have an actual trading day here, and it will fill in the candle. But those prediction levels won’t change. And so what we can see is how accurate all of these predicted levels are before these trading days ever occurred. And you can see if you have a limit order waiting, you’re getting excellent price levels day after day after day after day. There’s about 11-12 entries here as that market moves up about 12-13% over a short period of time. This is the thing that we want to be aware of is understanding that look, McDonald’s specifically, it turned higher here. These are the opportunities to accumulate a position.
And then we had everything turn higher in November. McDonald’s really benefits off that as well.
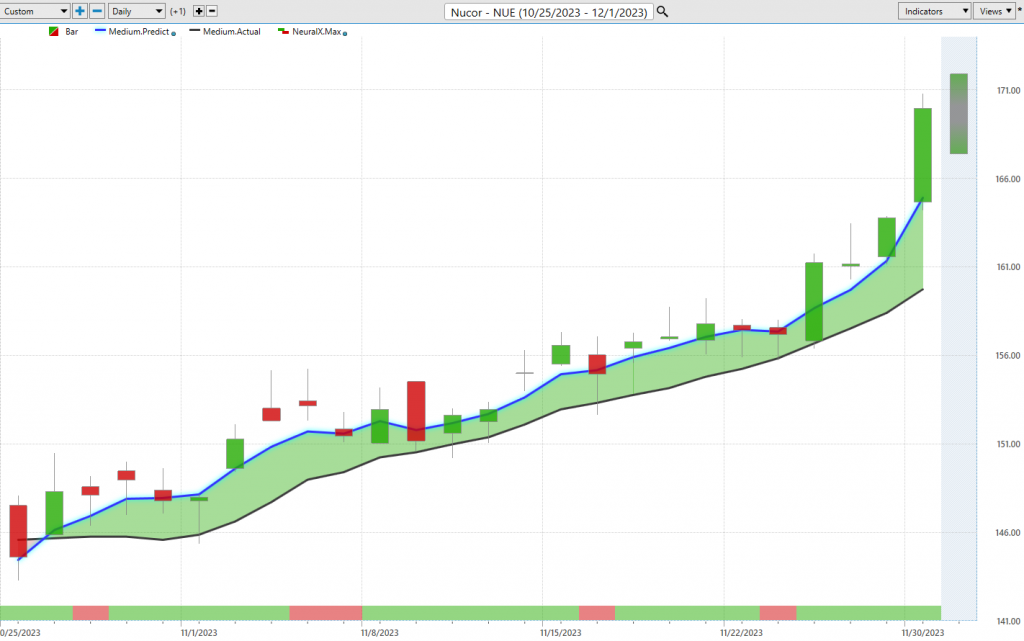
But let’s look at NuCor right? So another example here, an individual stock. You see at the beginning of November, we really started to see a lot of the broader Market turn higher. But specifically, if you want to trade New Core, well, what’s going on? Well, here the trend has shifted. You see this neural index goes bearish. You get a couple of sideways days, but more strength coming in, a couple more sideways days, more strength, sideways. Here’s, I’d say the one incorrect day on about, you know, 30 days of price action here.
But this is how these tools are going to help you navigate this and understand. Look, New Core, steel stocks, don’t be short here. I mean, it’s kind of hard to make an argument to short anything in the market right now because we have dollar weakening, and this is where these intermarket relationships are playing out and helping forecast these future prices for, in this case, New Core. So this is actually a good opportunity to, you know, explain a little bit about these artificial neural networks that are working behind the scenes. So New Core is an individual stock, and what’s happening is we know other markets that are known to drive and influence the future prices of specifically this stock. Well, that can be things like those other steel stocks, right? Maybe a US Steel, maybe Steel Dynamics, some of those things. There’s going to be competing stocks that share inverse relationships, but there’s also going to be broader Market relationships like what’s going on in the S&P 500.
What’s going on in the value of the Dollar Index? What’s going on in silver, copper, or gold prices? And so it has this global approach to look at all these market relationships, those competing relationships, and really pull out a lot of very interesting data and price clues to help us make these very accurate price predictions.
So what it does, it takes that data and actually generates future predictions of price, and it’s those artificial intelligence neural network-driven future prices that are used to calculate these indicators. See, so that’s much different than just calculating indicators from things that have already occurred and will always be lagging and non-predictive.
Here we can see with New Core, we’ve had a tremendous rally, about a 15% rally over the last 25 trading days. But look at these predicted highs and lows. This is where it’s looking at, okay, what’s going on in NuCor? How is the S&P pushing down? How’s the dollar pushing up and affecting these very short-term price levels? So that instead of chasing the market, you can really accept good prices and participate in what’s been a really fantastic move we’ve had over the past month here. So again, you see about, you know, six, seven, eight entries over this really nice rally in New Core and many of the other steel stocks and really the broader market in general as we look at that S&P 500.
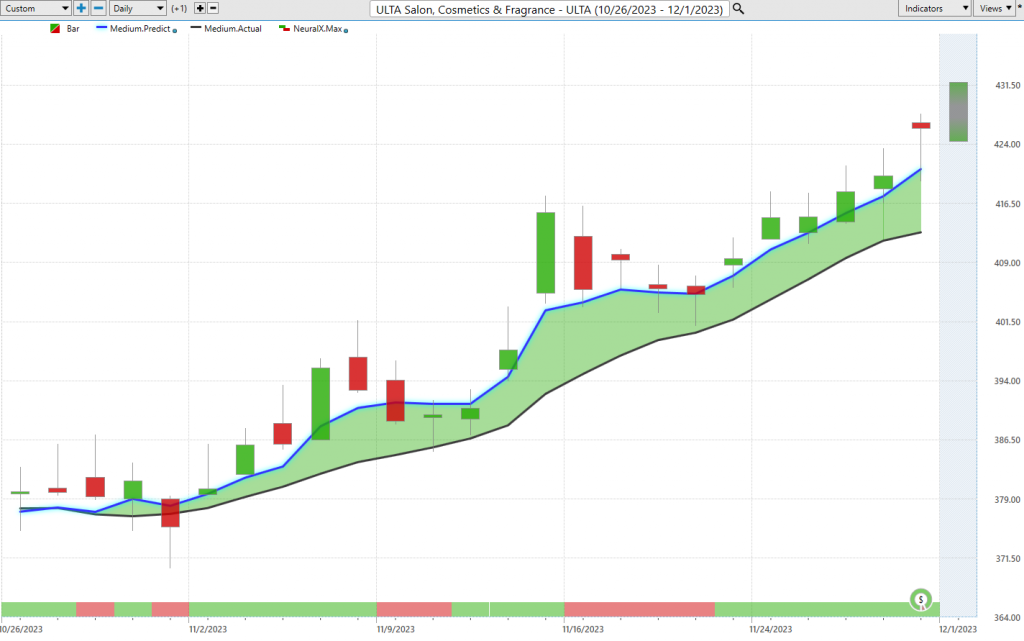
Here’s Ulta, it’s a really popular makeup stock. Here we have the blue line crossing above the black line, and you notice a little sideways action early. But while the market’s running sideways, what’s happening is that predicted moving average is actually separating from the actual moving average, and very clearly, this market is in an uptrend. So as long as that blue line remains above the black line, the trend is up. And again, we’ve got another 12 and a half percent rally over the past 25 trading days here. But of course, a shorter-term trader can come in and navigate this with the predicted highs and lows, and you see how effective all this is immediately. If you can buy that day, the next day you’re up, and the market isn’t looking back. Buy the market here, we get a little volatility around these trading days here, but again, half a dozen excellent entries as this market climbs higher. And then short-term traders, you know, we’re looking at the predicted lows, but you know, taking profit on the bullish side as a short-term trader, and you’re often going to get that opportunity to just buy back at lower prices and keep trading the market.
So really good opportunities here, really regardless of your style, to come in and say, okay, what do I like to do? What time frames do I like to work in? And how’s the best way for me to exploit many of these opportunities throughout the equity markets? And so it’s the same thing if you’re trading the S&P 500 futures, the SPY, you’ve got those predicted high and low levels like we looked at last week, which have done an excellent job of just helping you pull money out of the market as things run sideways.
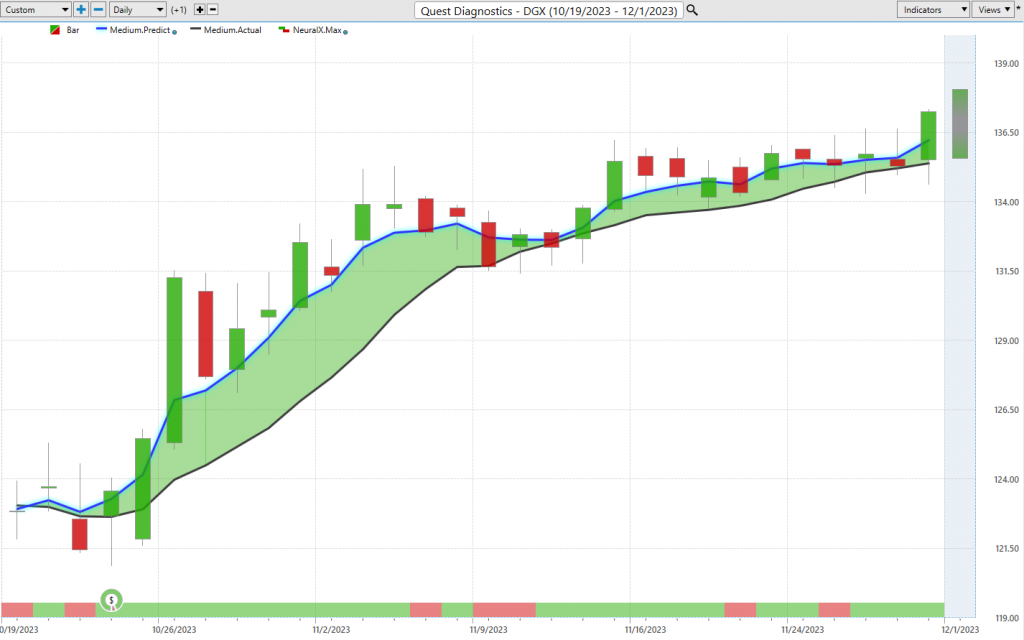
Here’s Quest, and I’ve brought this through probably every week for the past two months here because we’ve seen a strong forecast here, right? The blue line well above the black line. And so while things have run sideways and you haven’t got maybe as big a move as some of the other markets, that doesn’t matter because as a trader, if you come in and you’ve got levels like predicted highs and lows, you can just take these pieces day after day out of the market, make money as the market even runs sideways. And we’re starting to see things perk up. It does look like we may see a nice move in the equity space after things have just gone completely flat, low volatility, well, low volatility leads to high volatility. And certainly, the current trajectory here is up. So again, Quest Diagnostics maybe breaking out a little bit higher here soon, but 11% rally in these past 27 trading days and about a dozen opportunities to buy at very advantageous levels.
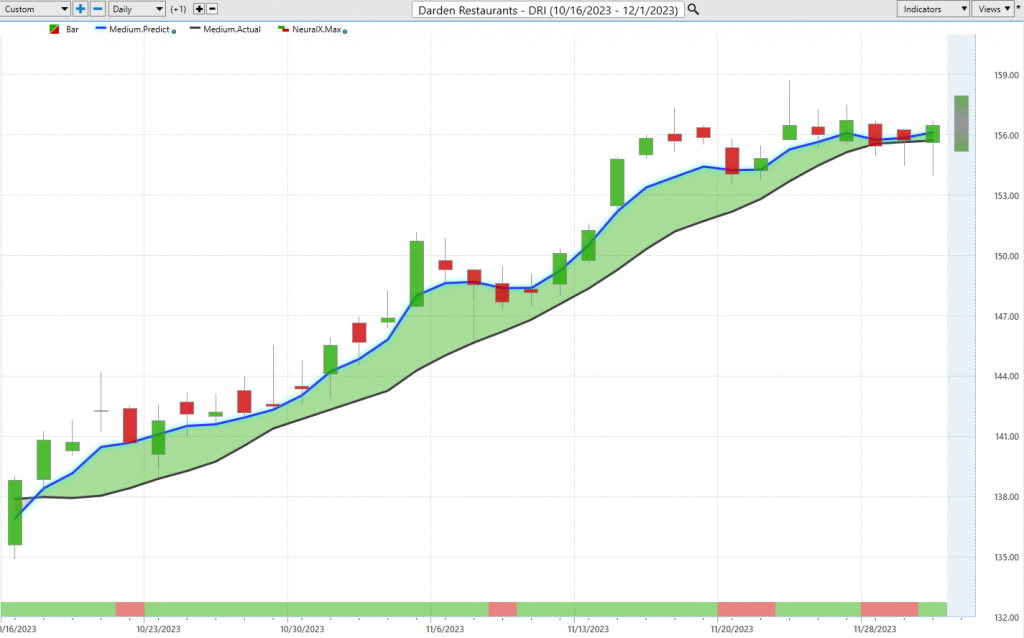
Here’s Darden Restaurant, similar example, and this kind of speaks to how much correlation there is in the market, right? You have to see these markets turning higher and get involved in them, where you’re not going to be around for this 12%. Because they all move at the same time. And so what you can do is use these tools to identify, hey, where’s the strongest opportunity? Then you’ve got really the roadmap to navigate that opportunity day-to-day, right? So if you want to add to your position, maybe get out of the position and try to buy back in at lower levels, well, this is where Vantage Point is going to be very excellent at helping you do that and navigate that and understanding how to deal with that volatility.
So again, multiple entries, market trending higher, again, really just nice stuff throughout the equity space, and Vantage Point doing its job every single day.
Now, I wanted to bring this in because if you’ve been paying attention to the equity markets, this is interesting, right? So markets are strong, right? But if you’re a short-term trader, we’ve got McDonald’s, Apple, you know, so many different opportunities where you can go ahead, get on the bullish side.
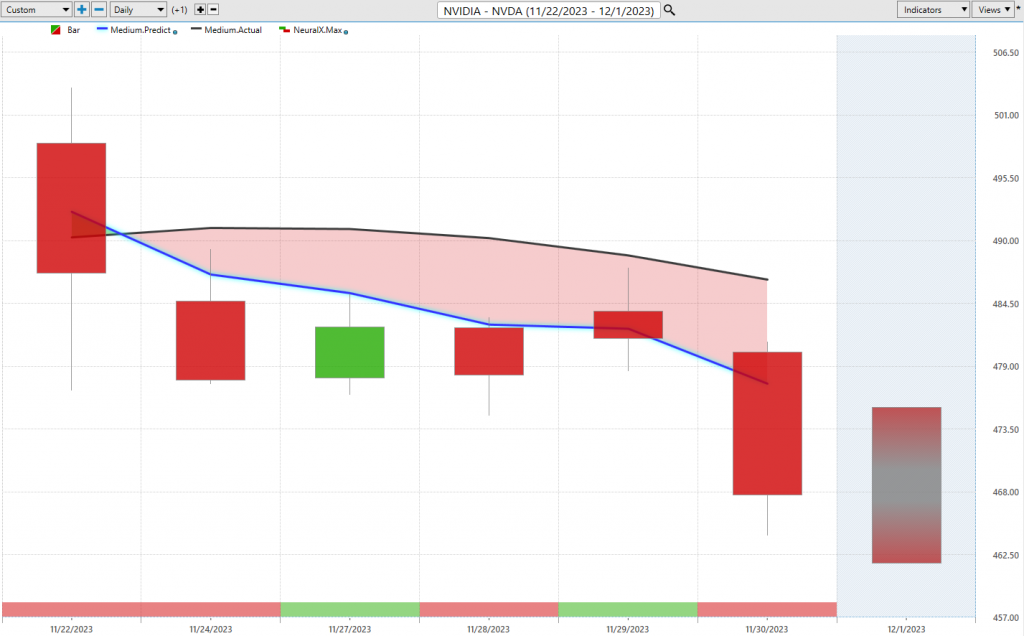
Well, here’s the recent forecast for NVIDIA, and what’s been happening this week? Well, got this crossover to the downside over a week ago, and so you’ve gotten this sideways period. But where have those predicted highs and lows navigated things? Well, it’s essentially screaming at you right there. That’s where you want to short. And sure enough, yesterday, we got about a 2-3% drop in NVIDIA. And that’s the move there, right? So this week, do you want to be loading up on NVIDIA? Well, we can wait till those predictive forecasts get bullish and really fine-tune our entries to make the most of that opportunity. But currently, the trend is down. So it made a lot more sense, you know, maybe, you know, be on the bullish side of Microsoft, but NVIDIA is the question mark here and may see some weakness here.
Royal Caribbean Cruise Lines ($RCL),
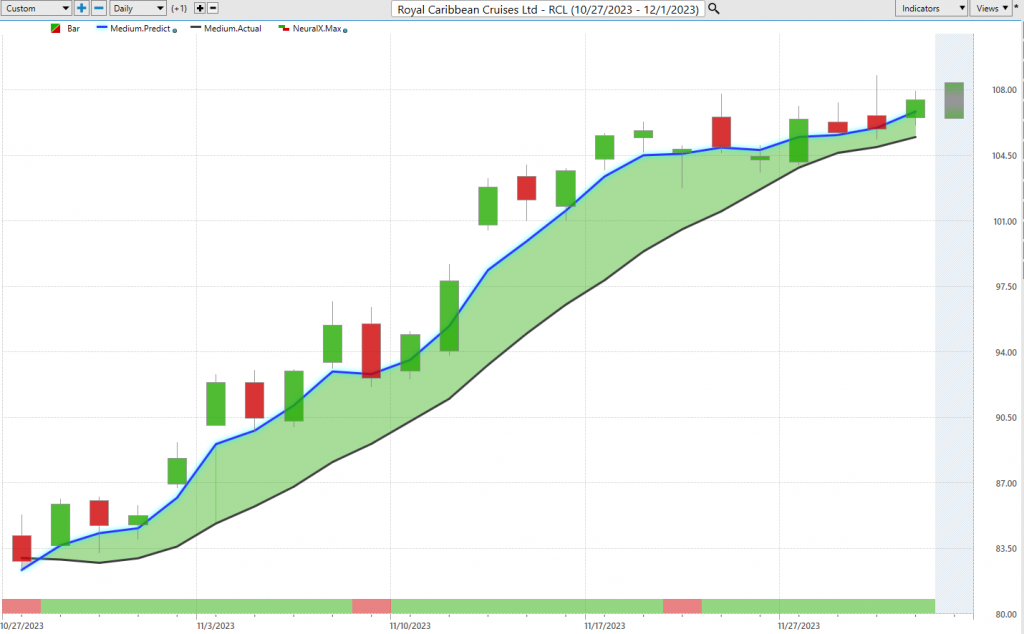
Lastly, here’s Royal Caribbean, so just ending on a positive note. This was a very weak stock in the summer, right? We went over some forecast of this market was trending lower and lower each and every trading day. But here we see that crossover to the bullish side and saying look, the trend is now up. It only wants to buy, take profits on long positions, and look at that entry the very next trading day, saying look, there’s where it’s screaming at you, you want to get involved in this uptrend. There’s the price level after all this volatility, things shaking around. The software is very adaptive, and this is why it’s actually so great is that it’s able to adapt to changing market conditions. So even when that volatility kicks up, those neural networks do their job, look at those competing market relationships, and then forecast short-term price moving forward.
And so that’s where you even on this fall, saying hey look, don’t chase, look to get these better levels and participate as the market, you know, eventually trends higher. And we’ll see what we get out of the broader equity space, but it does look like things are getting a little primed to maybe continue this move and bounce a little bit higher after a couple weeks of sideways and a little down here. So 25% rally over the past 23 trading days, again, just you know, 500 shares there, is about an $11,000 move.
So see a lot of these opportunities very similar, but that’s what you have to identify and navigate with the help of Vantage Point, of course, make the most out of it as we get day after day after day, multiple opportunities to get involved, make more money, and establish those positions that are going to work for you as volatility comes back into the marketplace and things start moving around.
So once again, this has been our Hot Stocks Outlook for December 1st, 2023. Thank you all for watching, best of luck out there, and bye for now.