


The Hot Stocks Outlook uses VantagePoint’s market forecasts that are up to 87.4% accurate, demonstrating how traders can improve their timing and direction. In this week’s video, VantagePoint Software reviews forecasts for U.S. Steel ($X), Sherwin Williams ($SHW), Bank of New York ($BK), Hanes Brands ($HBI) and Brown Forman ($BF/B)
Register for a Free Live Training
Hello again traders and welcome back to the Hot Stocks Outlook for August 13th, 2021. Hope you’re all having a great week out there in the financial markets, and as always, plenty to cover here in today’s Outlook. So we have a really good examples of people who try to wrap their head around how these tools work. So we start out here with US Steel, get a very straightforward example of all the different predictive indicators that we have here. We’ll move over to Sherwin-Williams, great example of the very short-term forecasting, predicted highs and lows that get generated via this technology. We’ll move on to Bank of New York, we’ve got Hanesbrands, and lastly, Brown–Forman.
So we’ve talked really over the past over a month here about the weakness in energy stocks, the weakness in beverage manufacturers. And I really encourage traders to go back and watch, going back to July 9th, so a month, and watch those videos moving forward, as we address some of these big sectors of the market as they’re showing strength and weakness, and we’re able to take that into account and then use these short-term forecasts.
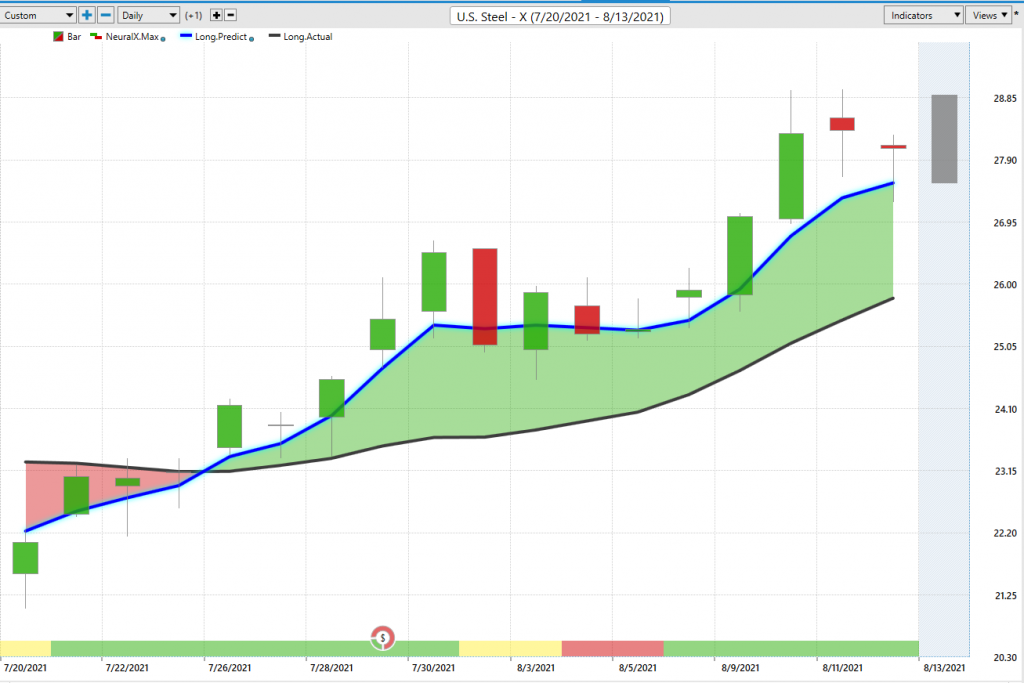
But here in US Steel, again, a really great example of how these tools work. So what you have here is daily price action, right? Each one of those candles represents a complete trading day, and whether you’re trading Bitcoin, commodity, futures, the Vantage Point forecast work the same, it all works off end of day data. And right up against that price data, you’ll see that there is a black line and a blue line. Now, that black line that you’re seeing there, that is a simple moving average, or what we refer to as the actual simple moving average. And that’s a very common technical indicator in that it just looks back at the previous, in this case, 10 closes, adds them all together, divides by 10. And what does that give you? Well, it gives you a good rolling measure of where market prices have been, it smooths out the data so we can get more of a view of where have things been.
But traders need to understand where are things going ahead of time so we can be ahead of the move, and that’s where our predicted moving average and these values that are generated via this technology come in. So for Vantage Point to generate this predicted moving average, you see this blue line against the chart, Vantage Point is performing what’s called intermarket analysis, and specifically utilizing the technology of artificial neural networks to do that.
Now, when you understand those two things, intermarket analysis and neural network technology, you understand why this is a very useful technology to use for this because, as we’ve seen with energy prices, as we’ve seen with the gold market, going back to March, we have these examples where, well, what drives US Steel? Well, it’s going to be other individual stocks, it’s going to be global commodities, and metal markets, it’s going to be the dollar index, it’s going to be global interest rates. And that’s what Vantage Point is able to do, it’s understanding how up to 35 other markets are known to drive and influence the target market that you’re trading. And what it’s able to do is understand how those intermarket relationships affect future price.
And so what happens is Vantage Point’s taking that data, generating a true price prediction of where things are headed, and it takes that data and uses it to construct the value of these indicators. So rather than having indicators that just look at the past and really get dragged around by whatever volatility and things are coming through the market, this is actually looking ahead and waited to let you know where are average price is going with the help of this predicted moving average. So whenever we see that blue line, or that predicted average cross above the black line, suggesting average price are going to start moving higher, trading strategy that would get you long in the market would be most appropriate.
Now, Vantage Point just doesn’t stop there though, it’s not just about generating this accurate predicted moving average, but the technology is also applied to different timeframes and different indicators. So if you look at the very bottom of the chart here, you see we have this bar, and it goes from green to red, and this also gets updated each and every trading day. But what it’s doing is it’s taking those neural networks and they’re really trained to look ahead just 48 hours ahead and forecast for short-term strength or weakness just over the next 48 hours, and actually a timeframe as far as the length of prediction there.
And so that as a trend is developing and continuing can help you be ahead and aware of short-term strength or weakness. Now you see here as the neural index goes bearish here, that’s only a 48 hour indicator. Now you also have the tools of the predicted high and predicted low. So even a intraday levels provided for you each and every trading day before the trading day occurs, and this is what can really help you with the short term forecasting and understanding that, yeah, I want to be long. Okay, we may get some weakness over the next 48 hours because of the neural index, but I actually have a guide of a prediction of the high and the low for each and every trading day to guide me through this period.
So if I want to be a buyer, well, I can look towards the predicted lows. If I want to sell and take some profit on some of my position, I can look towards the intraday predicted highs, but we can see how this all plays out over the course of what’s only been a couple of weeks, but that’s the whole thing is understanding when to hold your position and how to manage it moving forward.
So when you recognize that, “Hey, here’s a potential trend reversal. I want to buy US Steel.” Well, where should you buy? And this is very important to understand. You see days like this where you get a little bit of volatility and you come outside of the range a little bit, but where are you closing? Same thing here, you come all the way lower, and you’re coming back in the range and closing above it because we’re in an uptrend.
You see you get the volatility around here, but then very quickly these levels because what these levels are able to do is they’re constantly looking ahead, they’re constantly looking at those intermarket relationships. And so even when some volatility comes into the market, the software does a very good job of taking in those intermarket relationships, and then readjusting so that you can start doing some effective trade management as that market progresses and moves forward.
But what hasn’t happened is the blue line hasn’t crossed below the black line at all here, and it really hasn’t gotten close. And so it’s very clear, it says, look, all you’d be doing is going long, taking profits on longs that can manifest a lot of different ways as far as strategy, whether you’re a day trader, a swing trader, or maybe you trade options, and want to start buying calls or something there. But you see you got a 20% move over the past 13 trading days, a little bit of sideways action forecasted through here, but overall you see how accurate this indicator at the bottom is, it’s about overall 80% accurate over a wide swath of markets and very long periods of time. So it’s really going to help you in the short term, and then you can come in with even those longer term strategies, and some really great trade management.
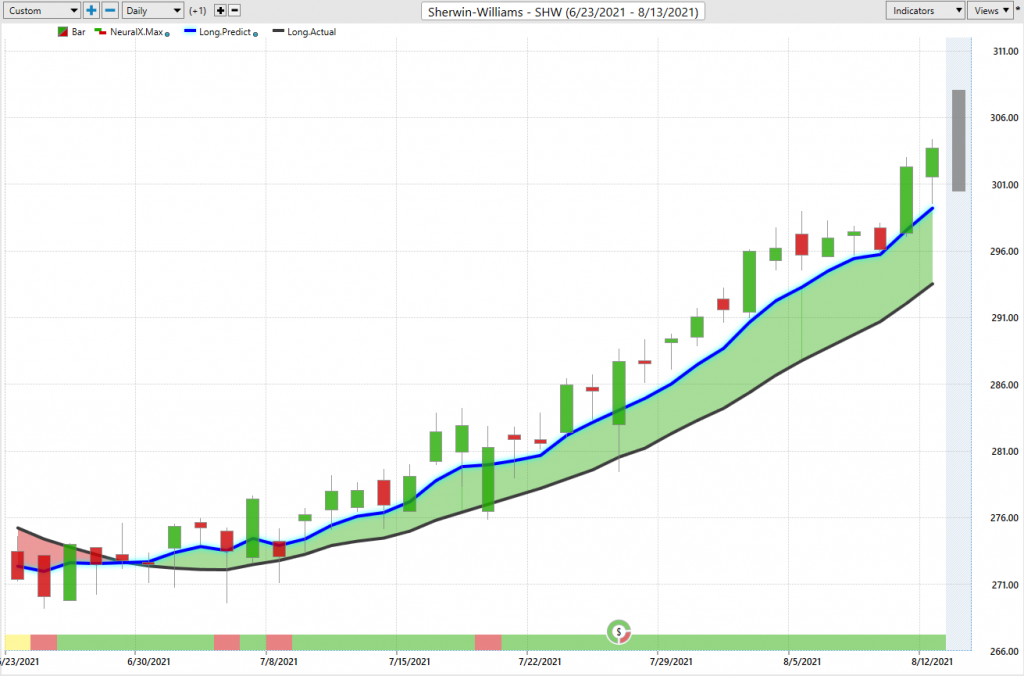
Now this opportunity in Sherwin-Williams is a little bit different, but I’m bringing it in just to highlight how over huge spans of time, I mean this opportunity, it goes back all the way to before July so we’re about a month and a half into this situation as far as calendar time, and you’ve seen a market that has trended higher, the blue line’s still very much above the black line and you’d only want to be long and taking profits on longs. And what we can do is look at those predicted highs and lows. And you’ll see that when you have a tool like this and a game plan, and at least just a strategy that’s going to deal with volatility and limit your risk, it’s not too hard to figure out, “Well, what should I be doing here? If I’m going to be a buyer, where should I be a buyer?”
And even days like this are really interesting where you see that you get a little bit of volatility here and some gaps and things going on, but you see that you gapped down. If you’re a day trader and you have an order waiting, you’ll just get filled at the open and trade straight up. If you’re real short-term, and I really don’t recommend this because there are going to be these days where you come out of the range, but you see how you come right back in. And oftentimes, as a day trader, you need to understand that there’s these days where you’re going to close down at the low. You see here on this red candle recently you closed down at the low, but that’s where you want to get long is down at that low because the next day you know that trend is advancing and things are continuing.
So a really nice opportunity here. If we go ahead and count, you got one, two, three, four, five, six, seven, eight, nine, 10 entries here over the course of a month and a half. And what I also really think is interesting about some of these opportunities, and Sherwin-Williams, not the most exciting stock, but when you’ve got 10 entries over a couple of months and the market’s moving up 11% over that period, there’s some good money to be made over a period of time like that.
And so even these markets, when you have some accurate forecasting, even when things run sideways, you have the opportunity to pull some money out of these things, take profit at the appropriate levels and express whatever your strategy is, how you approach the markets. Here we have Bank of New York, and clearly here crossover to the upside, neural index bullish, you see that here the neural index gets bearish here, you have a gap down and sort of some weird price… A couple of gap downs there over the next 48 hours. But over the next 48 hours [inaudible 00:08:11] actually blue line separates more from the black line trend, still up, have another sort of spotty day here, not a whole lot happens, but very clearly trend up. We can look at the predicted highs and lows of where’s that guidance coming in?
I mean, what’s interesting about gap downs and getting so close to these sort of levels here, as far as the predicted low is, there’s such low volume, right at the open in those situations. So it’s actually figuring out really helpfully, I mean, you’re getting in right at the open on those gap downs when not much is going on, but very few people are going to be getting filled like that at the open of the market, right as it opens, and those opening prices that you’re getting filled at don’t last for more than a couple seconds likely before the market starts to move higher.
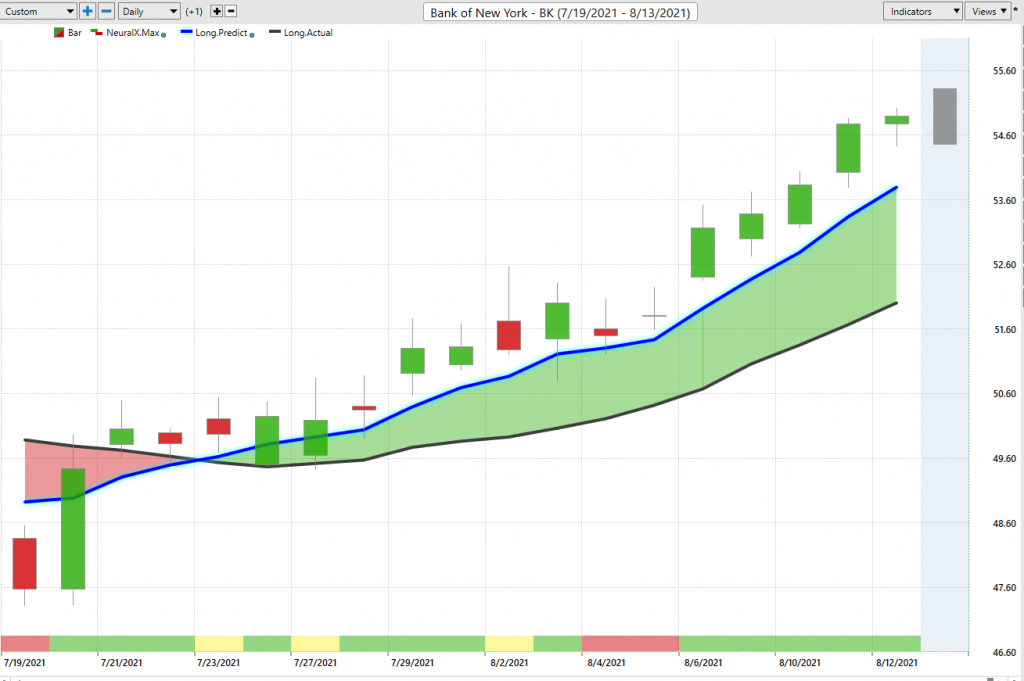
Here you see a little bit different. You open, you close lower, by the end of the day, you’re up at the predicted high and potential for a nice a day trade of the range there. But it’s the same thing, whether you’re trading Bank of New York, or you’re trading Bitcoin, or Sherwin-Williams, or commodity futures, or Forex bearers, you want to identify these areas where there’s strength in the market, where you can take these long positions, and where the short term forecasting is going to help you get the better part of the market. Take advantage of the current situation.
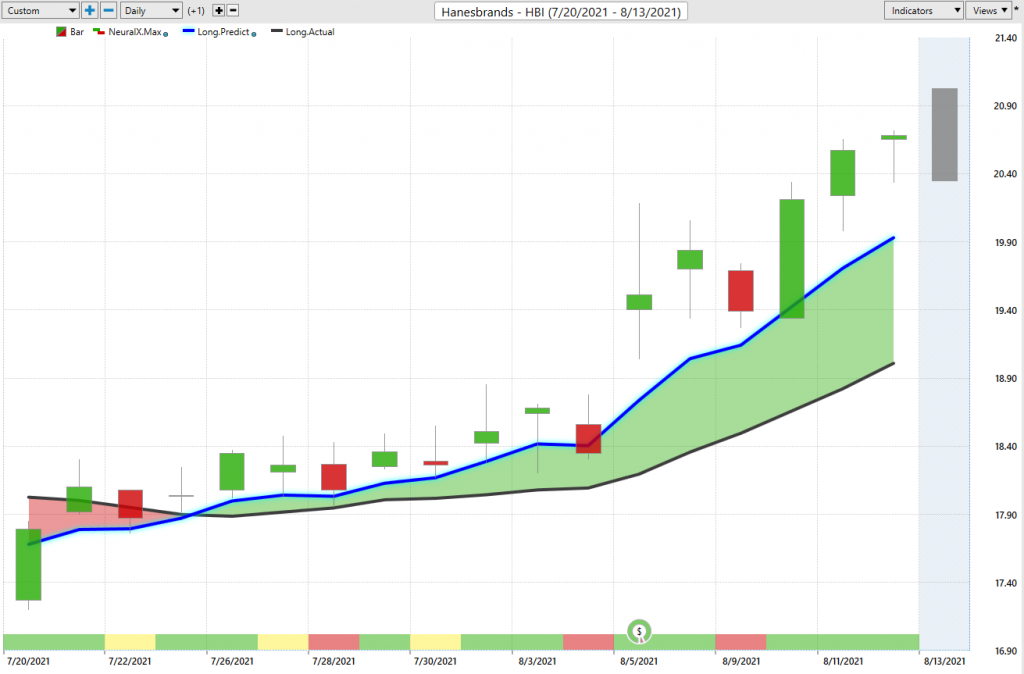
Here in Hanesbrand, pretty similar. It’s just showing some recent opportunities where we’re getting these crossovers, and predicted highs and lows here. So you see that if you’re going to be a buyer, where is this software screaming at you that where would you want to buy? Well down at the lower part of the range, intraday at these levels, and that gets you about four opportunities to get long before this thing really starts to take off and go. And that’s really the benefit and the whole point behind Vantage Point’s predicted tools, is to help us get in ahead of the move so that we’re in before the market starts popping off and volatility starts picking up. But again, really nice opportunity here as things really pick up, at least in shares of Hanesbrands.
Nd again, I just want to remind traders to go back and watch the videos over the past month here because what we’re able to do is actually use the features found within this Intelliscan. So what we can do, I’ll try not to make a mess here, but you can open up the Intelliscan and populate it with whatever your selection of markets is. And this allows us to sort via these predictive indicators. So if you’re looking for a fresh trend reversal, you can use the predicted moving average crossovers, find those opportunities, and then use things like the neural index predicted highs and lows to help guide and manage those trading opportunities.
And what that’s done is help us be really aware of when these sort of opportunities like we saw a lot of these beverage companies get very weak, you could see the whole market turn lower, and especially the energy situation is a big situation. So we go back all the way a month ago, and I’m warning everyone that we’ve got energy stocks and downtrends really getting a lot of signals that energies are weak, and it’s been a catastrophe since then. I mean, if you’re trying to come in and trade that, you’d want to be on the short side, or you’re probably having a real tough time of it.
But anyway, but here’s Brown-Forman, and we talked about just a lot of these alcoholic beverage manufacturers, and it’s very clear that you only want to be shorting the market and taking profits on those short positions. And again, you get these spikes in volatility, but you see how much the market just closes right in the middle of the range, continues on, and if you have a strategy that’s going to, again, deal with volatility and limit your risk, short this market, take profits on shorts, it’s going to have numerous entries at a pretty good, again, part of the range here. If you’re shorting and taking some shorts on these advances and these advances, well, it’s really going to pay off as a trend trader there.
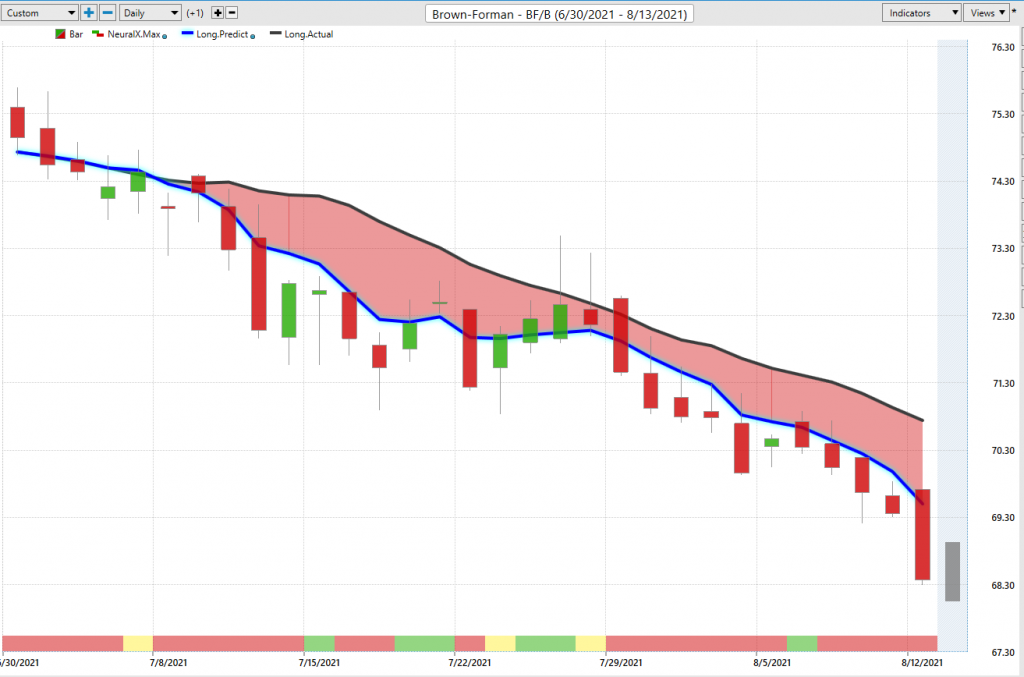
So again, we can look at the overall opportunity. Thing’s still really in a downtrend. And this period over the past couple of months has really highlighted this great opportunity to have a hedge portfolio where you have these long positions that are doing extremely well, but there’s clearly some areas in the market where you should hedge the portfolio, get some short positions on. If things continue higher, great, we’re going to advance up. But if we start seeing volatility, you’re going to want those things that have gotten short positions and are in profit, and you can manage those if the market’s going to continue lower.
So we’ll just have to walk this forward. It’s been a really exciting period over the past couple of months here, and things just keep continuing on in line with those expectations. And when Vantage Point shows us, “Hey, there’s a big shift that’s changed.” Well, we make the adjustments and then find those opportunities that are going to propel the equity and have our account move higher. So I’ll leave it there for this week. But once again, this has been our Hot Stocks Outlook for August 13th, 2021. Thank you all for watching, best of luck, and bye for now.


