Welcome to the Artificial Intelligence Outlook for Forex trading.
VIDEO TRANSCRIPT
U.S. Dollar Index ($DXY)
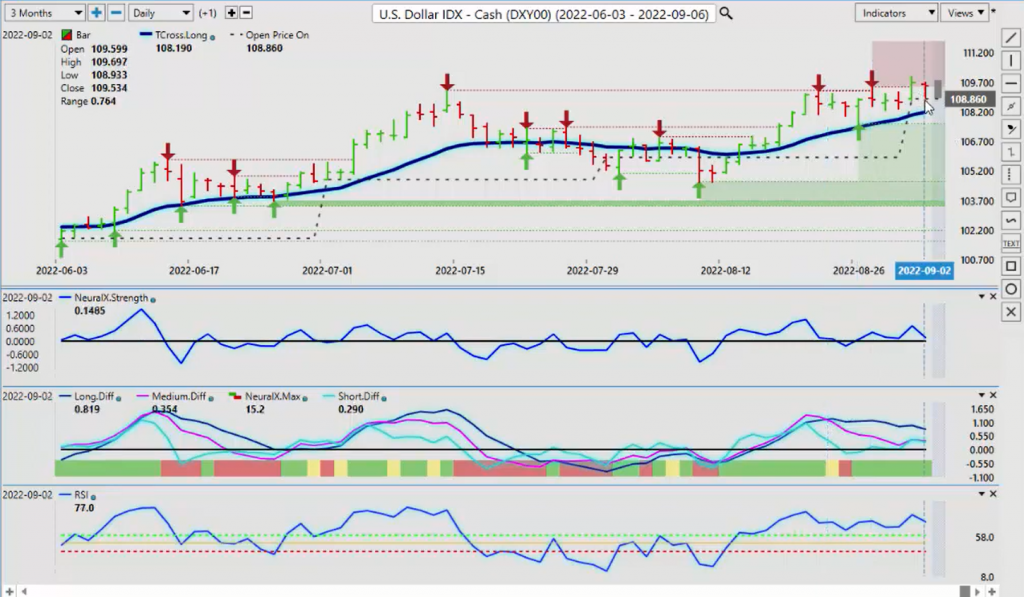
Hello everyone and welcome back. My name is Greg Ferman, and this is the VantagePoint AI Market Outlook for the week of September the 5th, 2022. Now, to get started this week, we will begin where we always do with the very important US dollar index. More of a brief presentation this week. We’re in holiday thin, coming out of summer trade. A hundred holiday thin markets. So we should expect some volatility in this coming week. We’ve got the ECB decision. I believe the ISM number out of the US, but nothing huge. But I think that the dollar right now is going to stall out potentially a little bit here. We’re still struggling with this 109.29 level. Unable to break through it. We’ve had a slightly higher verified zone at 109.47, but as you can see, not a lot of buyers up here at the current time. We’ve got our ME diff crossing to the downside, but we are holding above the monthly opening price and our key T cross long 108.19.
I could anticipate some minor pullback to this particular level. Now, again, this has nothing to do with Fibonacci, Gantt theories or anything like that. There’s simply a predicted moving average, the monthly opening price, and a normal retracement, or lack of buyers is what we’re going to see up here. So once again, when we look at this level up here, we don’t want to get our trading too complicated here. We’ve got the verified zones and the theory is the dollar is still along while above the T cross long, but it’s lacking momentum at the current time. That’s perfectly normal at this time of year, but the seasonality component of this is that the dollar usually does well. Basically, I would argue, late August through to about late October, mid-November, the dollar still goes up and down, but it is a stronger buying month. So we would look for a retracement back down to this 108.19 level to see if that holds.
And then we would look to branch out from there to look for at the different forex pairs and even additional potential shorts on equities, some of your different commodities.
Gold
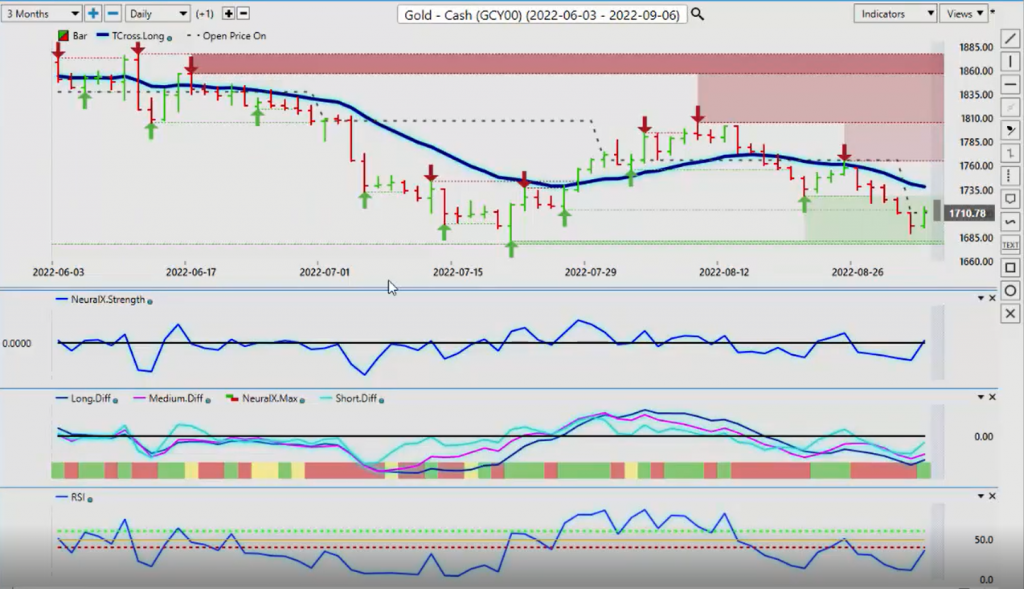
So when we look at the main commodity that inversely correlates to gold, we can see that gold’s still under pressure, but it appears to be, we have some buyers coming in. We have a very strong verified support low at 1681. But again, September, from a seasonal standpoint, is not a great month for gold here. It’s still longs favor the dollar versus gold but a retracement is perfectly normal. We would look for a retracement to the 1738.20 level, and then assess at that point. The indicators here are pointing that this is a corrective move higher, not a new trend until we close above the T cross long and stay above that for a minimum of two days in a row.
But again, we would still have to deal with that verified high of 1764.
Crude Oil
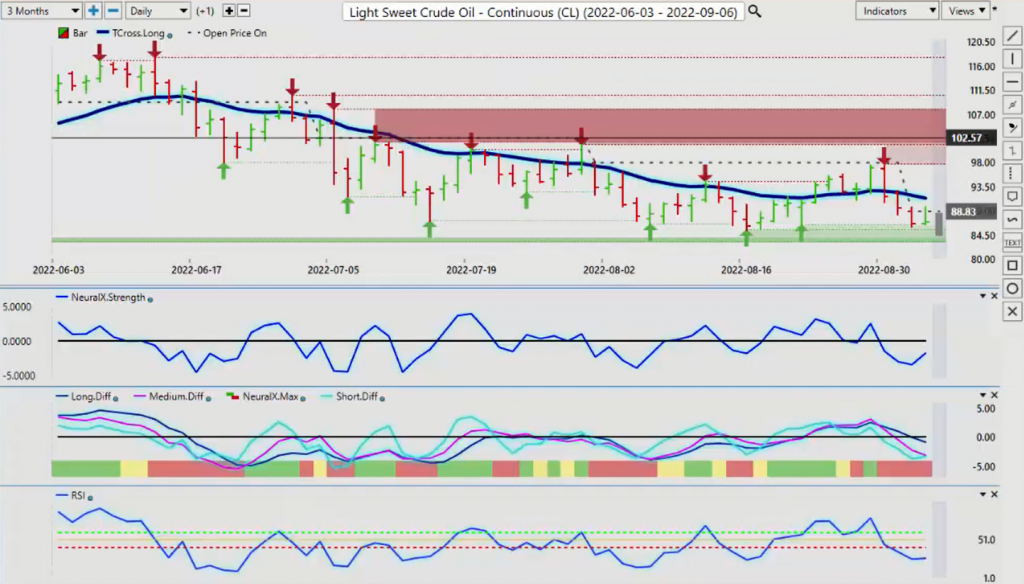
Now, when we look at light sweet crude oil going into next week, once again, oil is struggling. We’ve had a bit of a rebound here, but then down again. So when we look at what’s happening with Europe, in my opinion, making the mistake of shutting down those nuclear plants and coal plants. My understanding is they’re reopening some of them now because they have to for energy purposes. So when we look at that right now, oil is still likely to remain firm, but I would keep a very close eye down on the verified zone lows at 85.37. The indicators are predominantly still bearish for the time being. But when I look at this, what I find unusual here, I did have a request if I could look at natural gas.
We can see here that on Friday that natural gas is getting into a lot of resistance up here. We have closed below the T cross long at 8.91, the question is, can we stay below that? The indicators here are suggesting that natural gas is going to move lower, but we need to stay below or continue to close below 8.91 in order to validate that. Now, there does appear to be some momentum building, but once again, I don’t anticipate that natural gas is going to move a lot to the downside. This still looks to be, in my opinion, corrective in nature, but we’ll assess it each week. Because again, this is a weekly outlook, not a daily outlook.
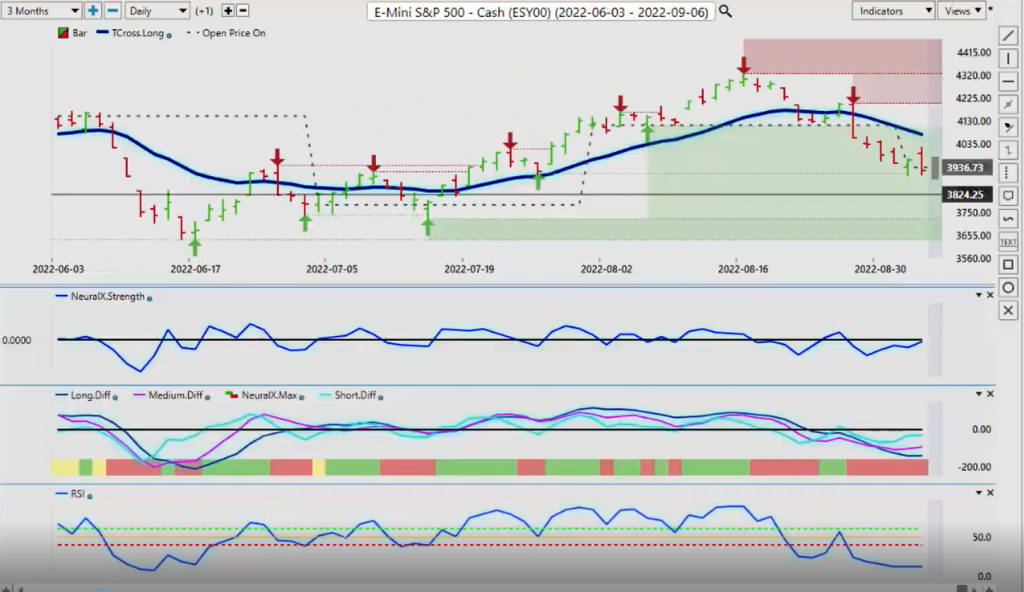
S&P 500 Index
Now, when I look at the S&P 500 for next week, once again, a pretty strong setup here. We close under that T cross long.
We were traced back to it. There’s our two day rule. Tries to fake us out here and go higher and then down we go. So right now, when we look at the S&P 500, there is some minor bias for a continued corrective move higher, but that T cross long now is at 4072. Again, unless we can close above this level and stay above that, then the primary bias remains lower. The other seasonal pattern here is that, in most years, when you’re in an election year, predominantly, stocks don’t do well until you get close to that election period, which would be the US primaries. So once again, I believe that the closer we get to the November, that could be beneficial to the S&P. But right now, we want to continue to focus on 4072 and the primary indicators. This is telling me that we could be retracing higher, but a new trend has not been confirmed. Now Bitcoin, again, only in my respectful opinion, the Bitcoin is, I would consider it to be, bordering on a leading indicator for the NASDAQ, the S&P 500.
Bitcoin
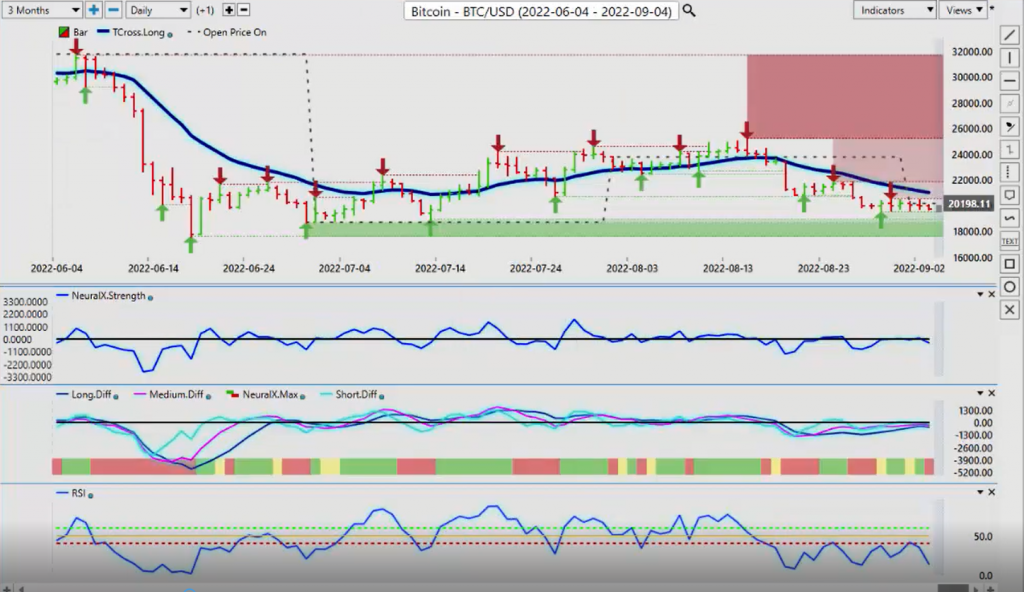
So as long as Bitcoin remains holding below that 19,005 mark, but we do have additional support, I believe yes. Down to 176. So as long as we stay above this, then I don’t think the equities are a wash and I don’t think Bitcoin’s a wash. I think it’s a buying opportunity. The known seasonality for Bitcoin is the latter part of September. Strong buying comes into this over. That’s what we see from a seasonal standpoint. So this year, well, maybe a little bit different. We’ll assess that when the time comes, but for now, we don’t have a lot of buyers, but we don’t have any sellers either here, guys. So continue to watch that 19,500 mark, but the indicators are still predominantly bearish.
Euro versus U.S. Dollar
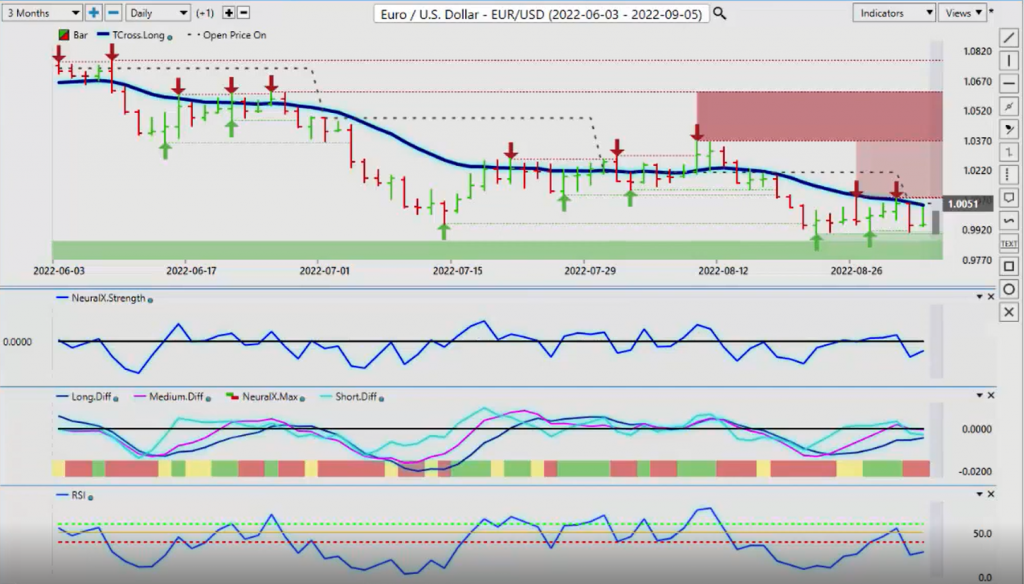
Now, as we go into some of our main forex pairs, again, a busy week. I think it’s going to be for the Euro.
And I believe that this is why the dollar will soften a little bit pre-ECB because you’ll have that speculation that they’re going to hike, or they’re going to be more aggressive in their position on the rate hike. So we’ll see where that goes but right now, this previous week, you can see. Using the T cross long, again, this is a second week in a row. I’ve just used the T cross long because it’s that time of year, guys, where there’s going to be a trending market, and we just want to try and make sure we’re on the right side of it when that actually happens. So where we’re tracing back up to the T cross long, we stop dead on that and it falls. So we use that as a pivot point in our trading. The T cross long, just above parity, 1.0044.
I could easily see that being challenged going in pre-Thursday trade. Again, we’re still in a holiday short week next week with the Labor Day on Monday, plus you have people, the big banks, they’ll take an extra three or four days. They’ll come back a week Monday, and they’ll just let this week play out. So choppy week is likely ahead, but I could see the Euro making some ground. There’s a high correlation between the Euro and gold. So if gold starts rising, we should see the Euro rise also but again, I think that’s only temporary in the month of September. And then ultimately, that seasonal play, not to mention a hawkish fed, will continue to push the dollar higher at least temporarily for the month of September.
So keep an eye on this particular level. If we break and we close above that, that could open up the door for another retracement back up above parity, maybe towards the 102 level. But again, my optimism on that still remains heavily guarded.
U.S. Dollar versus Swiss Franc
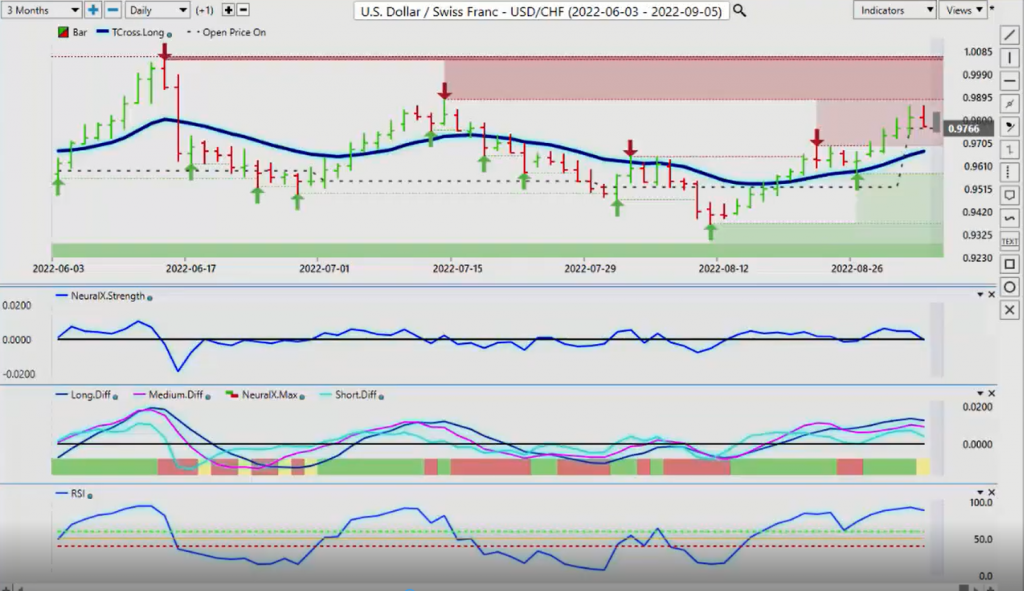
The US Swiss Franc next week, if the dollar continues to rally, then the Swiss Franc will also… But I would look for some kind of retracement here first. Now, I don’t think we’re going to retrace all the way down to 9671, but I think that we will retrace. We’ve got a bit of a gap here between the T cross long at 9671. The predicted low is 9751 so there are 54, excuse me. So there’s a significant gap that needs to be maybe filled a little bit before we get into another rally on this.
We also have a strong verified resistance high at 9886. So that is the immediate resistance you want to watch next week, I would be cautious buying around that area because again, this identifies a failure point in the market and indisputable failure point. So in order for the US Swiss Franc to rise, we need the dollar index also moving up.
British Pound versus U.S. Dollar
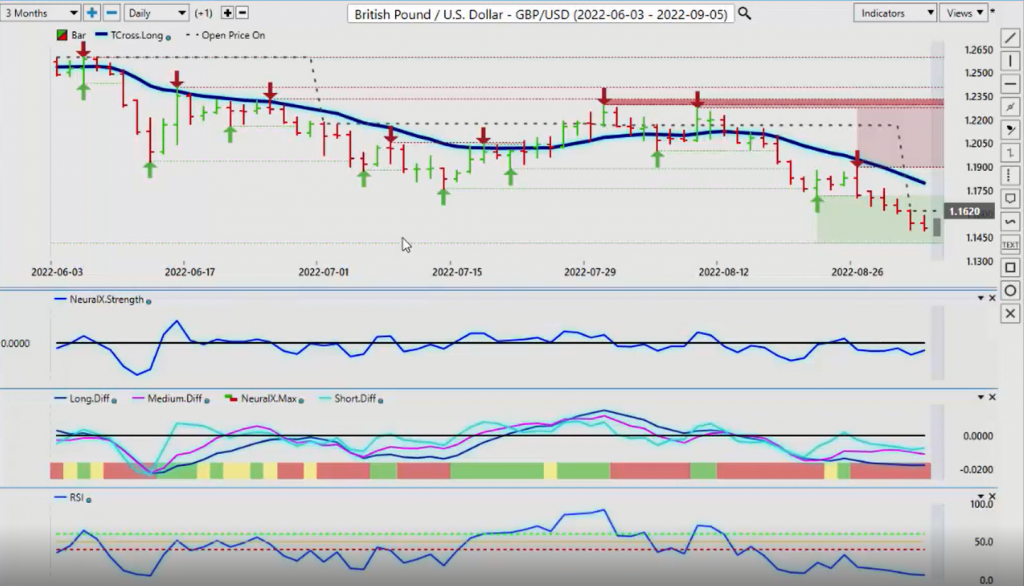
Now with the British pound going into the next week’s trading, looks like we’ve got stalling out a little bit here down around 11495. That’s a much bigger area of resistance than what you would think, and when we look at this over the last year, you can see from a year ago that the British pound stabilized in September, but it still didn’t do well.
So when we look at this right now, you can see that this other additional verified zone that’s running back here, we would have to go back several years to find that verified zone. I think it’s down around the 1.13 area. So yeah, there it is right there where actually even… No, let me just pull that up here so I can get the low point there. 1.1411. So I believe we’ll take another run at that area. And then we would be looking for a potential rebound here. So once again, the indicators are running pretty much flat on this thing as it continues to fall, but between 1.1411 and the other verified zone around 1.1480, these are the levels you want to keep your eye on because the indicators are again, starting to flatten out. They’re starting potentially to turn and we’ll see where we go from here. But there is that possibility that the pound will gain some strength in the month of September.
U.S. Dollar versus Japanese Yen
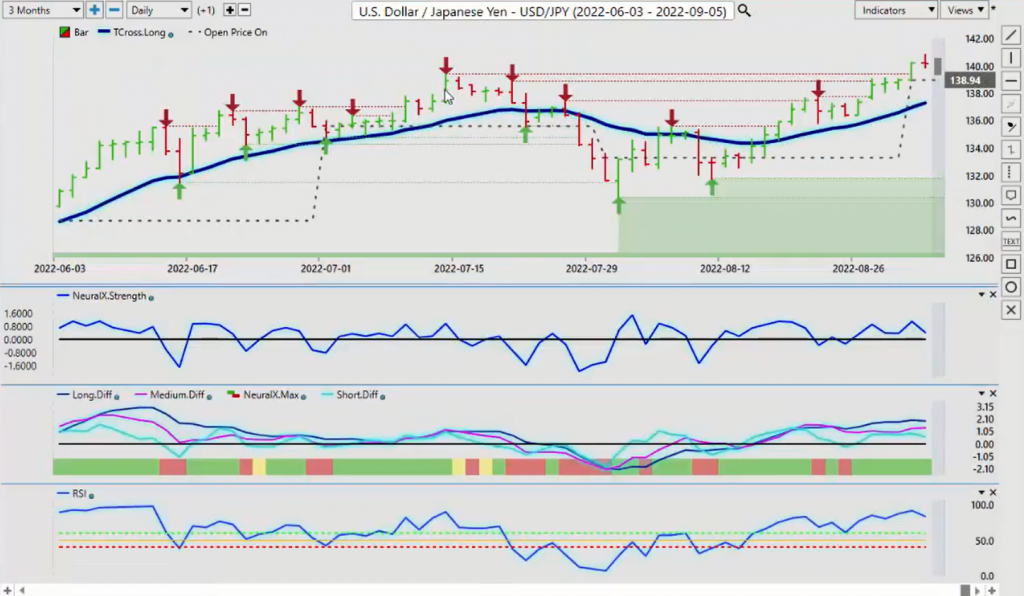
Now, when we look at the dollar yen, in my trading career, I have not seen the dollar yen at these kind of levels in… I can’t even remember. I think 135 is the most I’ve seen. We’ve come up in July, we’ve hit the 137 mark, and now we’re pushing above that also, but this pair is clearly overextended, but that doesn’t mean it’s going to go lower here. But I believe that there will take some sort of risk off catalyst to really send this thing lower. Plus, I would like to see gold going higher, which would favor the yen and at this time, that’s not happening. So again, we’ll continue to watch the monthly opening price at 138.94. Bring that into your trading here because ultimately, I think we’ve got a significant gap between where the market is right now, where we’ve closed at 140, the T cross long at 137.28 at the beginning of the month. That would tell me, we’re probably going to get into some type of retracement.
Then we can reassess that once we’ve had that retracement, but buying at these levels is very, very lofty levels. The indicators are basically, again, overextended. That doesn’t mean it can’t go higher, but again, I would be very, very cautious with longs up at these very, very lofty levels.
U.S. Dollar versus Canadian Dollar
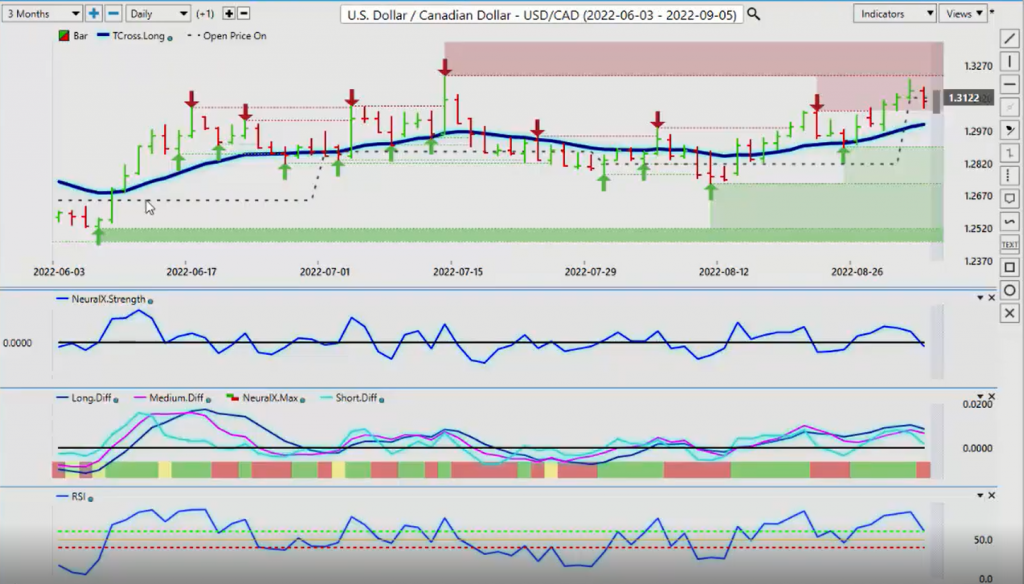
Now, with the US Canadian pair, once again, we approach that verified resistance high at 1.3223 on Thursday, and then you can see it just backed right away from it. So again, the verified resistance tools, zero lag, there is something that’s indisputable in the market. The market has failed on July the 14th at this particular level. It creates a zone up here and says, “Okay, this is a very significant resistance level and it needs to clear it, and maybe not a great idea.” A lot of retail traders will tend to follow the primary trend and they will buy high, and they will sell low.
That can be dangerous until… I believe we’re going to get a retracement here, probably down to the T cross long around 1.2998. We have The Bank Of Canada this week, guys. And the word on the street here that I hear from Canada is this is it. It’s going to be a big one and then they’re going to maybe pause. That’s, again, just the word on the street here. That’s the only thing I can tell you and it’s the words that I get are usually not far off. So this is what I’m hearing they’re going to do is really go for one more big rate hike, and then they’re going to say, “Okay, this is probably it for a while, and now we’re going to see what happens.” I can’t say for sure that, that’s what they’re going to do. But if that’s the case, the initial move will be down on the US Canadian pair.
Be very cautious with this on Wednesday at 10:00 AM when The Bank Of Canada makes that statement, because we’re all expecting a big hike here. But we’re also suspecting that this could be the end of it for several months or maybe till next year. We don’t know. So again, watch that level and I would expect, into that announcement on Wednesday, that this pair falls towards the 1.2998 level.
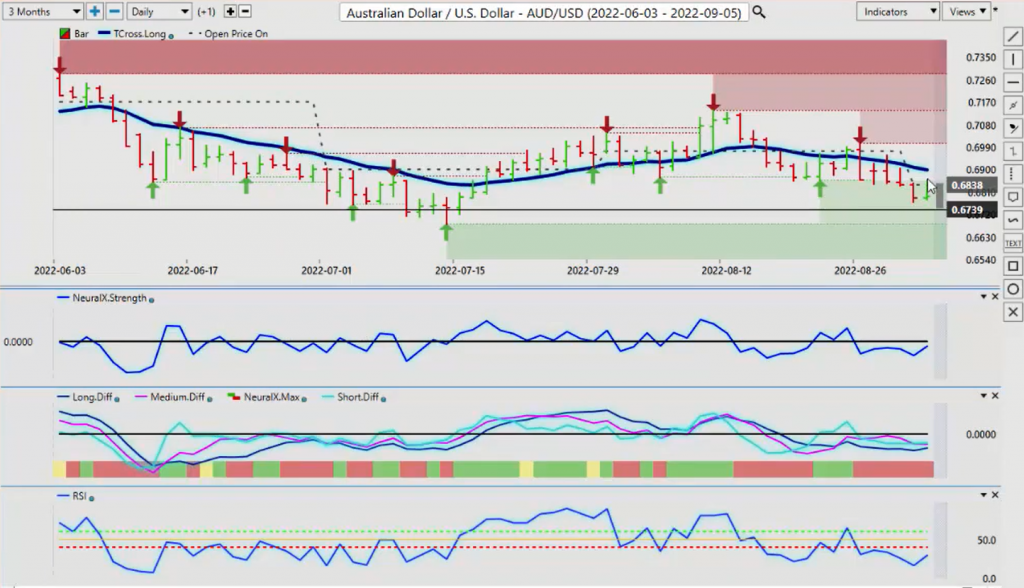
Australian Dollar versus U.S. Dollar
New Zealand Dollar versus U.S. Dollar
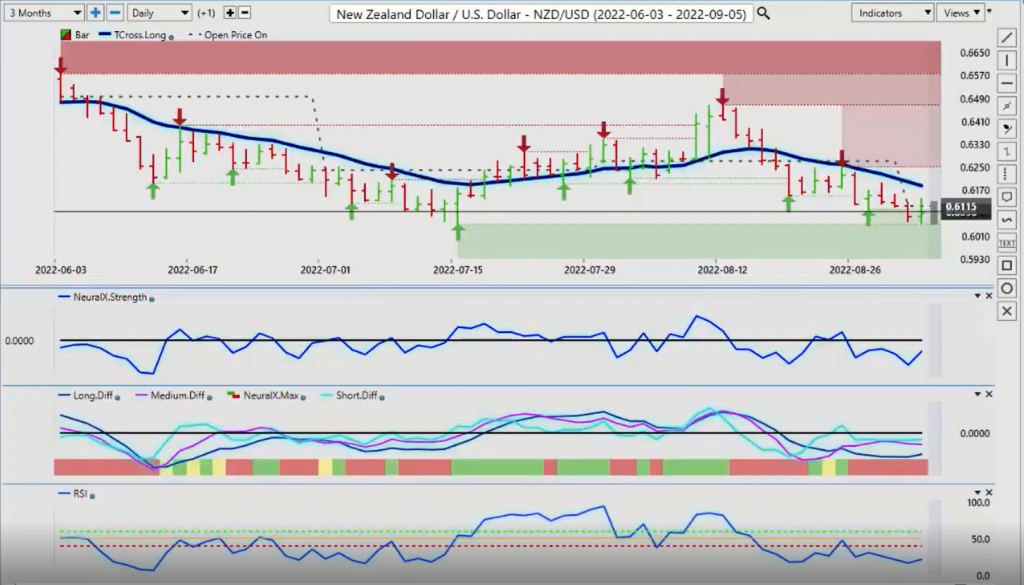
The same thing is applicable to New Zealand here, guys. But with this one, we’re sitting on a verified support low 6050. So at that 6050 level, we’ve already hit it twice in the last several days.
Then Friday, we took a pretty strong bounce off of that. So that tells me we are likely moving towards a retracement move to 6184. If we can clear that, close above it two days in a row, and we can clear this additional verified resistance high at 6251, then we have a shot of extending higher, but that is going to take an equity rally, guys. Even if the dollar is strong across the board, it could still lose a ground against the Aussie, the New Zealand and the CAD, if the dollar and the S&P 500 both start moving up together. So with that said, this is the VantagePoint AI Market Outlook for the week of September the 5th-