Welcome to the Artificial Intelligence Outlook for Forex trading.
VIDEO TRANSCRIPT
Hello, everyone and welcome back. My name is Greg Firman, and this is the VantagePoint AI Market Outlook for the week of November the 8th, 2021. Now, to get started this week, we’re going to begin with the very important US dollar index.
U.S. Dollar Index
Now, just a quick review of what we’ll be using in this week’s presentation, we’re going to be using the 44 week look back bars and our candles, our predicted short, medium, and long-term difference with, of course, our neural index, our point in time, which I’ll discuss in a moment, our predicted highs and predicted lows, our triple EMA cross that’s been modified where I’ve removed the T cross short and the T cross medium, and we are going to focus this week solely on the T cross long and, of course, the very popular verified support and resistance zones.
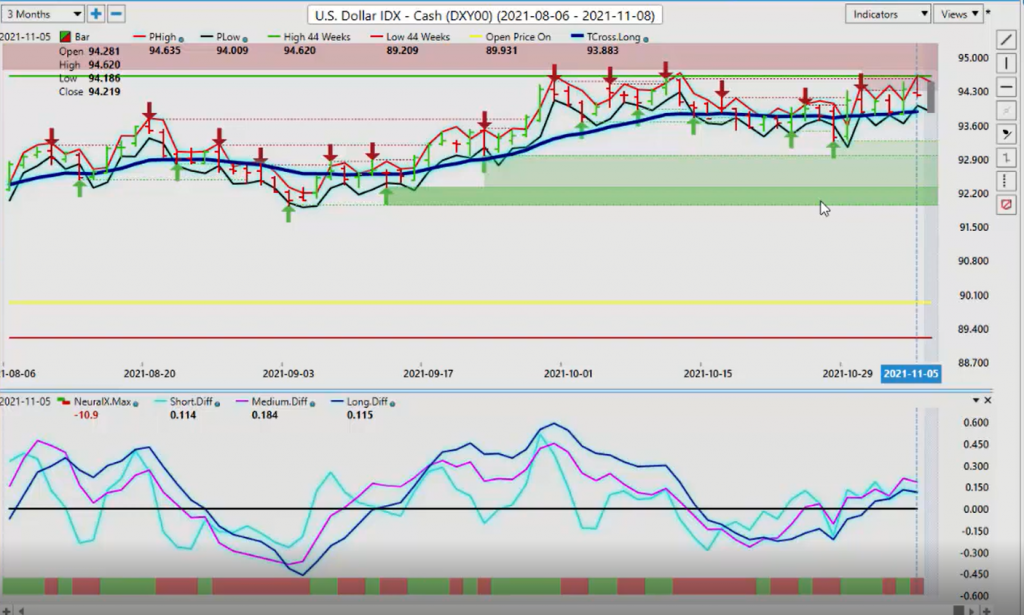
Now, we’re coming off a very volatile week, but the dollar did very, very well. Now, as we move into the fourth quarter, we want to make sure we’re doing complete and thorough analysis so we understand where we are in our trading. Now, our point in time is set at the yearly opening price. Looking at this and going back over a one year period, we can see a very clear structure of a very bullish US dollar in 2021. Now, we are getting very toppy up here.
What we need to do here in order for the dollar to advance is clear this very important resistance level that I’ve discussed repeatedly over the last probably several months now, and that’s coming in at or about the 94.75 level. Now, we’ve come up and tested this after the payroll number, but we need to break through, get out of this channel and start advancing. Now, the seasonality of the dollar is that it usually doesn’t do very well in the latter part of November and December. But with that very impressive payroll number on Friday, the dollar does stand a chance to break higher.
Now, looking at going into Monday’s trading, our predicted low on the VP software is, as you can see, the predicted low is coming in at approximately the 94 level and we have our T cross long, our main predicted moving average pivot level, which is coming in at 93.88. We would look for the market to hold above this for continued dollar strength. Now, the pink line and the blue line down here, the pink line represents the medium-term trend and the blue line represents the long-term trend.
They have both moved above the zero line, but the neural index is still picking up on a little bit of a bear signal, looking at some of those 31 markets that are used for correlation, excuse me, to determine dollar direction. So for now, we’re looking to hold above that key pivot level. And again, in my respectful opinion, you’ll hear mixed commentary over the last several months on the payroll number, but it was a very good payroll number, but so were the other ones.
The U3 number, again, in my respectful opinion only, the market is paying far too much attention to this number. The U6 number is the one we look at. We’ve had a steady decline in that for months now, and those numbers are starting to improve because of that. Again, a very good payroll number right across the board, which should help support the dollar going into next week’s trading.
S&P 500 Index
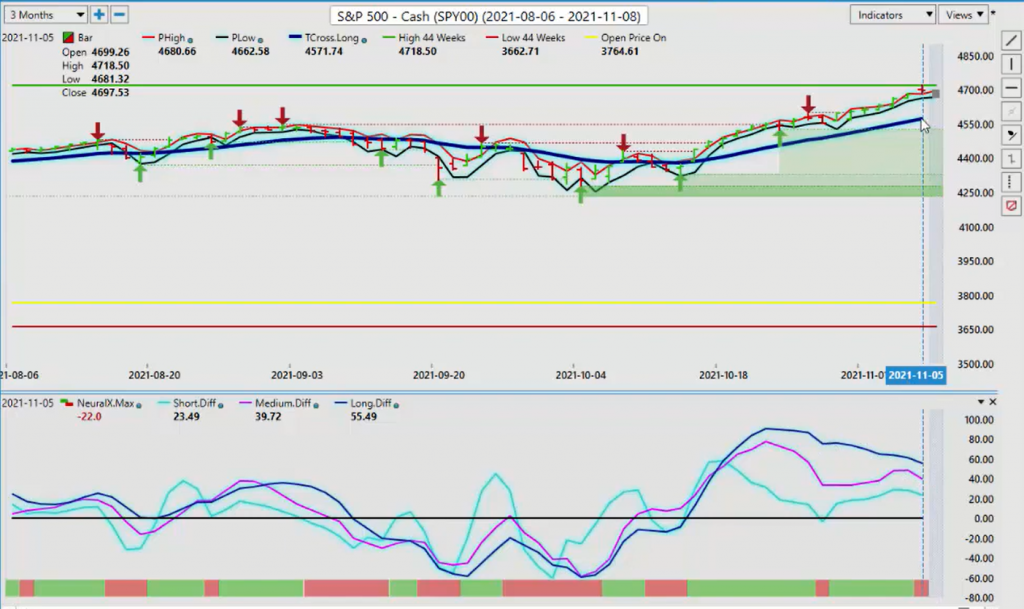
Now, the S&P 500 also benefiting from this. As you can see, these ranges on the S&P are getting very narrow with the predicted high and predicted low.
Our key pivot level there coming in for this coming week, the T cross long is 4,571. My concern is that we have moved a considerable distance away from this particular level, and that usually suggests that a retracement back to this predicted moving average is imminent or very, very likely. Again, be very cautious because we’ve got our predicted differences starting to turn down, our neural index is down, but the market is clearly still bullish while we’re holding above this very, very important VantagePoint level, the T cross long right here at 4,571.
Gold
Now, looking at gold, gold has taken a big move up on Friday for very little reason other than yields falling slightly. I anticipate the yield and the 10 year next week is probably going to retake the 1.6 level. That should push gold back down. But again, as I’ve stated for many, many weeks, if not months now, that gold must clear this very stiff resistance at 1,833. Our point in time, which is based around the yearly opening price, is 1,885.
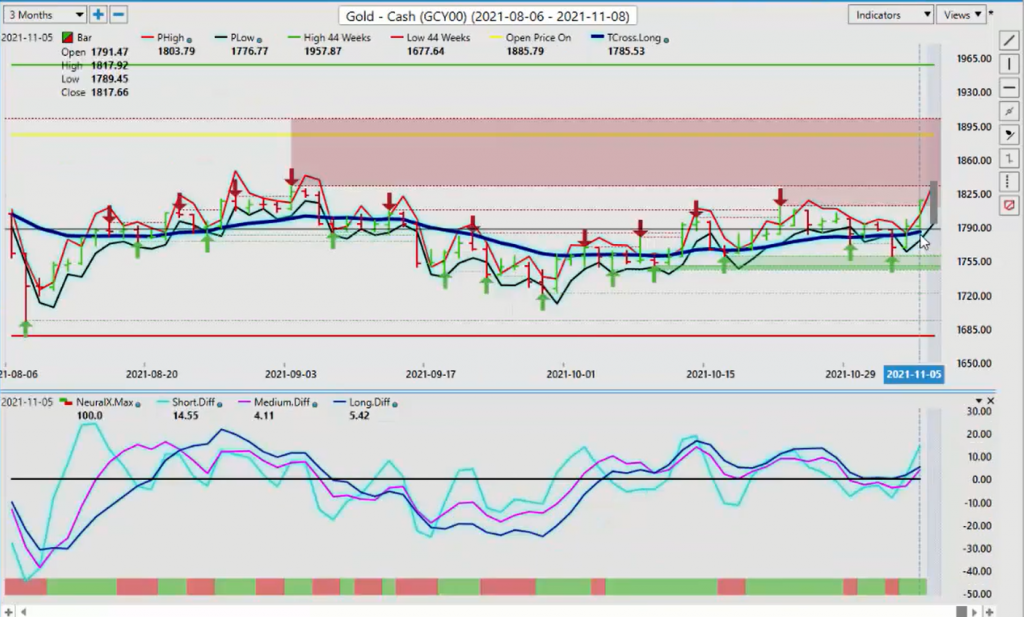
Now, when we look at gold over the calendar year, to dispel that myth that gold has been bullish in 2021, it’s just simply not factual, guys. We’ve been below this yearly opening price for 95% of the calendar year. Gold, there is a seasonality that gold can strengthen older weakness going into the end of November and December. But with that strong payroll number and the Fed on standby ready to end the QE and to possibly look at rates, that there’s a dark cloud still hanging over gold.
So for now, we would look to sell into the 1,833 mark until such time as that resistance is broken. But again, we still have that very important yearly opening price sitting up at approximately 1,886, which is likely to contain any further upside. Now, as we look at Bitcoin, Bitcoin, again, stalling out a little bit here, but I would argue, again, this is our T cross long. We can see that this dark colored blue line is once again a key pivot area using the VantagePoint software, which can take some of the confusion out of it with crossover points and things like that.
Bitcoin
It can be a little bit cleaner and easier to read the chart that in theory, as long as Bitcoin is above that T cross long at 61,282, then it’s technically still bullish. We can assess that our point in time here, our open price on time, 28,098. It really does show how bullish that once again in 2021, just like all the other years, how bullish Bitcoin has actually been more than doubling on the calendar years. I don’t think we’re going to be retracing back to the yearly opening price at any time soon.
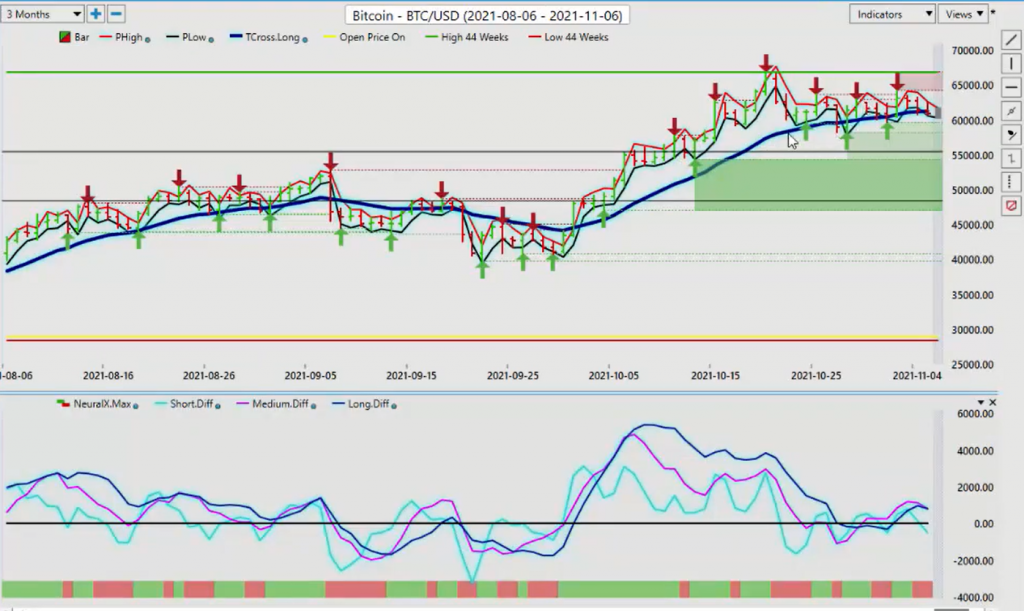
Not to mention, we have very, very strong additional verified support coming in down at that low at 58,201.
Crude Oil
Now, as we look at… Again, we have oil prices here that have been very, very bullish on the year, but oil doesn’t always have the greatest fourth quarter here. It’s usually dependent on equity markets. When we look at this right now, we can see that we’ve crossed over two days in a row. We’ve crossed over that key VantagePoint T cross long. This is a very, very powerful predicted moving average. The theory here, above it long, below it short.
Now, on Friday, we’ve retraced right back to that exact level of that T cross long at 81.59, and we have failed. However, we did not hit the VP predicted low, but our predicted high and predicted low going into Monday’s trade will be dependent to some degree on what happens with that S&P 500. If it can hold those gains, then oil is likely to also, but we are losing momentum here. Our predicted differences, meaning our medium-term strength and our long-term strength, is losing momentum to the upside after we’ve crossed this very important zero line.
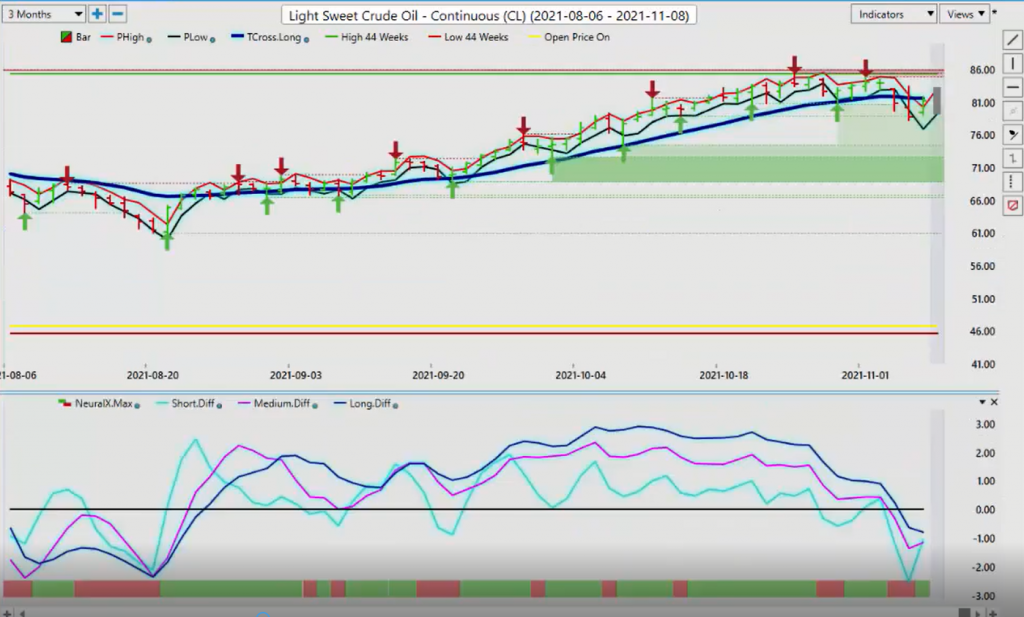
To begin the week, we’ll be watching the 81.59 level very, very closely to see if we can close above that level on Monday and Tuesday for oil to continue to rally. But in my opinion only, if we can’t, then that would open up to the downside on oil, probably down to our next verified support, low, which would come in at 74.42. Now, as we look at some of our main Forex pairs, again, this gives a better view or an alternative way to use the VantagePoint software that’s highly effective.
Euro versus U.S. Dollar
When we look at that T cross long, you can see that this entire calendar week the market has been in contact with this predicted moving average. With my own direct client group, we have only been selling the Euro-US. Now, on our 44 week low, we’re coming in at 1.1524, and we are still getting some buyers down here, even on Friday. But if there is any bullish momentum here in the Euro, gold must break through that 1.833 level. The correlation there is still very high, but on top of that, we must break through this T cross long at 1.1607 and stay above it.
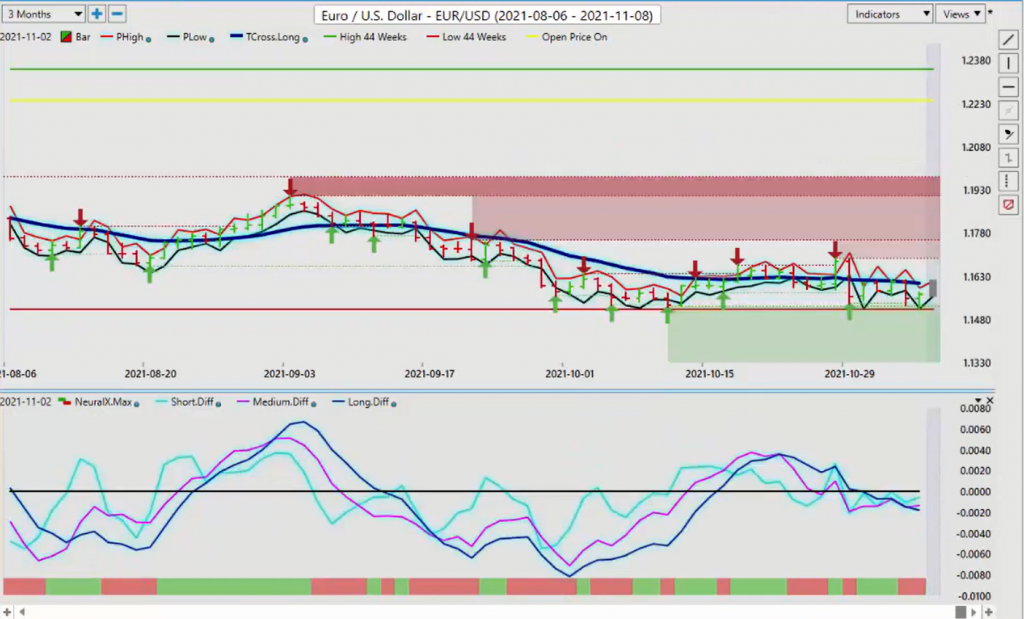
Now, the contrarian signal forming here is you can see this pink line crossing this blue line. That means the medium-term trend is softening against the longer term trend. I would anticipate at the very least we’re probably going to have some kind of corrective move back to 1.1607 or to the verified resistance high coming in at 1.1692. But as you can see, the VantagePoint predicted high on a number of these days, it couldn’t get to the predicted high because it was unable to cross over this T cross long.
It’s very important to use more than just one indicator in your trading, because, again, this is a very mixed bag. Our point in time, the yearly opening price is 1.2241. The Euro, when we look at the structure of this currency, has been extremely bearish in 2021. Some will argue that these currencies go back and forth and that next year the Euro will have a better year. But at the current time, my optimism on that remains heavily guarded.
U.S. Dollar versus Swiss Franc
Now, as we move into the additional pairs that are very similar to the Euro, which is the US-Swiss Franc, now, our predicted differences here are, again, starting to rise. We’ve got a strong payroll number. We would be looking this coming week to overtake this T cross long at .9168. Now, an alternative method in your trading is that if you don’t want to get involved with longs or shorts or anything below this line, then you can put buy orders just above .9168. And if we move above that, chances are the pressure will be off the downside.
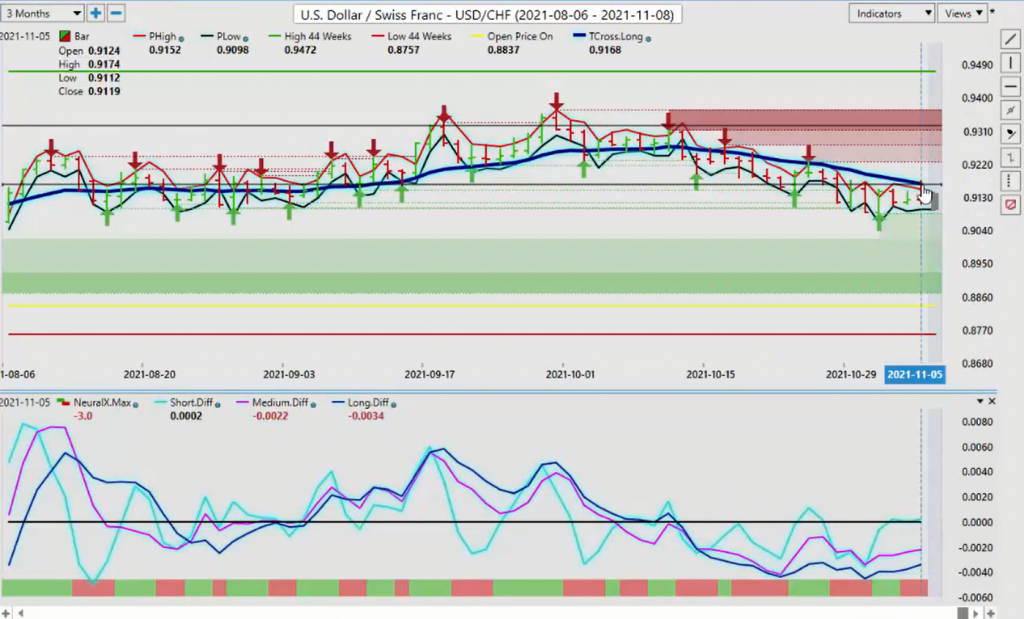
Now, our neural index is not on board yet, but our short-term predicted difference has already broke above the zero line and our medium and long-term trends are starting to turn back up so we could have some very good opportunity when we break above this T cross long or we can use these verified support low, that area would be .9086, to attempt longs as we anticipate the market at the very least will test .9168 very early in the week.
British Pound versus U.S. Dollar
Now, the pound-dollar, very tough week for the pound here. We’ve slipped below our point in time.
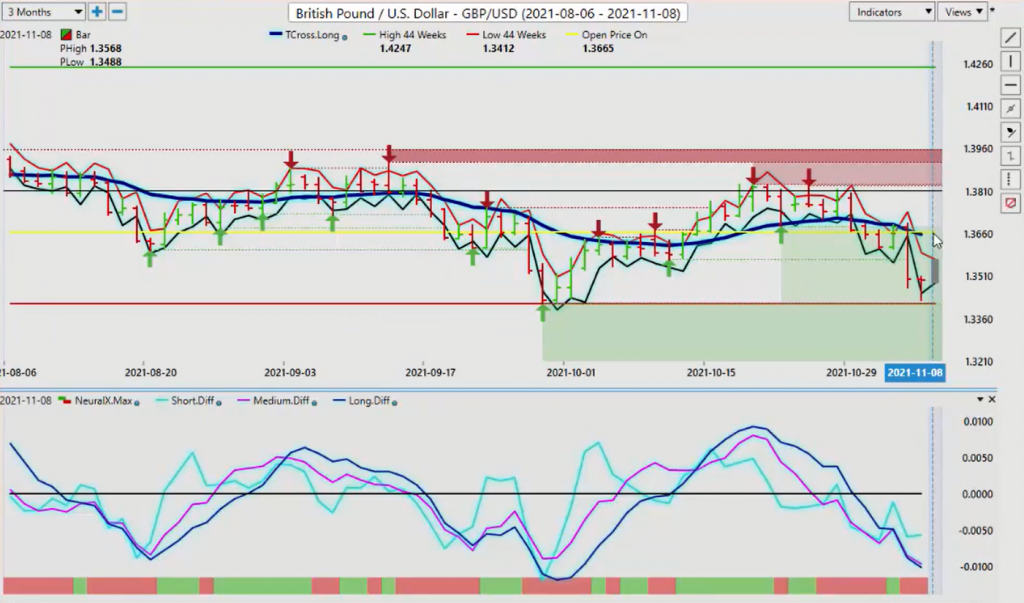
Our yearly opening price, that’s coming in at 1.3665. We broke down decisively below that. But you can see when this move actually started here, guys. We broke down here on, or excuse me, October the 29th. Two days in a row, we closed below the VantagePoint T cross long, and that led to four straight hard down days. Now, what’s interesting here is that we did cross over the yearly opening price suggesting that the pound is turning bearish. Now, very, very heavy verified support down here at 1.3412.
We need to break through that level, guys, if we’re going to continue with this downward move, but there’s definitely pressure building on the pound going into next week.
U.S. Dollar versus Japanese Yen
Now, as we look at the dollar-yen, once again, I think we could have some opportunity here if we can hold along the verified support low at 113.26, but watch out for a bear trap here, guys. Very often with support that’s this heavy, they’ll push it 40 to 60 pips below that level, and then there’ll be a violent reversal back to the upside.
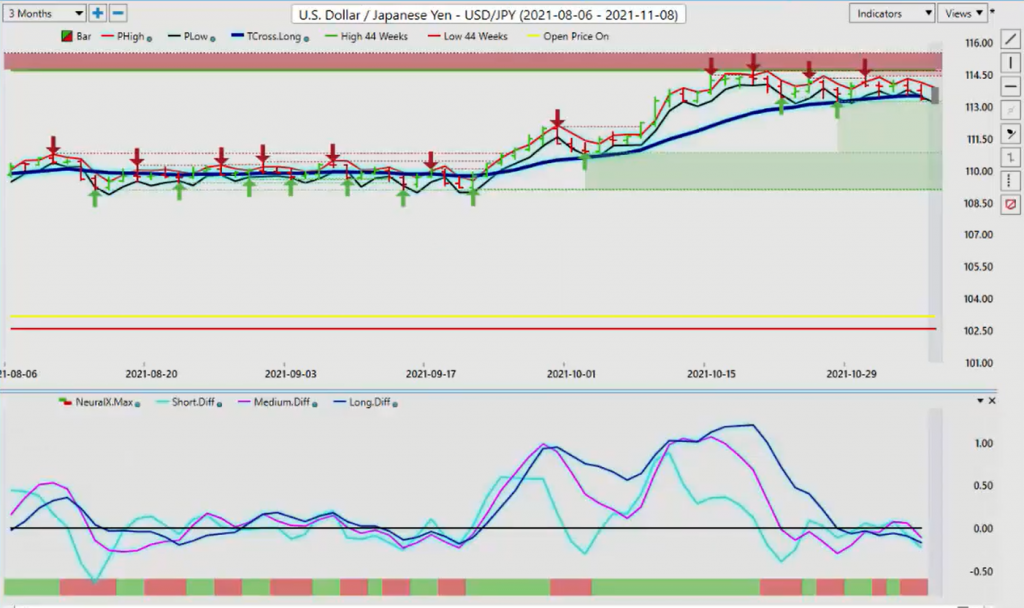
What you want to do is if you’re trading US-Swiss Franc or if you’re trading dollar-yen or if you’re trading both, you want to keep a very close eye on gold contracts. If gold turns very bullish, so will these two currencies. There’s a very high correlation to the Swiss Franc, the Japanese yen, and gold. Positively correlated. Again, we’ll be watching gold this week, but the dollar-yen, when we look at the opening price or the yearly opening price, that’s coming in all the way down at 103.17. The yen has been very, very bearish on the year, as is gold.
U.S. Dollar versus Canadian Dollar
When we look at that correlation, if there’s any shift in that sediment, then there’d be a shift here in sediment also, meaning if gold breaks through 1.833, stays above that level, that may push the dollar-yen back into corrective phase towards potentially the lows of 110. But at this particular time, that seems very, very unlikely. Now, with our three main equity-based currencies or commodity-based currencies, depending on how you look at that, right now we can assess here, the US-Canada is trying to make a move to the upside.
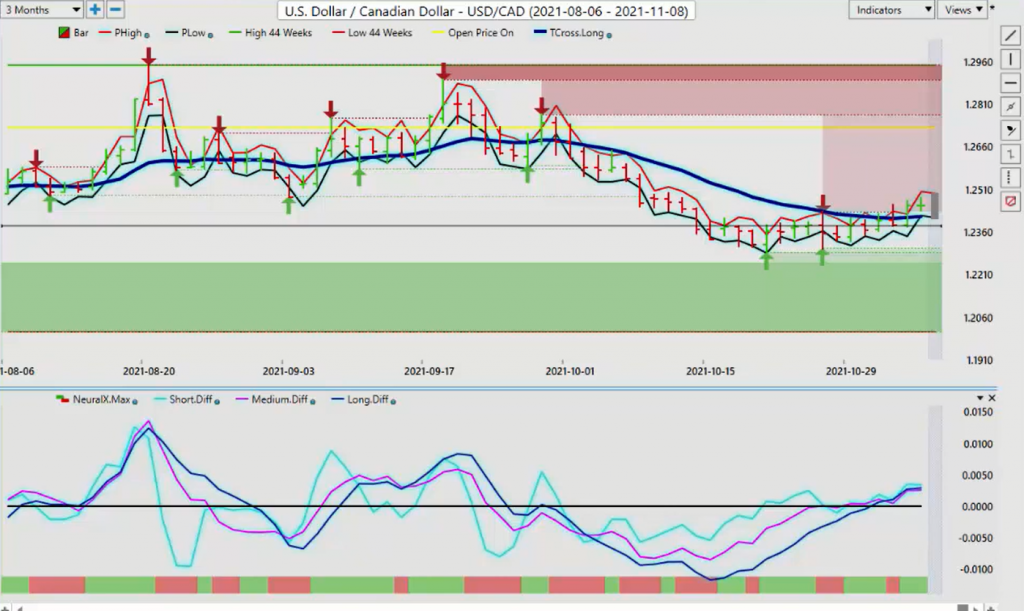
We’ve cleared the T cross long. You can see that we’ve struggled with it this entire week, unable to close above it. But on Thursday, we did close above that T cross long, that very important level from VantagePoint at 1.2413, and we’ve held above it since. So starting the week, you can see we’ve got our predicted low coming in at the 1.2409 area, and we have our T cross long, our major support level, at pretty much the same level here, 1.2415. So that is the area that you want to target for potential longs. Our predicted differences are above the zero line.
Australian Dollar versus U.S. Dollar
Our neural index looks good. So again, this indirectly points to a corrective move further in equities and oil. Now, with the Aussie-Swiss Franc, or excuse me, the Aussie-US pair, as per last week’s weekly outlook, I suggested that the Aussie would not have a very good week this past week, and surely it did not. We have these verify resistance zones at this particular time, and you can see that that resistance high is .7555. We started the week off right off the bat bearish. We broke down and closed below that T cross long on Tuesday.
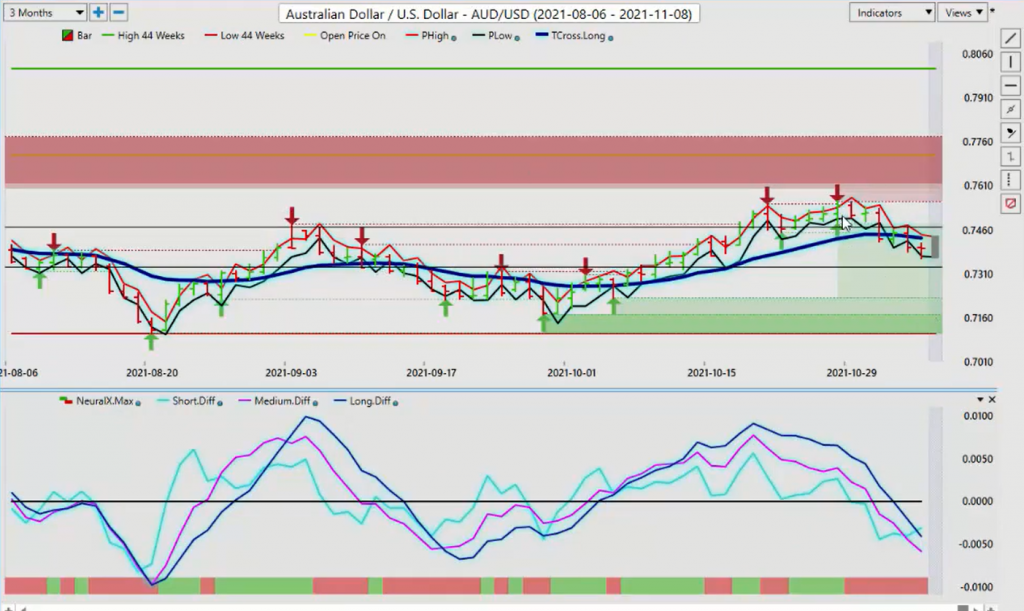
That led to additional losses on the Aussie. Now, again, when we look at our price on open using the yearly opening price .7713, the Aussie has really struggled this year. Once again, not an overly bullish pitch for the equity markets because we have such a high correlation to the Aussie. But again, if the US economy is starting to fire on all cylinders, there’s no reason why the dollar and the S&P five 500 can’t both go up at the same time, equally hurting the Aussie. Now, the New Zealand, a very similar setup here.
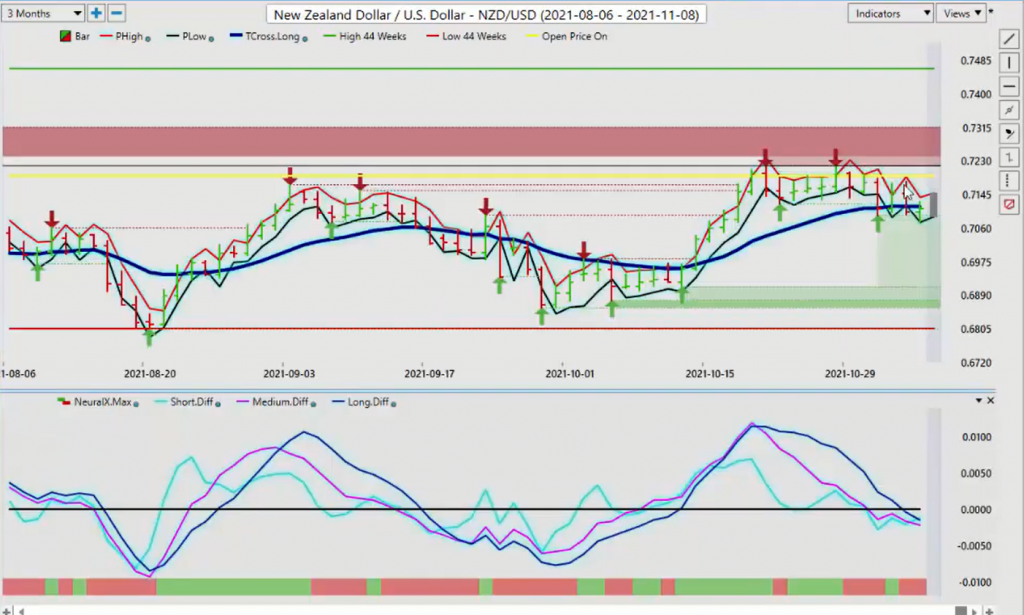
You can see as per last week’s weekly outlook, we were unable to breach this verified resistance at .7217. The Kiwi spending most of the week heading lower. We’re right along this VantagePoint T cross long, but you can see that we also have a verified support low at .7093. We’re looking to break free and clear of this, and that way we can target potentially back down into the next verified support low, which would be .6911.
New Zealand Dollar versus U.S. Dollar
Our predicted short, medium, and long-term differences breaking below that zero line with the neural index, suggesting that the coming week for the Aussie, the New Zealand, and the CAD may not be fantastic week for these particular currencies. Now, we don’t have a lot of top tier data next week. I believe we have the CPI out of the US. But overall, it should be more of a range trading type of week, but still some very, very good opportunity if you know your levels.
So with that said, this is the VantagePoint AI Market Outlook for the week of November the 8th, 2021.