Welcome to the Artificial Intelligence Outlook for Forex trading.
VIDEO TRANSCRIPT
U.S. Dollar Index ($DXY)
Hello everyone, and welcome back. My name is Greg Firman and this is the VantagePoint AI Market Outlook for the week of November the 28th, 2022. Now, to get started this week we’ll begin where we always do, with the US Dollar Index, but we’re going to look at things a little bit differently this week. The structure of the dollar right now, of the dollar index, we know we have 100% inverse correlation between the dollar and the equity markets, the commodity markets, the crypto markets. So this is a big thing to look at, regardless of what market you’re trading. When we look at this via the VantagePoint software, an example of intermarket correlations and how they work, we can assess here that these are the top 10 correlated markets to the dollar, meaning if the dollar index goes up, the ProShares Ultra Short will go up, dollar-yen will go up, dollar-Indian rupee, Singapore-Japanese yen, US-Singapore, Scorpio Tankers.
There’s a fairly lengthy list. But what if the dollar continues its down trend? Then we can look at pairs or other markets that are inversely correlated with a percentage attached to it. For example, iShares MSCI Taiwan Index, EWT, is 98% inversely correlated to the dollar index. So when we look at this right now, we can see that, as the dollar broke down below the VantagePoint T-cross… the market broke down, excuse me, below the VantagePoint T-cross long on November 4, the theory here, then, would be that, if there is a 98% correlation between the dollar and that particular index, then that market should be going up on November 4. And you can see that is exactly what has happened here. So again, when we talk about intermarket analysis, VantagePoint has the ability to look at specifically how highly correlated they are on a percentage basis.
So again, when we look at these numbers, that has a large impact on how we do things. If we look closer at this, regardless of where the dollar goes from here, whether it can recover or not, if it does, these markets will go up. But in the alternative, if the dollar continues to slide like it usually does in the month of December… the seasonal pattern there is quite strong, that the dollar does not do well from about the second week in December on. And we have the Fed and everything else. But if the dollar does move lower, then the Japanese yen will move higher, the E-mini Japanese Yen futures contracts, these are all very highly correlated.
The British pound, 99.22% inversely correlated, as is the British pound currency pair, the Euro, and the Euro-US. So if the dollar continues to hold below the VantagePoint T-cross Long, then that would tell us that the month of December is a decent month to buy Euro-US. is a decent month to buy Euro-US because of these direct intermarket correlations, or in this case an inverse correlation.
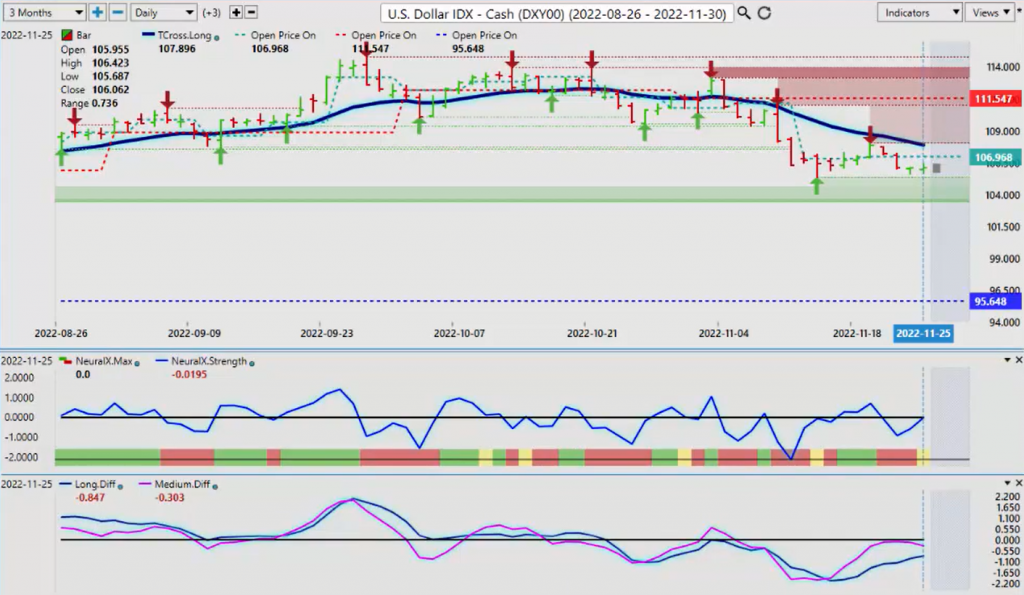
This can be applied to any market in the VantagePoint software with the correlation matrix. Very important. So now that we understand basically how these intermarket correlations work, we can see that we have a newly-formed verified support low, 105.34, but we have additional support on the dollar down to about the 104.60 area. So when we back our software out, we have a look at these verified zones, this is another big one that I’ll be keeping my eye on, is 104.63. A breakdown below that would basically signal that a top is in place for the remainder of the calendar year and the dollar.
And there’s a strong possibility of that. But the Fed ultimately is the one… The Fed meeting. The CPI number in December prior to the Fed meeting, there will be increased volatility. But where we currently sit right now, the dollar index, you can see our Neural Index strength. The Neural Index itself has turned yellow. That’s a cautionary. Very close to a verified support low. So again, our predicted difference is failing at the zero line and is warning us that, okay, still not a lot of dollar sellers down here but not a lot of dollar buyers either.
S&P 500 Index
So again, kind of sideways, looking for a trigger in the market. But the trigger in these markets or in the currency markets will come from the S&P 500. If the S&P 500 breaks to the upside, that will be the dollar killer here, sending Euro-US higher, pound-dollar higher, Aussie-US higher, New Zealand-US higher. Right across the board the dollar will lose ground.
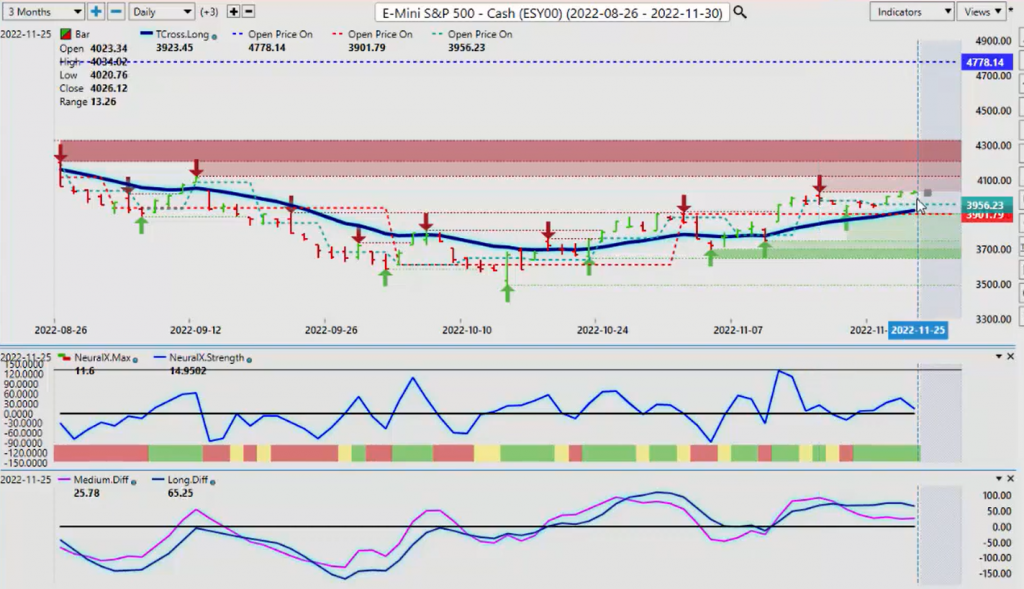
But again, we do have a verified support high coming in at 4028. We’ll need a clean and sustained break of this particular level in order to really get this moving. But as you can see, the S&P 500’s still down substantially on the calendar year, 4778. We’ve struggled this past week but we can see that our VantagePoint T-Cross Long is above the monthly opening price. We’re above the weekly opening price. But there’s also the 200 day moving average sitting up here, which a lot of traders do look at, the 200 day moving average. We’ve cleared that, but very, very slightly. So again, the US dollar index remains above its 200 day moving average at about 105.40, I believe it’s coming in at.
So again, a little bit of… more than a little bit of a mixed signal here from the markets, but a holiday thin market last week. Next week we want to keep a very, very close eye on the 105.34 area down to 104.63 on the dollar index, and we want to see if we can actually move higher and start targeting 4119 on the S&P 500. The indicators are definitely mixed here. Multiple verified zones up here. And again, the dollar index is firmly above its yearly opening price. The S&P 500 and the global equity markets firmly below their yearly opening prices.
Crude Oil
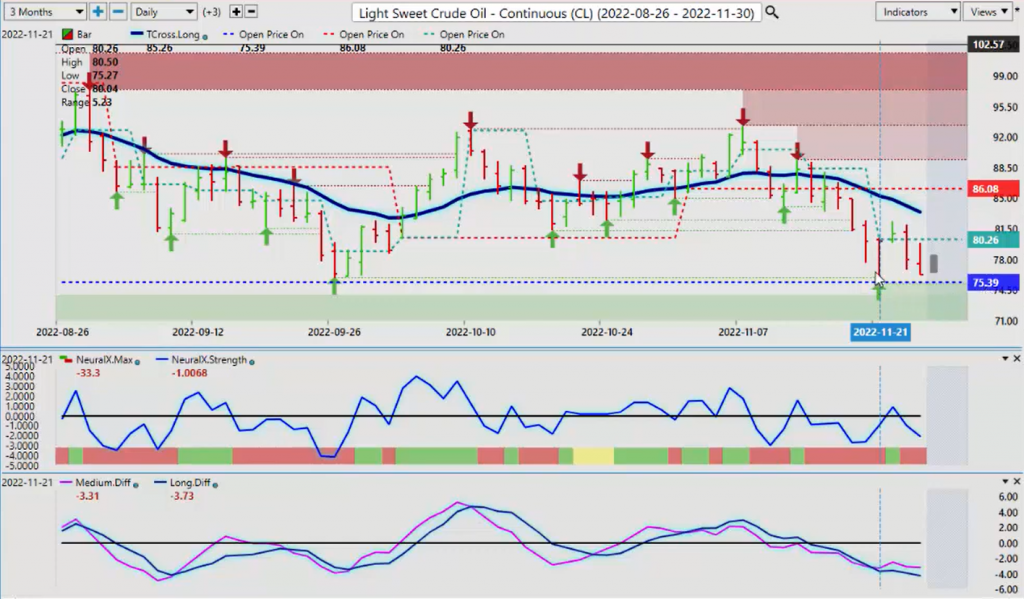
Now, when we look at light sweet crude oil, very, very good short on oil that we discussed in last week’s weekly outlook. Targeting that you can see that the market has come down on Monday, kissed the yearly opening price to the number at 75.39, and then a very shallow bounce out of there, and then back down again. So when we look at oil right now, predominantly bearish right now, but be cautious around 75.39, the yearly opening price. If we get a clean break of that, we could extend lower, but I suspect that, for next week, we’re going to hover between the VantagePoint T-Cross Long at 83.41 and the yearly opening price at 75.39.
You can see that oil, very negative on the month. 86.08. The red is the monthly opening price, the green is the weekly opening price and, again, the blue is the yearly opening price. A very, very important level. Right now, oil barely up anything on the year. We’re closing the week here, we’ve closed at 76.28. The yearly opening price… so if you bought or sold oil on January 1, you’re basically flat on the year. Slightly up, but not very much. Now, the one thing with the yearly opening price, this is the second time we’ve tested this level. So either this level is going to hold or it’s going to break down below there. So either way is fine, but for now the VantagePoint indicators remain somewhat bearish. The only slightly bullish signal we have is the medium term crossing the long term predicted difference. So if we look at that, we can measure our medium term crossover, both the predicted moving average pointing down, the black line pointing down.
But once again, this could turn very quickly on some of the geopolitical issues out there. But for now, in most cases, what I’ve seen, anyway, looking at over a 20 year period, oil usually doesn’t fare that well in the month of December either way.
Gold
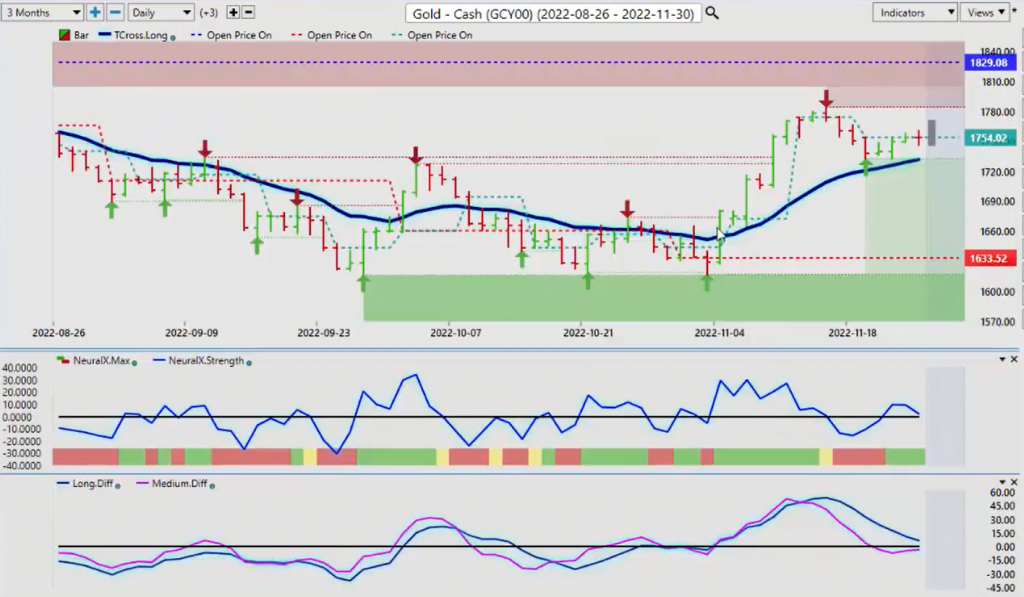
Now, when we look at gold from this past week, once again the structure of the market remains fundamentally bearish. We’re 1829. We’re still negative on the year. A lot of people debate back and forth, “Are my indicators better than your indicator?” All these different things. And what I will say to that, guys, is that the easiest factual way to determine if something is bullish or bearish is, is it positive on the calendar year? Well, we’re entering next week into the final month of the calendar year and gold still is negative on the year.
This is fact, not fiction. Now, with a lot of the things going on in China, possible recession. That could fuel gold buyers here. And the key thing is to know the levels where. So the VantagePoint T-Cross Long, 1732. But we remain above the monthly opening price. But you can see this previous week, we’ve struggled with the weekly opening price. Now, the weekly opening price coming into next week is probably going to be around 1753. So if we can hold above 1753 then gold may be able to still take a run at 1829. There are enough geopolitical conflicts going around globally that could send gold higher. So that’s something we’ll watch. But right now, it is still technically a buy in the VP software while we’re above 1732. That’s a very, very important level to maintain. But again, our Neural Index strength, our Neural Index is still green.
Our Neural Index strength is starting to slope down, but the medium term predicted difference below the zero line, this represents, again… when we click on F7 in our software, we can see that a crossover did take place. So when a crossover takes place, the predicted difference will break down below the zero line. So this is warning us that, again, we’re losing momentum up here, but that can change very quickly.
Bitcoin
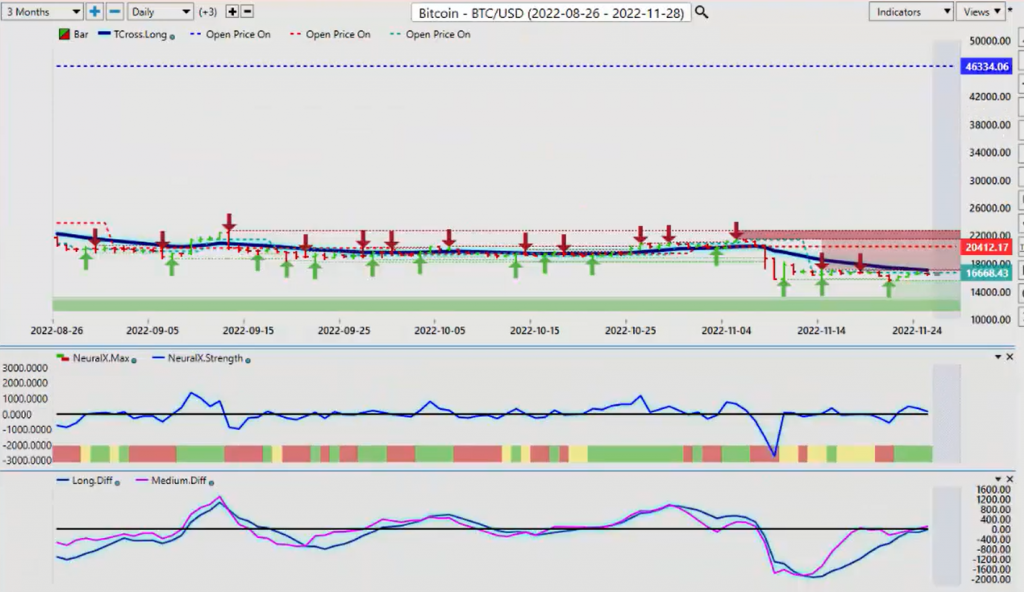
Now, when we look at Bitcoin, bitcoin remains, again, still pretty much bearish here. 16,668. Our predicted differences are trying to push above the zero line. Neural Index strength is green, but understand, a lot of people are confused by the media’s comments on Bitcoin. The reality is, guys, that Bitcoin has a very, very high correlation to stocks. So when we look at it via the correlation matrix, we can see some of the big correlations that Bitcoin actually has here. A number of different stocks in here that carry a 90%. Global cannabis, Dash, Ethereum, Neo. But there’s also a lot of stocks in there too.
When you come back down and you look at this on a quarterly basis, Wolverine, Clovis, Monero, MicroStrategy. When we come down to monthly correlations we can see again a whole different grouping here. But we can assess that the stock market still plays a large part in this. So if the S&P 500 can move higher and the NASDAQ can move higher into the year end, in my respectful opinion there’s a 90% probability that Bitcoin will follow it higher because that’s the basis of intermarket analysis, is that the other markets can be a determining factor for one of the markets that you’re trading. So again, watch stocks very closely.
If you’re still a strong advocate for Bitcoin to go higher in 2023, you could have a very good buying opportunity this coming month. Now, when we look at some of our main forex pairs, we can see the Euro. Once again a bit of an up and down week. Again, 103.26 was last week’s weekly opening price. We’re closing the week at 103.96. A newly-formed verified resistance high. What will it take for the Euro to go higher? As intermarket analysis traders we know this. Or if you don’t know this, I’ll briefly explain it.
Euro versus U.S. Dollar
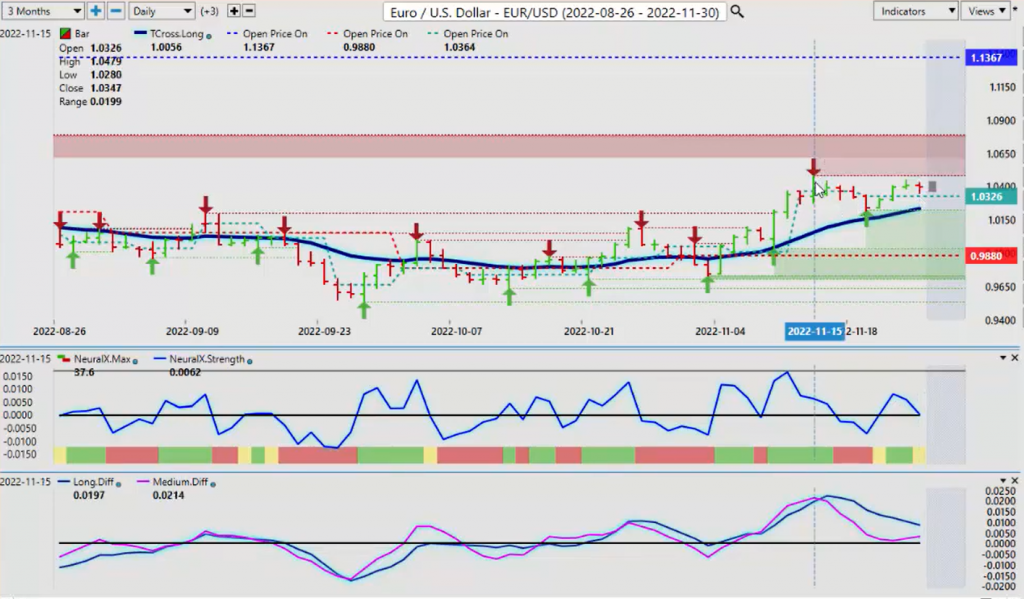
Intermarket correlation is that if gold and stocks can move higher, the dollar will move lower. That will indirectly strengthen the Euro, the British pound, the Canadian, the New Zealand, the kiwi. That’s the way it works, guys. In the Forex market we’re either buying or selling US dollars. The dollar, again, bullish on the year but bearish on the month. So when we look at this right now, the Euro would have to break free and clear of 104.79, in my opinion. But as long as we’re holding above the VantagePoint T-Cross Long at 102.34 then there is still somewhat of a bias to the upside. But the Neural Index strength, the slope of it is struggling. But this is why we use a combination of indicators. Our medium term predicted difference approached the zero line and it’s starting to turn back up, pointing towards dollar weakness.
Now, we do have the non-farm payroll number this Friday. But once again, in my respectful opinion, it’s a non-event because what the Fed has said. The Fed has stated clearly he doesn’t care what that unemployment number is. He’s hiking anyway. So until he changes that rhetoric, we’ll still see volatility around the payroll number but not like what we normally would. So again, this is really all about the December Fed meeting, the December CPI number. This is likely to set the tone for the dollar not just for the remainder of the year but also probably into part of 2023.
So again, the main thing is know your levels. The T-Cross Long 102.34 is the main level.
U.S. Dollar versus Swiss Franc
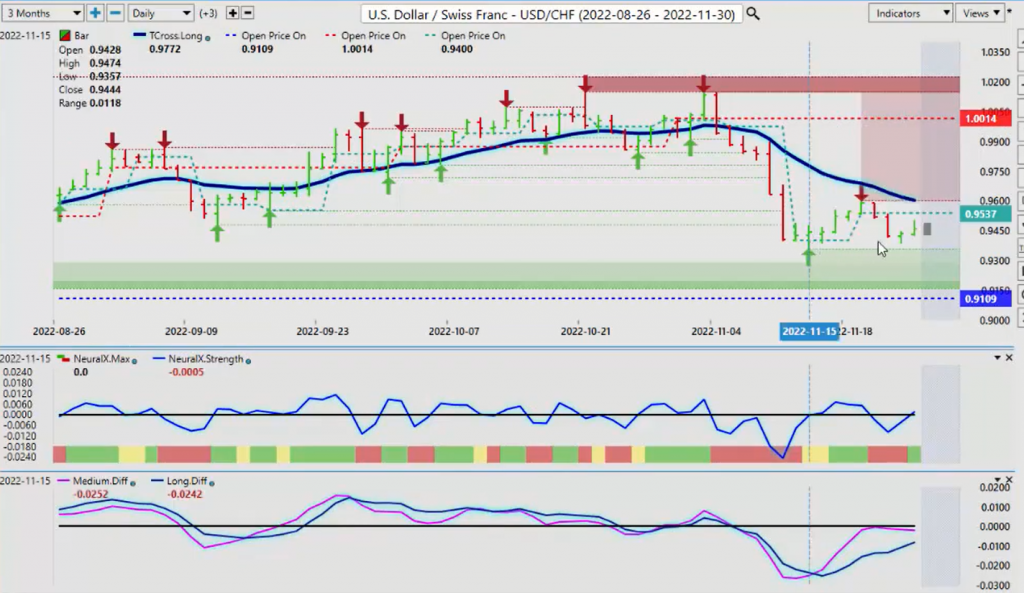
Now, the US Swiss franc, again, basically a dollar index trade is more or less what this is. So right now we’re failing here, but we’re starting to recover somewhat. The structure of this is we’re above the yearly opening price but we’re below the weekly and the monthly opening prices. So we need to stay above the weekly opening price and retake the T-Cross Long, 96.01. If stocks continue to rally, this pair will move lower. If the dollar index continues to sell off, this pair will move lower. So once again, we need the dollar index higher if we’re going to buy here.
The Neural Index and the Neural Index strength are pointing higher. But as we can see, the medium term predicted difference failed to move above the zero line. So what that means in your software is that we tried to make a crossover here but it just couldn’t complete. So again, still a bearish tone here. But again, also 91.09 is the yearly opening price. If you bought this on January 1st, you’re still profitable. Not by a lot, but 400 Pips is still 400 pips.
But again, can we move higher? The only way we can is with that dollar index going higher.
British Pound versus U.S. Dollar
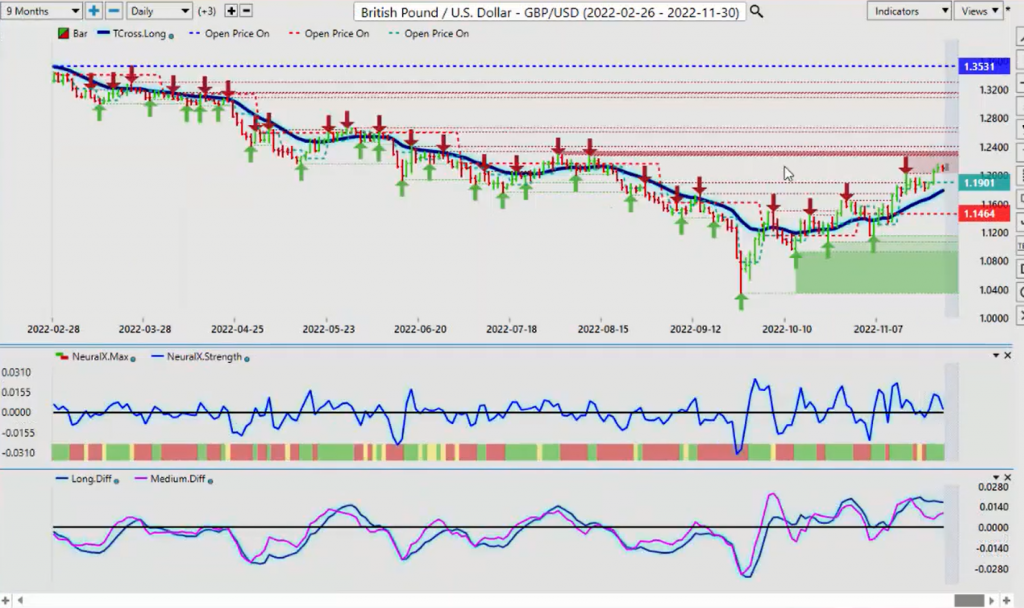
Now, the British pound once again will start to come into some pretty significant resistance up here. From a seasonal standpoint, the pound-dollar usually does very well against the dollar in the month of December. Now, it’s not something you have to time perfectly, it’s just you have to have that in the back of your mind that, look, okay, normally the dollar is weak. But I can’t say for sure what this Fed is going to say in December. But he’s been pretty clear so far. We’ve got a few dissenters from the Fed minutes, so we’ll see how this plays out next week, whether people are willing to take large bets that the dollar will sell off in December and go long the pound. But remember, has anything changed economically or fundamentally in the Euro zone?
Has anything changed technically or fundamentally in the UK? I would argue it’s probably a little worse, if anything. So again, we’ll monitor this. But we’ve got a high, 122.75. We remain locked in the overall range. The lower end of that range is 103.49. So I’m pretty sure you’re going to see some sellers coming out here. We’re just looking for a signal to tell us that. Right now the Neural Index remains positive. We’re above our T-Cross Long. So again, when we look at this, the T-Cross Long, 117.84. But if you click on your F8 in our VantagePoint software, we can get our long predicted. So that level’s coming in at 119.83. This is the long term crossover with just the blue line. And as you can see, the market is in constant daily contact with this number.
So what I would be very, very cautious with this pair and pairs like US-Canada is, often we see a big spike on Monday and then a complete reversal of, whatever it did on Monday it does the exact opposite of on Tuesday. So watch for that big spike. If it’s a big spike up, then likely it would move lower on Tuesday. But if it’s a big spike down, then that potentially is a buying opportunity. So again, the indicators are a little bit mixed but keep a very close on the eye on that dollar index.
U.S. Dollar versus Japanese Yen
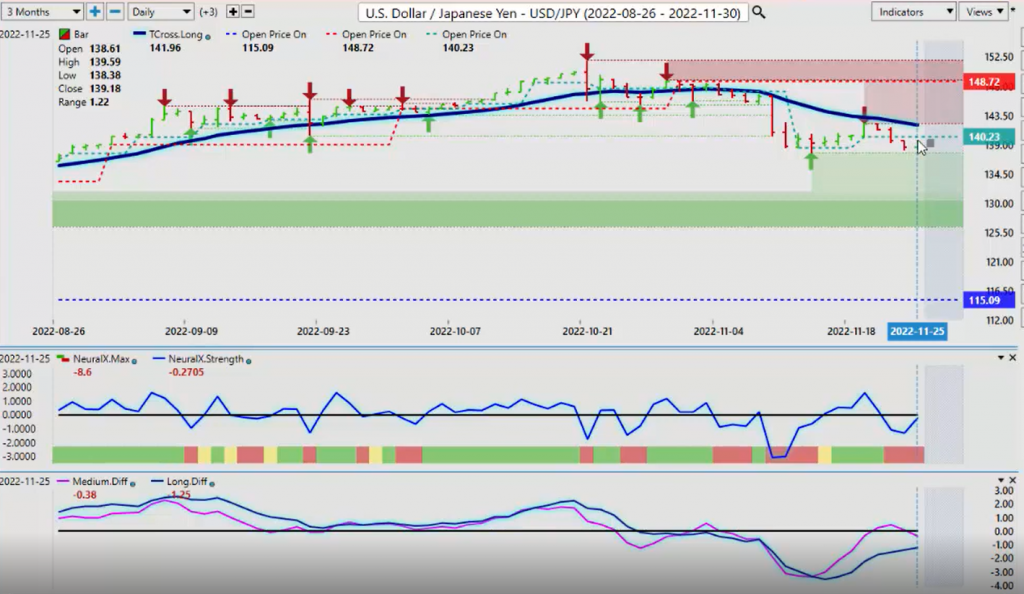
Now, when we look at the most notorious pair right now that I think a lot of people are keeping their eyes on, is of course the dollar-yen pair. Now, the yen has really taken a hit against the dollar this year, but it’s… and even with this most recent selloff from the 148 level, we’re still sitting at 140, which is a pretty crazy high level in my opinion.
I can’t believe we got there but we did. Remember, this is by definition the carry trade guys, meaning that the larger funds want to buy the dollar and sell the yen and get paid that dividend or that swap payment every day times three on Wednesday. So the structure of this is that we have a verified low at 137.68. We’re below our T-Cross Long. But you can see the slope of this Neural Index is starting to point back up. My concern is that we moved higher here.
Again, if we click on our F7 in our software, we’ve had a few crossovers going on right here, but right now it’s trying to cross back down to the down side. That’s what this pink line shows us. So again, we’ll monitor this closely. But I think you’ll still have some buyers coming in around 137.68. So the indicators very mixed with this particular pair, but it will be very, very sensitive to anything that’s going on with China and COVID. Some of the protests there are getting a little interesting. Things that are going on with the Russia, Ukraine War. All of these are potential positives not just for the dollar, but also for the yen.
U.S. Dollar versus Canadian Dollar
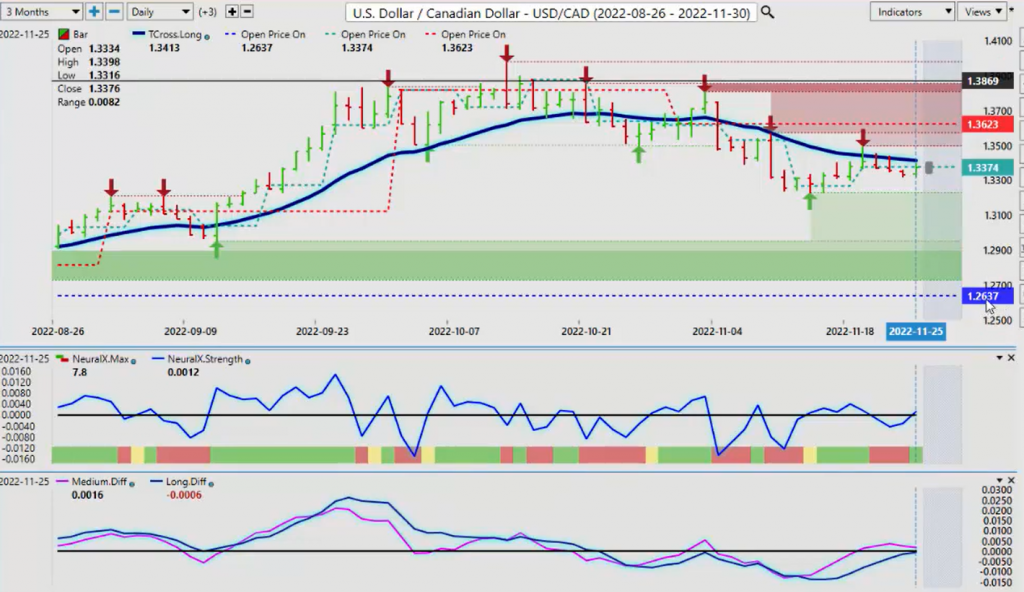
So keep an eye on that area very, very closely. Now, with the US-Canadian pair, once again this is one of the most notorious pairs for the Monday-Tuesday reversal that I’ve seen. It’s something like 90%. So right now, the US-Canadian pair remains firmly above its yearly opening price, 126.37. So if you sold US-Canada on January 1st, you’re pretty deep underwater. But if you bought it January 1st, 2022, you’ve had a pretty strong year with buying this particular pair or buying US dollars against the Canadian dollar. Now, in my respectful opinion only, I think that the Bank of Canada will blink before the Fed does, meaning that they will pause, pivot, or stop hiking before the Federal Reserve.
That’s another negative. But here’s the deal: if the stocks break out to the upside with a Santa Claus rally, that could very well pull the Aussie, the CAD, and the New Zealand up with it. So we’ll monitor this closely. T-Cross long 134.13. The indicators are again turning slightly bullish. We’ve got our medium term, long term predicted difference trying to get above the zero line. The Neural Index strength is pointing higher. Once again, when we look at the US Canadian pair, a lot of people, what they will say is, “Well, I’m a stock trader. I don’t trade currencies.” And then I have currency traders that say, “Oh, I’m not trading stocks.” I hate to be the bearer of bad news, guys, but you’re both trading stocks and you’re both trading currencies. And this is one of the ways we would look at this.
So if we look at these quarterly correlations on the US-CAD pair, these markets carry a correlation from 84% to 92%. You can see that there’s a number of different… you’ve got the ProShares Ultra Short Qs, but then your inverse correlations down here. Very interesting, the number of stocks, ETFs, commodities that can play into these correlations. But in the VantagePoint software, using the neural networks we can look at the monthly, the quarterly, and the yearly correlations, which actually increases the intermarkets that we use.
So if I come out to the yearly, the inverse correlation, meaning that if US-Canada goes down there’s a 95% chance here that the Aussie-US is going to go higher. The Aussie dollar futures will go higher. Steel case. These stocks here will all go higher if US-Canada moves lower. This is the primary basis of what intermarket analysis is. VantagePoint, using the neural networks to find these intermarket correlations and then forecast that, the market’s based on that. So to give you some sort of an inside look into the software, how this works: Right now, when we look at this, if we can break above this then this pair would likely have a problem. If we click on our F8 you can see that we’re really hugging close to the long predicted. That’s around 133.58. So watch that area very closely to start the week. Once again, whichever way the US-Canadian pair breaks, the Aussie-US will go the other way.
Australian Dollar versus U.S. Dollar
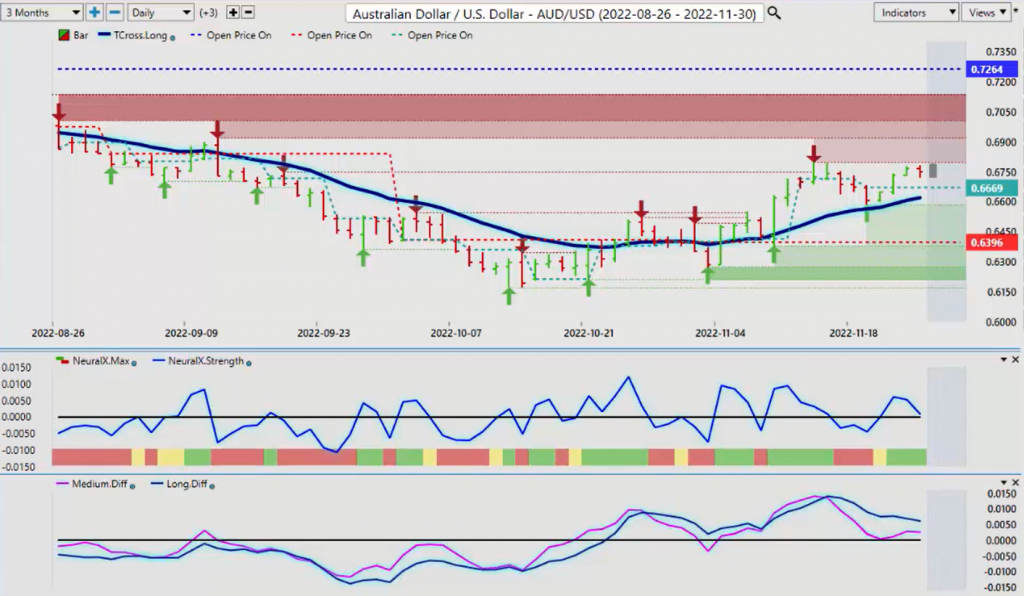
So if US-Canada breaks lower, then we know that Aussie-US will ultimately go higher. New Zealand-US will go higher. But again, we’ve got a strong verified support high, 67.97. This is the area we need to break. What will it take? It will take the S&P 500 going higher.
New Zealand versus U.S. Dollar
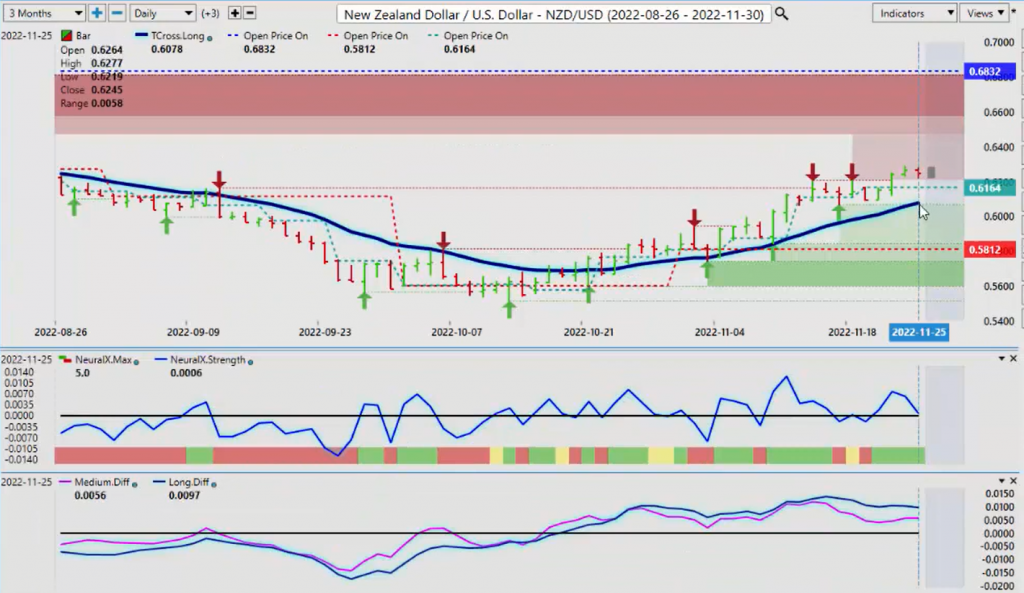
The same thing with the New Zealand currency. If the S&P 500 can break higher, then the kiwi will go higher also. This is what we would look for. Everybody’s talking about a Santa Claus rally. Everybody’s talking about the stocks are going to recover. But the media’s spin on what the Fed’s position is is just that, media spin. That’s all it is. The Fed has not verified any of these comments that any of these news outlets have said. So expect a choppy week as we go into month end. In most cases stocks do rally, so probably a short term move against the dollar. And then we see where we are in the month of December. So with that said, this is the VantagePoint AI Market Outlook for the week of November 28th, 2022