Welcome to the Artificial Intelligence Outlook for Forex trading.
VIDEO TRANSCRIPT
Hello, everyone and welcome back. My name is Greg Firman, and this is the VantagePoint AI Market Outlook for the week of November the 15th, 2021. Now, to get started this week, we’re going to begin where we always do with that very important US dollar index. But first, we’re going to look at the indicators we’re using in the predictions for this week with a quick recap of what we had predicted for last week.
We’re looking at the 44 week look back, basically the yearly range of every single market. We’re using bars, not candles to clearly identify where the volume is, the predicted short, medium, and long-term differences, along with the neural index, the point in time. I have it fixed at the yearly opening price to determine the primary trend in each one of the markets that we’re going to look at. We’ve got the predicted high, the predicted low, the triple EMA cross.
But as you can see, I’ve modified it and removed the short-term predicted moving average and the medium-term predicted moving average. As we move into the fourth quarter, we’re looking for well defined pivot points. And of course, the very popular verified support and resistance zones. Now, as we look at the dollar index and a quick recap of what I had discussed last week that we need to hold above this VantagePoint T cross long, which at the time of last week’s presentation was about 93.89, 93.90.
Now, you can see that we’ve held that line and we’ve got our medium-term predicted difference crossing our long-term predicted difference. With the neural index turning green, this led to a substantial rally in the dollar index as predicted. Now, the area that we were watching very closely as the breakout point was 93.50. We’ve taken that out. We set at a new high for the year. We’re now at the 95, approximately closing out the week, excuse me, at about the 95.13 area.
U.S. Dollar Index
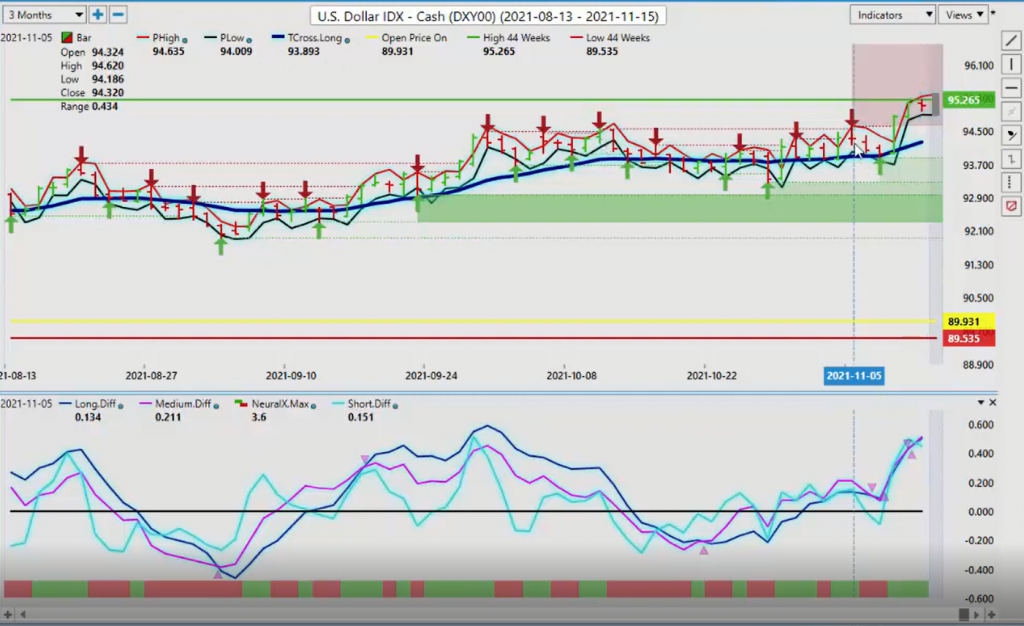
A good strong move on the dollar index, but we need to maintain this momentum. Now, again, the line in the sand between bullish and bears, the T cross long is now 94.23. But in my respectful opinion only, this top of this verified zone at 94.62 is the level. We want to see the dollar hold above this particular level. Now, what I’ve warned everybody in the past and I’ll warn them again, there is a clear cycle in the US dollar.
We see buying at the end of the month into the first week of the new month, and we see dollar weakness around the 20th of the month. So be very cautious with dollar longs as we start moving into Thursday and Friday. We still have that seasonality that we have to deal with dollar weakness in the month of December. Now, if we do a comparative analysis to gold, which we were also watching gold very closely, it too has broken out above a very significant resistance level at 1,833.
However, we can see there’s a very big difference between the US dollar and gold. We keep hearing people talking about gold as an inflation risk. I’m not in that camp, guys. I believe that Bitcoin is the inflation risk… Is where they’re going to for… The risk of inflation is with Bitcoin. But if we look at gold, gold has been bearish this entire calendar year. If you bought gold on January 1, you have lost money this entire year.
Now, if we do a quick analysis on the dollar, the dollar index opened the year at or about the 89.93 area. It’s been up the entire year. Now, they’ve both moved back and forth within their respective ranges. But as we sit here on November the 13th, the dollar remains firmly bullish. Now, gold is recovering as we can see, but it’s very important to point out which one is in an uptrend and which one is not. Gold is still not in an uptrend and it’s not even profitable on the year unless we can get…
And I would argue the yearly opening price is more around the 1,904 area. But as identified, using that point in time, we’ve got 1,885. We would need to overtake that level. Now, gold did make a big spike on that CPI number on Wednesday, but it has done absolutely nothing since. It has not exceeded the high from basically that one hour bar right after the… Well, actually about two bars after the CPI announcement.
Gold
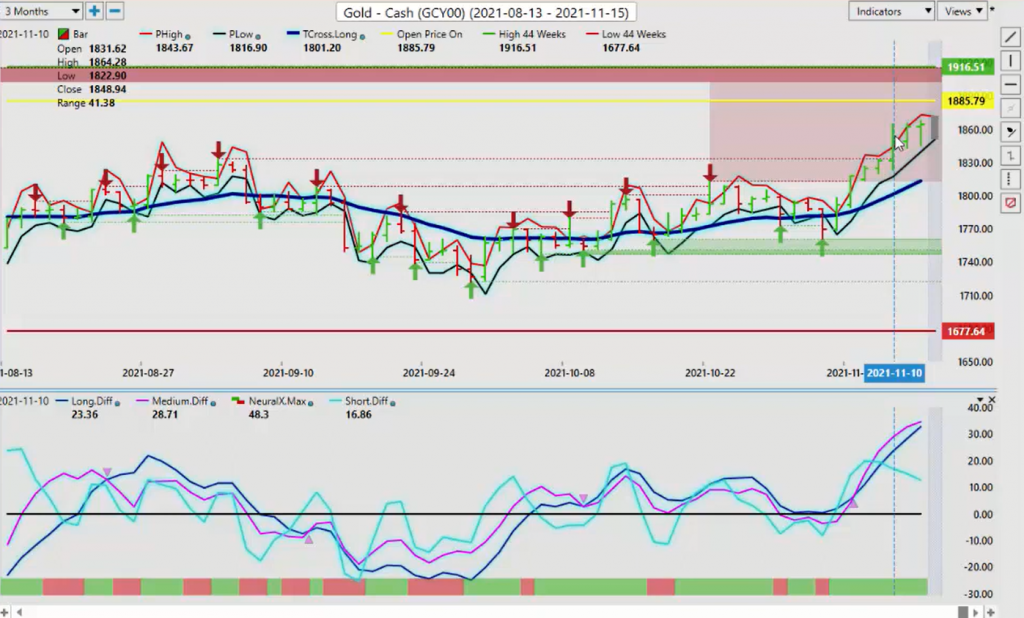
Basically gold had peaked on Wednesday around 11:00 AM, approximately 10:00, 11:00 AM and it’s been stumbling a bit ever since. Again, when we look the primary trend, it’s very important to do complete and thorough analysis. Now, the MA diff crossing over here as we retook that T cross long, we’re looking now for this pink line to cross over this blue line in order to warn us that gold is getting ready to sell off yet again. The probability of that remains high going into the fourth quarter.
S&P 500 Index
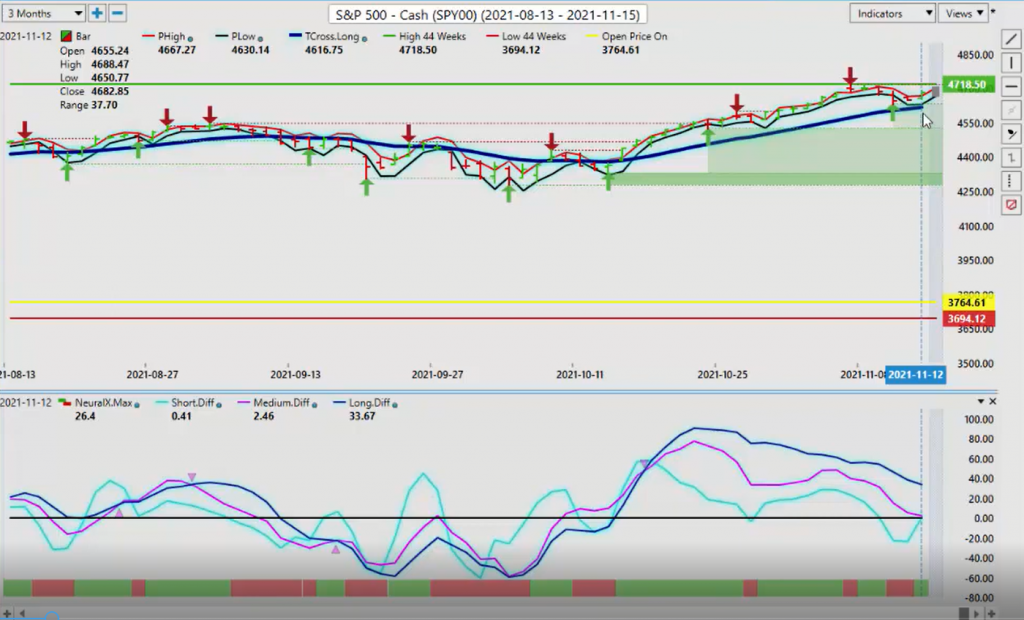
Now, as suggested in last week’s weekly outlook stocks would likely struggle a bit up here. And again, we’ve had a good corrective move lower, but the recovering yet, again, going into the close there just seems to be nothing to stop the rally in the stock market. It’s turned around it’s on its way back up, but again, we want to watch this T cross long pivot area very closely at 46 16.
The theory here, guys, to simplify this down, a different way of using your VantagePoint software is that we use the same concept as a 200 day moving average or a 50 day moving average. Except with the T cross long being a predicted moving average, we get much closer to the price action and we get the lag out of it. There’s a considerable amount of lag in a 50, 100, or especially a 200 day moving average. This way we can catch these reversals and make money on both sides.
But for now, stocks remain bullish while above that key T cross long as you can see at 4,616.
Crude Oil
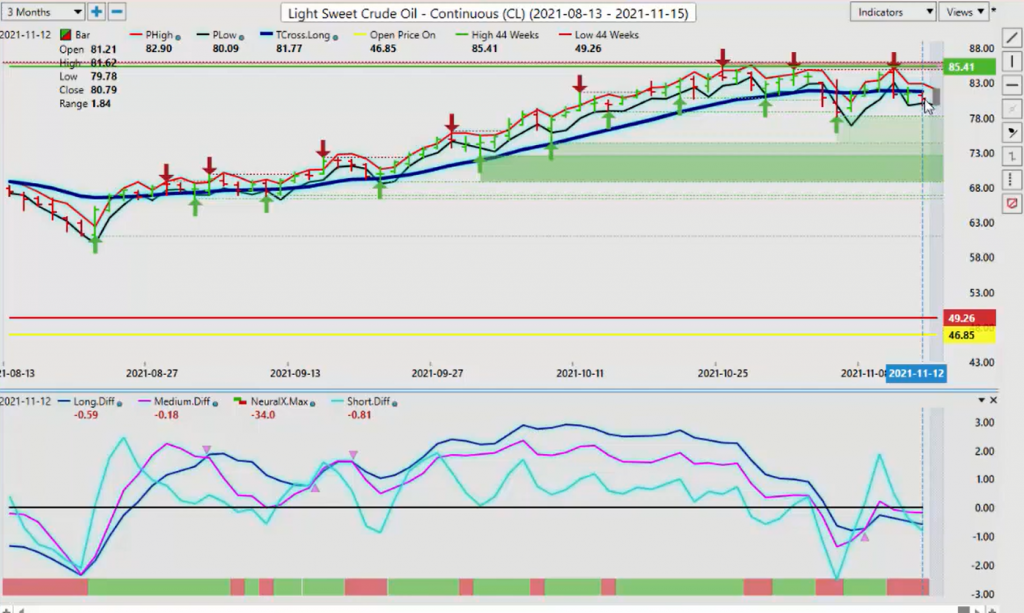
Now, as we look at light sweet crude oil, oil continues to be pressured to the downside, but it can recover very quickly if stocks going back up. My optimism here though remains guarded respecting also that seasonality. I would argue that oil is not that strong in the fourth quarter. Again, when we look at this, we’re holding under that T cross long, 81.77, bearish while under this particular level.
Now, you’ll notice this pink arrow here. The medium-term trend is trying to change against the longer term trend. Right now oil is trying to recover. If we get these predicted differences above the zero line and the S&P 500 and the global stock indexes start to move up, then oil will likely follow. So watch this level very close at, again, 81.77. One could argue that if you remain bullish with oil, you can tag your limit orders just above 81.77, say 82.05, and that would trigger a buy order above that level.
Personally, I would rather see it close above that level before I take that long. But again, many different ways it can be done.
Bitcoin
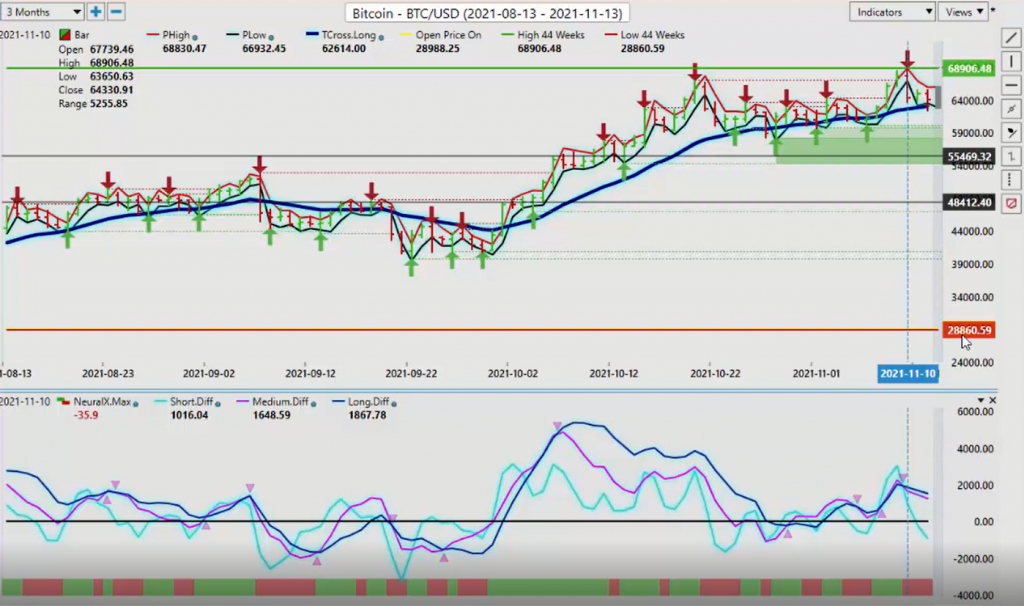
Now, as we look at Bitcoin going into next week’s trading, once again, we’ve come right down to the T cross long. That coming in at 63,059, and we’re bouncing out of there yet again. Bitcoin making a new high for the year. That’s coming in at almost 69,000.
Guys, remember, we have had multiple opportunities. If nothing else, based around this AI weekly outlook, we’ve been excessive buyers near that yearly opening price, that point in time, which is coming in down at or about the… I believe it’s around the 28,000, 29,000 mark. But again, the point in time is very important. Because when we look at the yearly opening price at Bitcoin, it paints a very clear picture that this is a very bullish market. We’ve gone all the way up here.
You can see we’ve hit a high in April the 14th. We’ve come all the way back down. We’ve hit exactly to the yearly opening price, and we have had an even bigger rally to the upside. That warns that we could still see a retracement. But Fibonacci I don’t believe is in play here, guys. Right now we’re going to focus around the VantagePoint T cross long and that will give us the pivot area that we need. That level for this starting of this coming week is 63,059. We’re long well above that.
But even if we look down here, we’ve got good, strong… The verified support zones are also quite heavy, and those levels are coming in at or about the 60,000 mark, 60,100. Again, we can expect a further corrective move based around this medium-term crossing the long-term predicted difference. You can see it right here. It’s now identified for you in the VantagePoint software with the most recent free upgrade. These arrows have been put in there to identify these types of contrarian moves.
Now, again, be very cautious with shorts on Bitcoin, because clearly we have a lot of buyers sitting down here. So we’ll be watching the 63,000 mark very closely going into the beginning of the week.
Euro versus U.S. Dollar
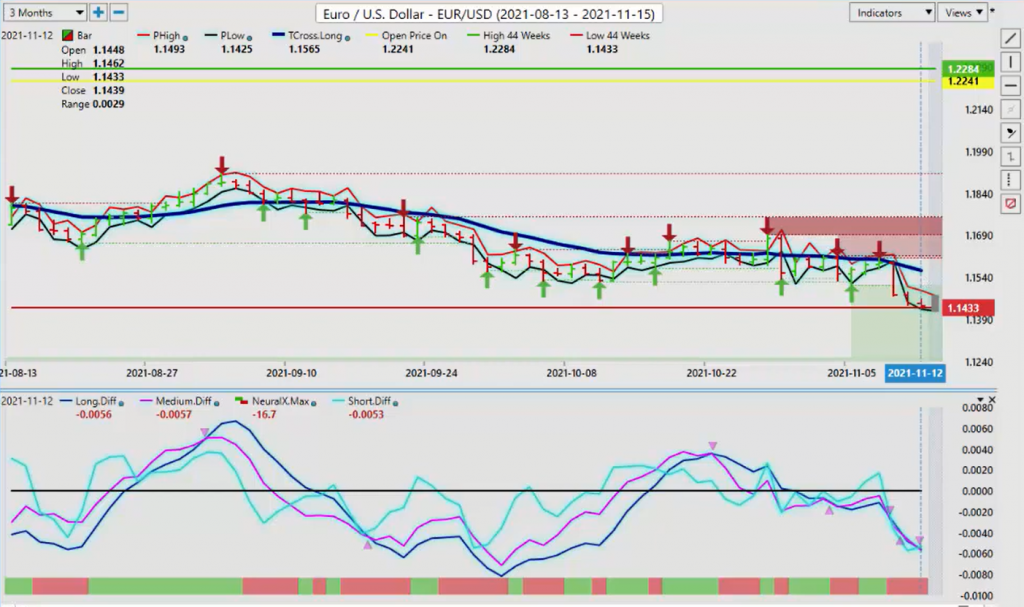
Now, as we break into our main Forex pairs, the dollar, again, just decimating the Euro yet again. It’s very important to outline this with what led to this. Now, again, we’ve had multiple, multiple days with the market running into the VantagePoint T cross long. Each one of these days represents a short.
We’ve done this in the VantagePoint live training room. That again, when we look at this, it’s just a matter of time before… If it can’t break through the T cross long, it’s going to make a substantial move to the downside, which it’s done. We’ve set a new yearly low here on the Euro, 1.1439. But if we go back to pre-COVID here, guys, remember, the Euro was trading down around 1.11, 1.10. Never say never that it can’t go any lower. Just because something is oversold doesn’t mean it’s going to reverse.
So for now, I think that we will have some revision to the mean back towards the T cross long 1.1565. Now, you can also click F8 in your VantagePoint software and that gives us, again, our long predict. That’s at 1.1510. The blue line by itself provides a very strong pivot level, meaning that the market always comes to this level, and then we’re looking for it to fail.
The predicted high is coming in at about 1.1475, but again, the long predicted, so if we’re looking at shorting the Euro on Monday, we would look to short between 1.15.10 and the VantagePoint predicted high for the day at 1.1475. And then again, all stops above that T cross long. But again, when we look at the Euro, you often see the different websites, “The euro is bullish. The euro is bullish.” Well, guys, it’s not.
When we look at the Euro on a year over year basis, this is a relatively ugly chart here, but it’s a very, very strong move to the downside after a phenomenal 2020 year with COVID and gold prices rising over 2,000. But the Euro can also be a leading indicator to warn us to be careful with gold longs, because gold contracts in the Euro have about a 90% positive correlation. So either the Euro is getting ready to bounce or gold, which I suspect is more than likely getting ready to sell-off.
U.S. Dollar versus Swiss Franc
Now, with the US-Swiss Franc, again, a very high correlation. As I mentioned in last week’s weekly outlook, that we need to overtake the T cross long. We did that on Wednesday. If you’re watching last week’s weekly outlook, you have your limit orders sitting… You’re able to short into the T cross long until such time as we break and close above it. Then you can see the very next day, it uses that T cross long as a pivot level to bounce off of.
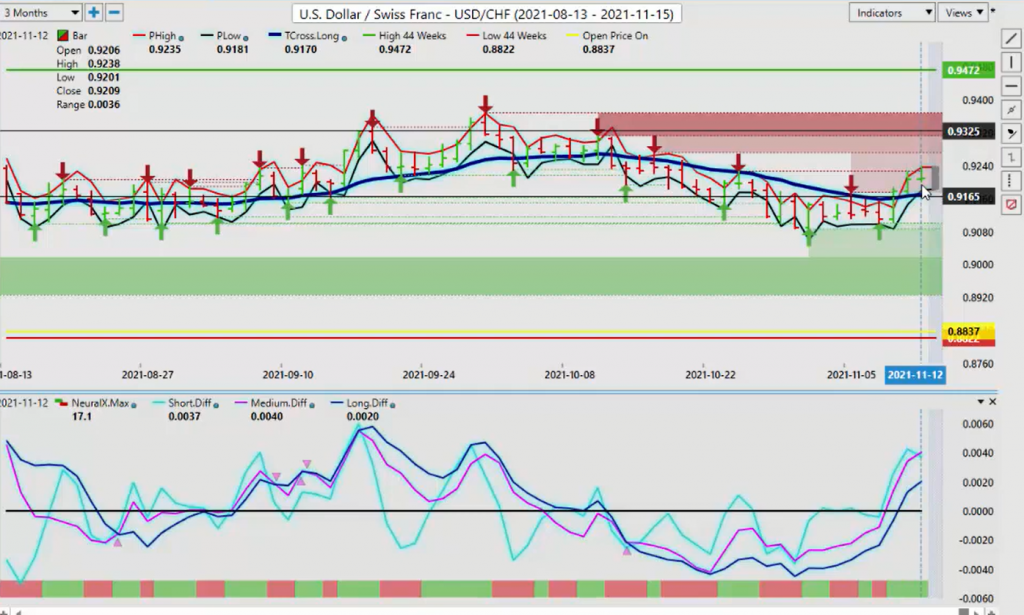
Once again, we’ve got a good move up on here, but we need to watch that… The T cross long now, the former resistance turns support. It identifies the area of .9170. That’s the area we want to watch to begin the week. We can look get our predicted low for the day on Monday is .9184. When you combine the T cross long at, again, .9170 and the predicted low at the .9184 area, then we know exactly where the area is before the market even opens. This presentation is being done Saturday evening at 6:00 PM.
The markets are closed here, guys. Again, we predetermine these levels to get into these trades, and then you simply apply the necessary stop loss that suits your particular trade and your particular trade account. Now, as we look at the pound-dollar, another great example of how the single predicted moving average provide a very clear picture into where we want to look at to either buy or sell. Again, the theory, below this blue line we’re short, above we’re long.
British Pound versus U.S. Dollar
Now, the interesting point with the pound-dollar is it slipped below its yearly opening price at 1.3665. We then had a retracement back up to this level on Tuesday. You can see that we came up to a high of 1.3605. We actually did this trade in the VantagePoint live training room and identified exactly what we’re doing right now. You can see that when we look and we compile the indicators together, we’ve got our yearly opening price here at 1.3665. We’ve got our VantagePoint T cross long coming in right here.
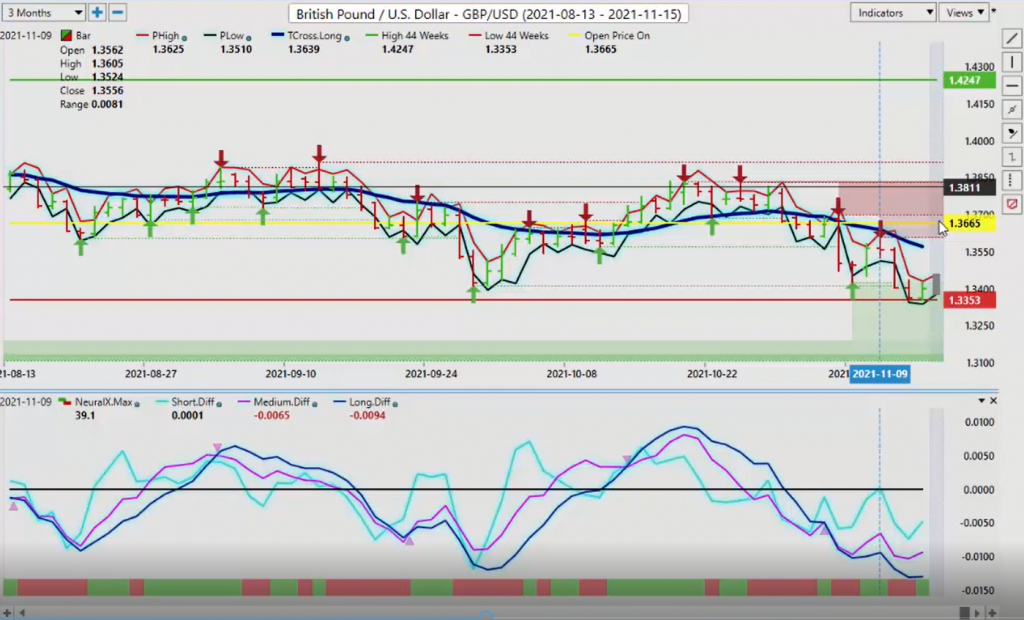
All we’re doing is letting it retrace, and then a nice big move to the downside. Once again, the pound looks like it’s in trouble, but we still have that theory of mean revision, which I firmly support and believe in. The further we move away from this dark blue line, the T cross long, the less attractive this trade to the downside is to me. I want this to retrace. That one level is the T cross long is 1.3571. If you click on the F8 in your VantagePoint software, you will get the long predicted.
This provides an additional level of 1.3467. Now, 1.3467 is right on the VantagePoint predicted high for the day, or very close to it at 1.3456. This is the area we would target for shorts to begin the week if we anticipate further US dollar strength. Now, one of the other key markets that we were watching this week, again, we did in the VantagePoint live training room, and I warned everybody in the room on Monday and Tuesday to be very cautious of a bear trap down here, because I’m not a buyer of gold.
When dollar-yen slipped it below here, gold exploded up on Wednesday, but the dollar-yen recovered. If that was a true price on gold, I would’ve expected to see the dollar-yen pair sell off, even if the dollar made gains against other pairs. That didn’t come to fruition here. Gold continued to advance, but the dollar-yen advanced. We see right now at this time of year, the dollar and gold are moving up together, up and down together to some degree I would argue. But that is not going to stay in place for very long.
One or the other is going to go higher. The argument here now is that gold has real competition in Bitcoin, in Ethereum, in these digital current currencies in general. I haven’t heard a single CEO of any corporation saying that they’re hedging inflation or they’re hedging currency risk with gold. Every one of them has said Bitcoin, and a few now are saying Ethereum and some of the other digital currencies. Gold is kind of the odd man out here again.
U.S. Dollar versus Japanese Yen
But right now the dollar-yen to begin the week, we can use our T cross long, that’s coming in at 113.55. We’re long well above that level. The VantagePoint predicted low for Monday, it’s coming at 113.66. All of our support is pre-identified pre-market before the market even opens on Sunday night at 5:00 or 6:00 PM Eastern Standard Time. We’ve already predetermined where our key levels are. We can see here in the upgrade with our VantagePoint software this pink triangle.

This little arrow is telling us, okay, the medium-term trend is weakening against the long-term trend and it’s going higher. Pink line crosses the blue line, that led to a substantial move up in the dollar-yen, off of this area. And we identified this very specific level of 112.76 in the VP live training room to, again, be careful of a bear trap. Gold is still in a strong down trend in 2021. Not overall. I get that. But in 2021, gold has not done.
The bias is for further yen weakness, for further Swiss France weakness. These are currencies that are tied to gold. Again, we want to keep a very close eye to start the week, but that’s the level we’re watching.
U.S. Dollar versus Canadian Dollar
Now, as we look at the US-Canadian dollar, once again, it was just too much for the Canadian dollar. There’s two main correlations the Canadian dollar that you want to keep an eye on based around the VantagePoint software, and one is the S&P 500 and the other one is oil.
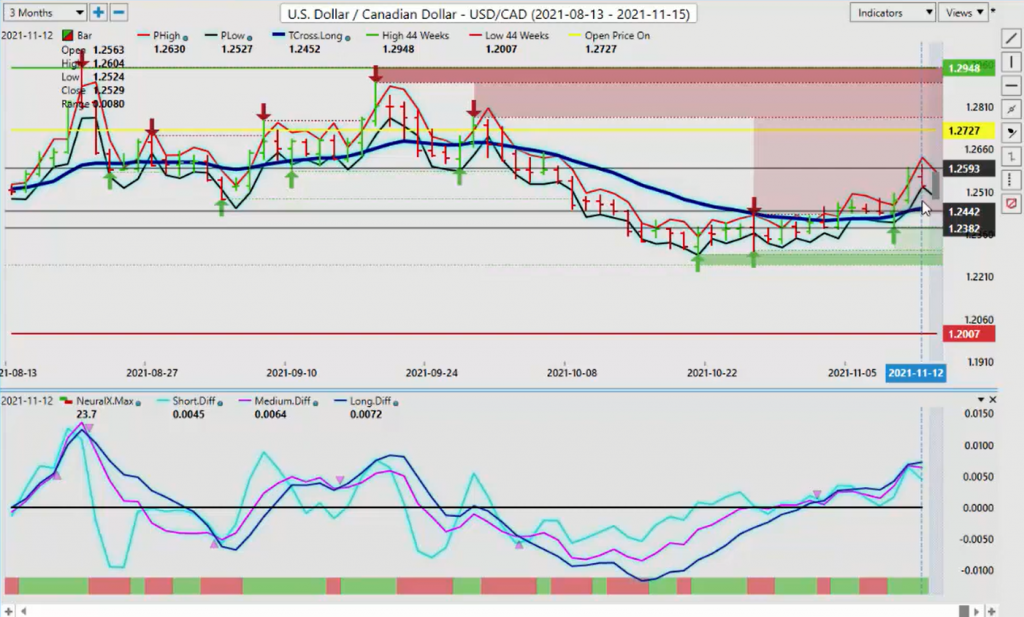
Both of those two came under pressure this past week and easily pushed the US-CAD almost to the 1.26 level. Right now I believe we will have a bit of a mean revision also coming back down into the T cross long around 1.2452, but that will be dictated by the S&P 500 and light sweet crude oil. If they advance higher, then there will be a short up here. Now, remember, the yearly opening price on the US-CAD is coming in at 1.2727. It’s still bearish, technically speaking, while below that level.
Because again, if you’re buying US-Canada on January 1 and you’re still holding it, it’s not profitable. My only job here is to bring that to your attention. The yearly opening price is a non-indicator. It’s a commonality that’s used in the S&P. If the S&P is above its yearly opening price, well, it’s bullish. Stocks are profitable, which they are very profitable, right? And that translates into a profitable Canadian dollar. Once again, we’ll keep an eye on this. But as you can see here, the neural index is still up.
The primary move, yes, it was triggered by the US CPI, but that buy signal from VantagePoint was already in place. We’re holding above the T cross long. We briefly slipped below it on that CPI announcement, only for it to extend considerably higher on Thursday and Friday. We’re still looking for US dollar gains. But against the Canadian dollar, stocks and oil are going to dictate that.
Australian Dollar versus U.S. Dollar
Now, with the Aussie and the New Zealand, again, going back last week’s weekly outlook and the weekly outlook before that, we forecasted that specifically Aussie-US and New Zealand-US were going to struggle. The New Zealand yearly opening price, .7713. There’s nothing bullish about this, guys. However, when we look at it right now, we’ve had a big move down off of this. We’re still within the overall I would argue the immediate range, the low end of that range coming in at .7226.
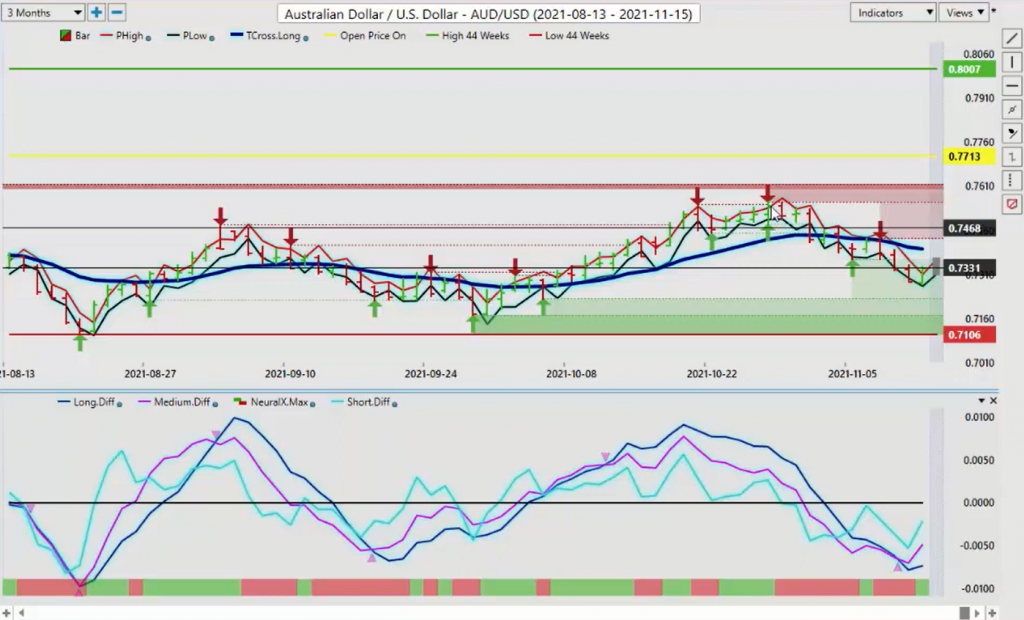
But here’s the deal, guys, we’re coming off here. We’ve got this little arrow right there that is saying the medium-term trend TO the downside is starting to soften. So that tells me, you remember last week when I said that if the Aussie sells off and the New Zealand, the Kiwi sells off, US-CAD is going to go higher, but the S&P 500 is the trigger for all three of these currency pairs, US-CAD, New Zealand-US, Aussie-US.
So if the S&P 500 recovers, and I believe it will, then this would tell me that buying Aussie down here next week may not be a bad idea. If nothing else, I believe we’re going to revert back to the mean, and that level’s coming in at .7397.
New Zealand Dollar versus U.S. Dollar
We can see the exact same thing with the New Zealand dollar. The New Zealand dollar is the one we targeted in the… Well, actually in the VP room this past week, we targeted both of these pairs, because they’re the same trade. But the New Zealand was more attractive to me.
When I was asked about it in the live room and I said, “Okay, well, I like the New Zealand better because the risk to reward ratios are better because we’re so close to this yearly opening price.” Using the VantagePoint point in time, two ways you can use the point in time. Before we close off, let’s have a quick look at this custom indicator, because it is very helpful not just identifying a long-term trend, but also a short-term trend.
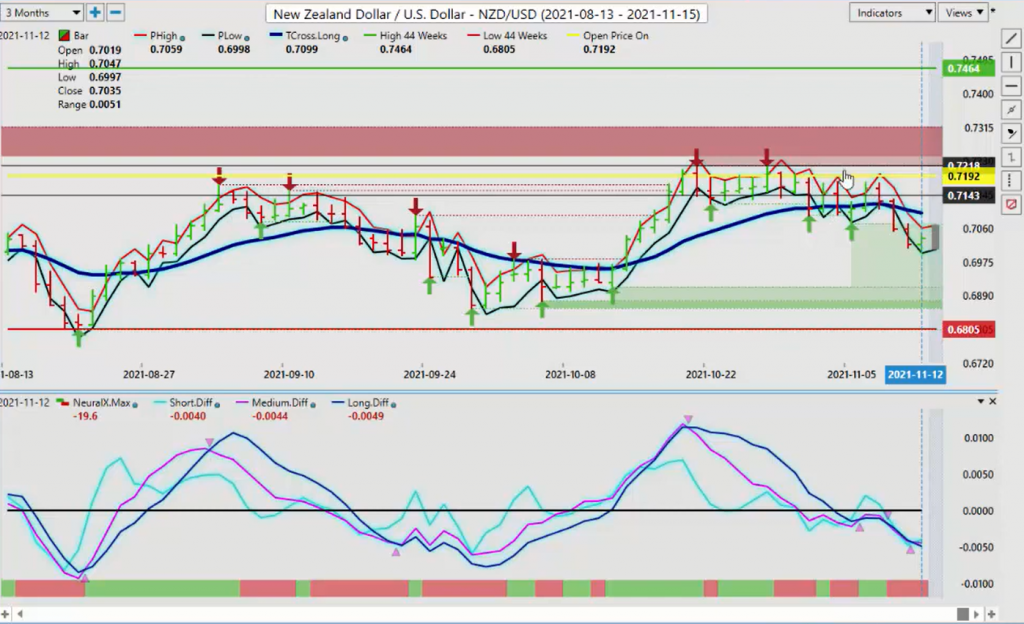
Because as you can see, I can change it from the yearly to the quarterly, the monthly, but this is the one I really like, guys, is combining the yearly open price with the weekly opening price. When we do that, you can see that the line drops down. I’ve done this many on many occasions. But when we use that weekly opening price, first of all, the yearly opening price dictates that this is bearish overall trend. We’re holding above the T cross long on Monday and Tuesday, but just barely.
Then on Wednesday, when we break down below the T cross long and we break down below the weekly opening price, your sell limit orders will be sitting just below that and it activates the trade. When we look at a trade, something like that, that can be very profit in the Forex market. Now, if I look at that, I put it on here. I just draw a little bit of a line. But even from the breakdown point to the opening price on Friday, if we look at that and we do a profit calculation on that, I’m not going to go with five lots, because I wouldn’t recommend that.
But on a single tiny lot, that’s $1,522. These are the kind of trades that we look for, guys, because they’re pre-determined. We can identify them before they happen. But as you can see right now, I could make that same argument that we have this little triangle here, this arrow, and that’s warning us that this downward move is losing its momentum.
Whenever I see that, then shorts will be off the table and I’ll be looking for a counter trend long on a… Basically I believe we will revert one way or the other back to the mean, and that mean is the T cross long at .7099. So with that said, this is the VantagePoint AI Market Outlook for the week of November the 15th, 2021.