


Welcome to the Artificial Intelligence Outlook for Forex trading.
VIDEO TRANSCRIPT
Hello everyone and welcome back. My name is Greg Firman and this is the VantagePoint AI Market Outlook for the week of November 1, 2021.
U.S. Dollar Index
Now, to get started this week, we’re going to begin where we always do with that very important US Dollar Index. Now, the first thing we want to do this week is look at what we’re using for our main analysis, for more of a complete analysis in the global markets. We’re using this 37-week lookback or the 52-week lookback that’s modified to stay within the calendar year, but we’re using bars, not candles. We’ve got our predicted short, medium, and long-term predicted differences, along with our Neural Index, our point in time to identify our weekly opening, our yearly opening price. We’re using the predicted high and predicted low, the Triple EMA cross. But you’ll notice here with the Triple EMA cross, for this week’s presentation, because we’re coming into such a volatile week, I’ve removed the T cross short and medium, and we’re sticking with the long-term pivot area, that T cross long. And, of course, the very popular verified support and resistance zones to make sure that we’re identifying major price action failure points.
Now, when we look at the dollar here, a very interesting move here this week that we predicted in last week’s Weekly Outlook. And I’ve discussed this on a regular basis that, again, during the beginning of the month, we have dollar strength, at the end of the month into the first week of the new month. Now, this is a classic thing that, again, just so traders are aware, this is a commonality on Thursdays. We have the market doing this massive reversal from what we’ve done the entire week. We can assess that the dollar has been strong for the better part of the week. And then on Thursday, it just got slammed on profit taking, only to fully recover those losses and extend higher on Friday. This is likely to continue into next week because we’ve seen that seasonal pattern at the beginning of the month.
Now, this coming week, I’ll warn everybody, is going to be extremely volatile. We’ve got some international holidays. We’ve got the Bank of England. We’ve got the FOMC. And then on top of all that, we have the nonfarm payroll number on Friday. So there is going to be no shortage of volatility. But again, what I will warn everybody is that regarding what tools or what trade setups you’re using, be very, very cautious in the financial markets after about 9:00 a.m. Eastern Standard Time on Thursday because everything gets turned upside down.
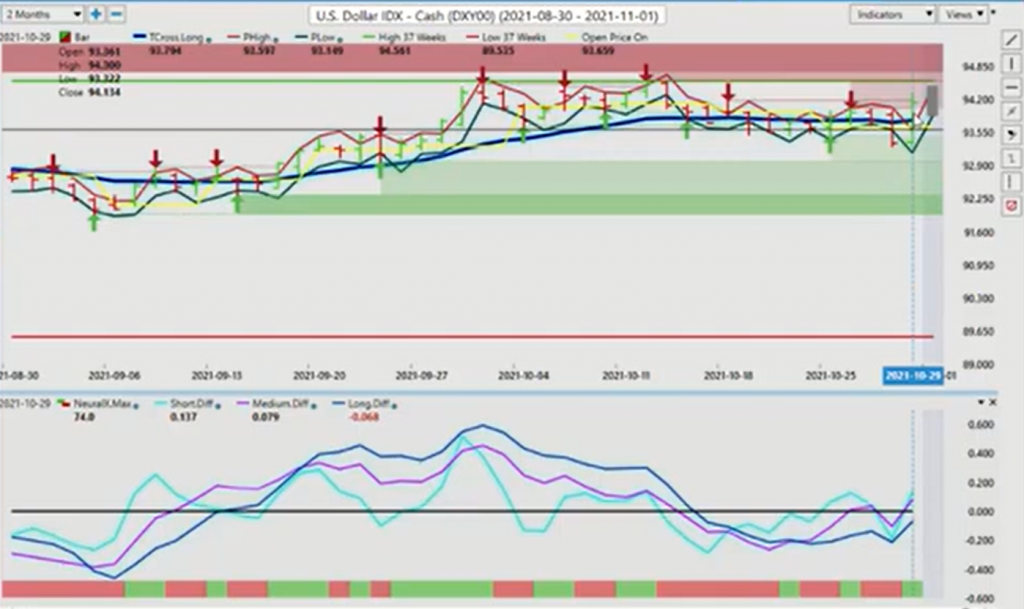
Now, if we look closer at the Dollar Index, once again we’re using that T cross long, and in this case I’m using it by itself and I’ve removed all the other moving averages to remove any kind of confusion, the theory here is the market is bullish while above it and it’s bearish while below it. And then we use that level as a pivot area. So to start the week, our T cross long is 93.79. That will also be approximately, if we look at our weekly opening price, what that’s going to be next week is it will be approximately 94.13. So the stage is set for a potential bullish move on the dollar. That’s what we’ll be watching out for. But again, I would like to see the market hold above 94.13 and more specifically above 93.79, which, of course, is our T cross long.
Now, the last several days we’ve broken out of the predicted low and we’ve broken above the predicted high. So when we look at it to the start the week, if we look at that T cross long and the predicted low at 93.88, they are virtually at the same level. We’ve got our predicted short, medium, and long-term differences rising. Now, this pink line measures the medium-term, the strength of the medium-term crossover and the strength of the long-term crossover. That allows me to remove it off the main chart and focus on my T cross long while also paying close attention to the strength of all of those other crossovers, the short, medium, and long term. They are all rising, the Neural Index is positive, so we’re looking for dollar strength.
Gold
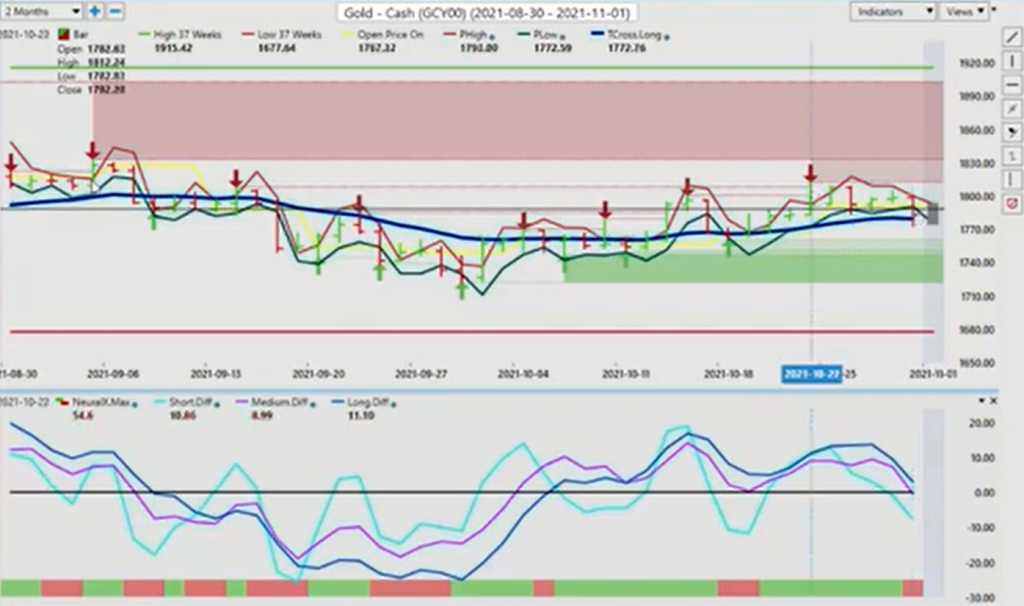
Now, when we apply this to gold, we can see again I’ve been a very strong advocate for selling gold into rallies. And even with in my own trading, I’ve got strong limit, buy limit orders, but they’re sitting above 1833. Right now, you can see that we are not clearing the 1808 level, 1812. We were doing this, this past week in the VantagePoint Live Training Room where I had stated it’s a difficult buy on gold when you’ve got Bitcoin rising, the dollar holding firmly above its yearly opening price, gold holding firmly below its yearly opening price. This is what we look for. So right now, gold is finding some support on the T cross long at 1779. But that support is unlikely to hold. We’ve got our predicted differences pointing down. The medium-term crossover, the strength of it is gaining momentum to the downside. And our Neural Index has turned negative after a long period of green. We’ve also closed below the weekly opening price, the previous week opening price, all of which point to further losses in gold.
S&P 500 Index
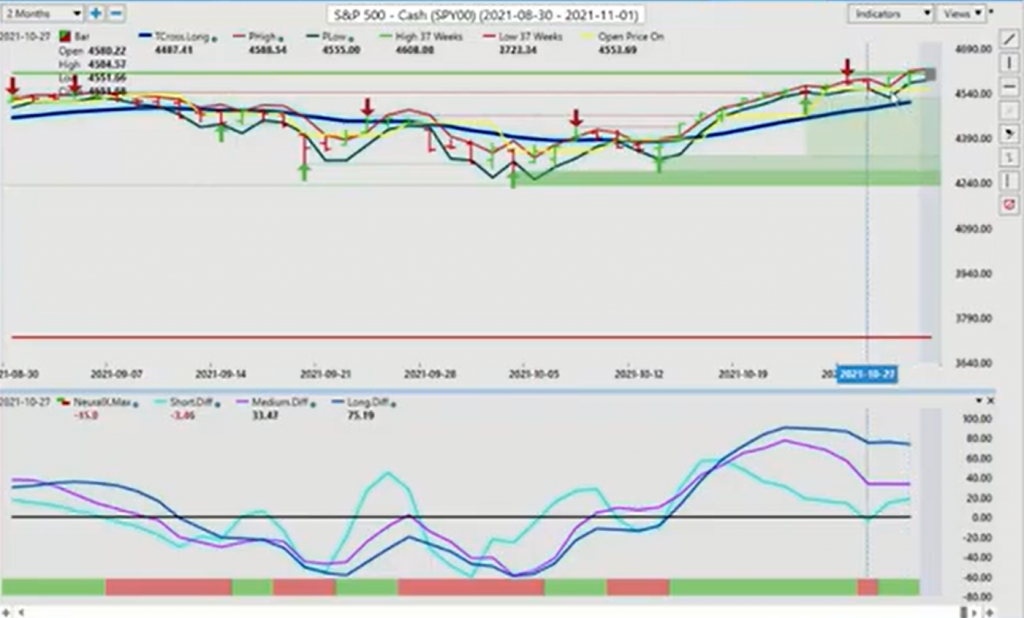
Now, when we look at that on a comparative analysis to the equity markets, the equity markets, again, this shows the power of the VantagePoint predicted highs and predicted lows. But once again, we’re getting very, very toppy up here, in my respectful opinion. These predicted differences are telling me that the strength of the equity market is not as strong as what some people are leading us to believe. When we use AI technology to measure that strength of a medium-term trend, a short-term trend, and a long-term trend, they’re flattening out here, which tells me that next week may not be a great week for equity markets. But the level that we would be watching here is, once again looking at that 37-week lookback at 4608, we need to get above this and stay above this if this is going to be a new trend. But in most cases, whenever a market puts in a new high for the year, usually a substantial retracement follows. So be very, very cautious buying up here.
But once again, when we look at our T cross long, 4510 is our major support level, in my respectful opinion. Using the VantagePoint software for some 22 years now, the further the market moves away from that T cross long, the more likely it has a retracement back to it, which has absolutely nothing to do with waves or Fibonacci or any of this. Like a moth to a flame, it’s drawn to these predicted moving averages. So again, we will be continuing to watch to see if the Neural Index turns red, but right now it appears imminent going into next week.
Crude Oil
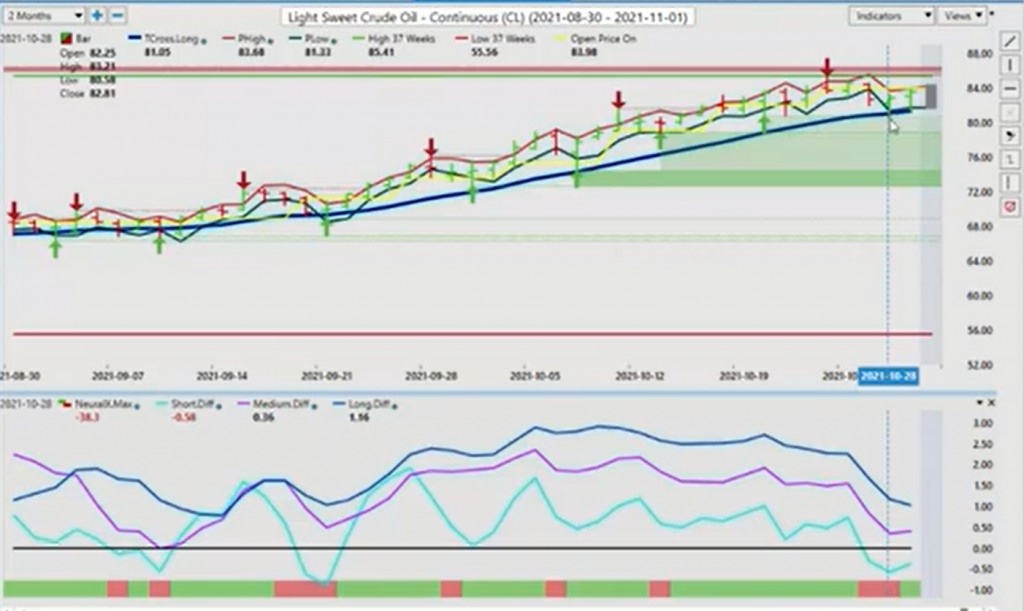
Now, as we look at oil prices again, and the energy sector still remains very hot, you can see that we’re holding two days in a row along the VantagePoint T cross long. When you add a predicted moving average as a pivot area with the predicted highs and predicted lows, it gives you a focus point in the market to say, okay, where is my line in the sand for stop losses, for buybacks for all of these things? So right now, our line in the sand for oil is clearly identified at 81. 34 using the T cross long, the only predicted moving average I’m using this week because we’re going into such a volatile week.
There are many methodologies that can be used with The VantagePoint software. None are completely right, none are completely wrong. It’s building strategies using the AI technology. So again, when I look at that pivot area, that’s coming in at 81.34. If I’m a buyer, that’s where it’s going to be. The predicted low for money, it’s coming in at 81.72. So we have all of our support sitting there. And again, this presentation is being done at Sunday morning, you can see on my clock right here, at 10:50 a.m. on October 31st. Happy Halloween, by the way, guys. But that’s where we’re doing this all ahead of the market. Before it even opens, we know the exact level where we would consider buying this from using this technology. So again, a bit of a concern that I have here is that short-term trend is slipping below the zero line we’ve been following. But this is telling me that it’s likely that this is simply a retracement. It’s only a new trend here, guys, when we close below this T cross long for, in my respectful opinion, two days in a row.
Bitcoin
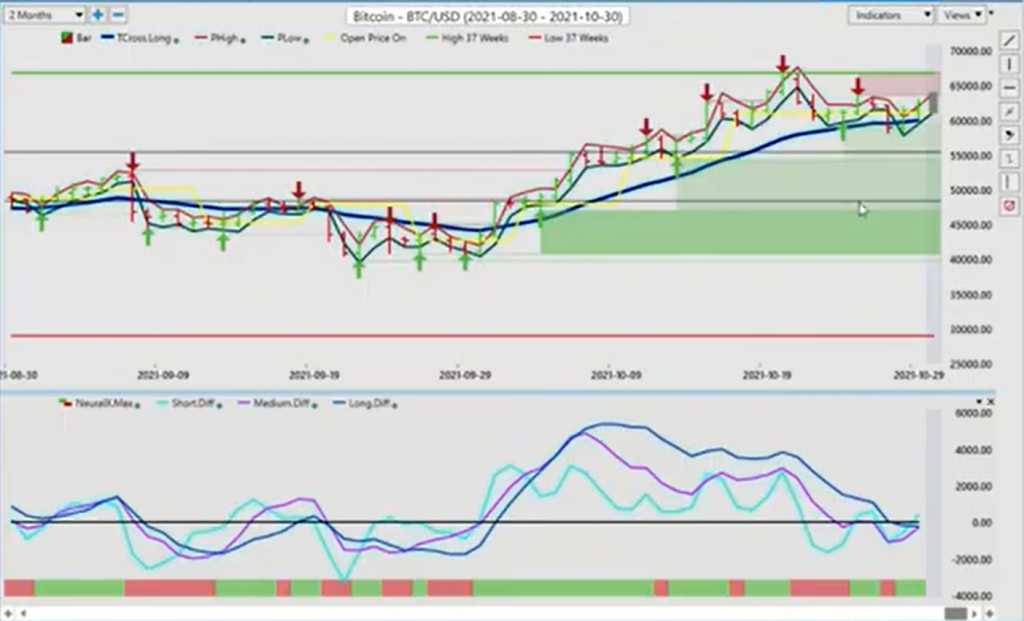
Now, Bitcoin markets and Ethereum all heating up here again. You can see once again the market in constant contact with that T cross long, this down at the 595 mark. We’re doing it again over the course of the weekend because, of course, Coinbase is trading over the weekend now. You can see that your VP software is updating this for today, 10/30/2021. So again, even over the course of the weekend, in yesterday’s trading, you can still see we’re in contact with this T cross long at 60034. And we’ve had some very, very nice moves off this particular area.
Now, as we slip down below the predicted low for the day, we had that backup support identified, again, using that T cross long by itself to say, okay, well, if I’m long down in this area, I’m not going to be overly concerned because I have a fresh buy signal forming here. Our medium-term trend is getting ready to cross over, or our medium-term crossover is strengthening. It’s coming back up to cross over the zero line. Our Neural Index has turned positive. But Bitcoin is always choppy on Monday and Tuesday, guys, because it’s been trading over the weekend. But right now, it appears imminent once again that Bitcoin is going to go and start trying to move back towards that 66000 mark, the all-time high for the year again.
Euro versus U.S. Dollar
Now, as we move in again to some of our main Forex to review some of our main Forex pairs, some very, very good selling on Euro/US this week. We’ve done this, again, in the VantagePoint Live Training Room. But once again, I want to draw everybody’s attention, so if you have a bad trade on Thursday, it’s not that you’re a bad trader. It’s not that VantagePoint’s forecasts were off a bit. It’s the market you’re dealing with. Profit taking, limit your trading on Thursday or just disregard Thursday altogether because the real price on gold did show itself on Friday. And after this nonsense in the currency markets, the commodity markets, the equity markets on Thursday, the markets reeling all over the place, the real price is still down. Gold is unable to break above its main resistance. And neither is the Euro.
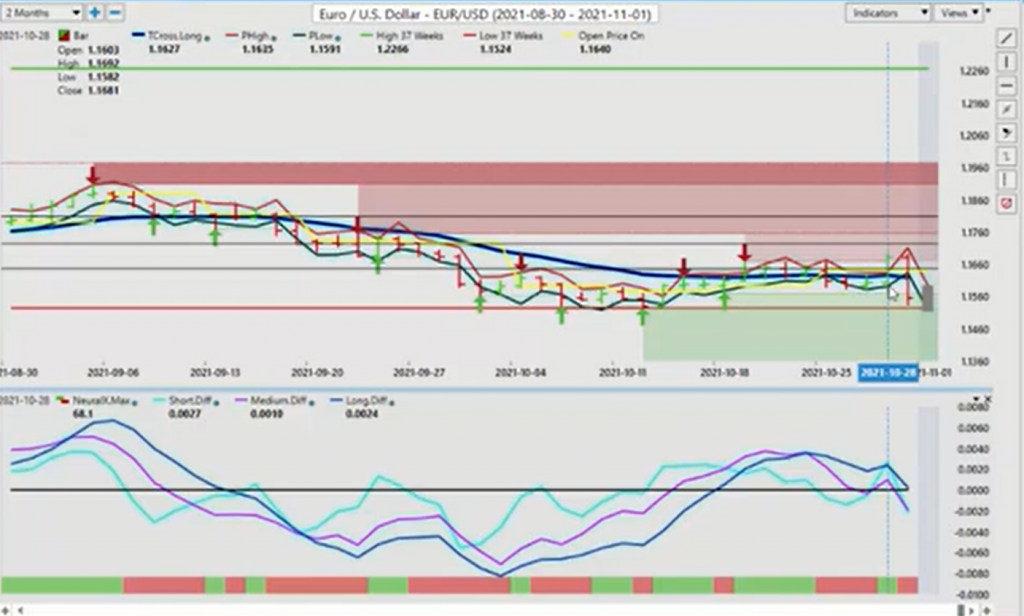
Again, this very stiff resistance at the 1.1670 mark, you can see that this is an absolute stop-loss hunt, nothing more on Thursday, only to turn around and get slammed lower by anybody that bought up above here. This is why I like to use a two-day rule, closing above or below that T cross long to get that kind of confirmation. But the predicted differences were dropping this whole time on Thursday. And it warned me that, look, this is a fake price here. We’ve got all of this resistance all the way up, that I would argue that the Euro is not a long trade until we get above 1.1755, 1.1730, that this is the area we want to watch. And if we can get above that, then maybe we’ve got some hope for the Euro currency, that it’s going to go higher.
But for now, it’s in a very, very firm down trend. You can see this entire week it’s been running below the weekly opening price. It only got up above there one day, on Thursday. When we opened trading on Friday, which would be 5:00 p.m. Thursday Eastern Standard Time in the currency markets, the immediate move, it was just slammed lower. So anybody buying that fake move, immediately stopped out. So for now, our medium-term crossover is strengthening to the downside, our long-term crossover is strengthening to the downside, all of which is pointing towards US dollar strength.
U.S. Dollar versus Swiss Franc
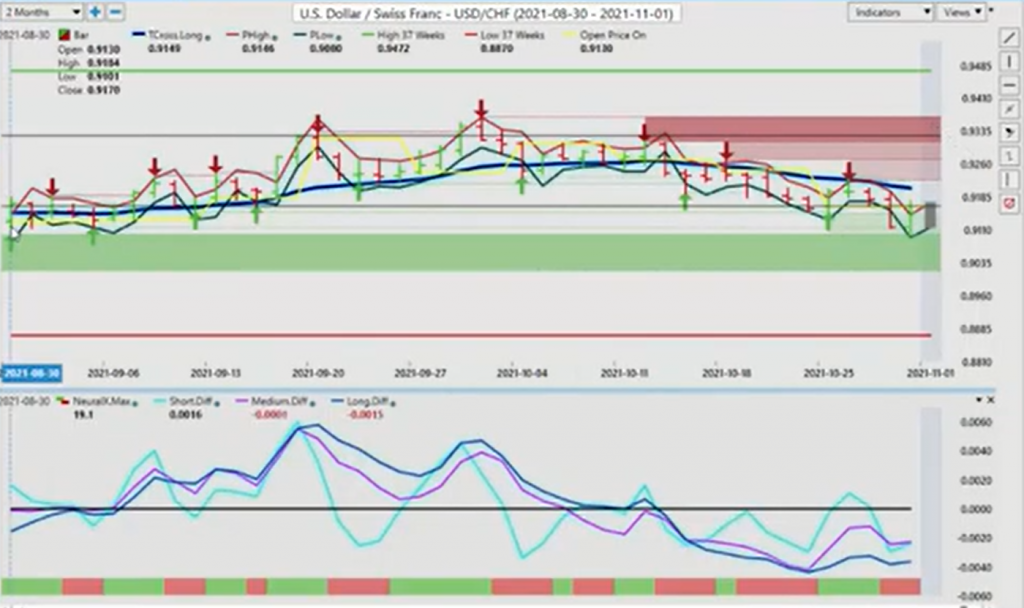
So if that’s the case, we would look at pairs like US/Swiss Franc. There could be some very good opportunity off the verified support low. That’s coming in at .9101. We can see that our predicted differences are starting to flatten out. So our medium-term trend, which has been to the downside, and you can see the retracements up to this area, but it’s losing momentum here. We are technically speaking oversold, but we don’t like to trade off overbought or oversold signals because we’re trying to tell the market to stop doing what it’s doing and go the other way. So we’re not going to do that. We’re looking at real technology here to say, okay, when that Neural Index turns green, that is likely going to set off a wave of buying here. So we’re going to be watching this level down here very, very closely.
Order flow traders, excuse me, will target just below the 91 level to do just what they did to you on Euro/US last week, to get you to bite above 1.1670, get it to go up to 1.17, and then slam it lower. The same thing in reverse is already happening on this pair. You can see this big move down on Thursday only to turn around and come roaring back on Friday. This is likely to continue with a retracement back to our T cross long to a minimum of .9205. If we can break above .9205, again another powerful tool to use is limit orders above the key VantagePoint level, putting a buy limit. If you disagree with everything I’ve said here, that’s fine. Then you can say, okay, well then I’m just going to stay out of this chop down here, and I’m going to put a buy limit order just above that T cross long at .9205. Because when it’s triggered, that’s likely going to be a bigger move to the upside with this current pair. But we want to wait for that confirmation from the Neural Index.
British Pound versus U.S. Dollar
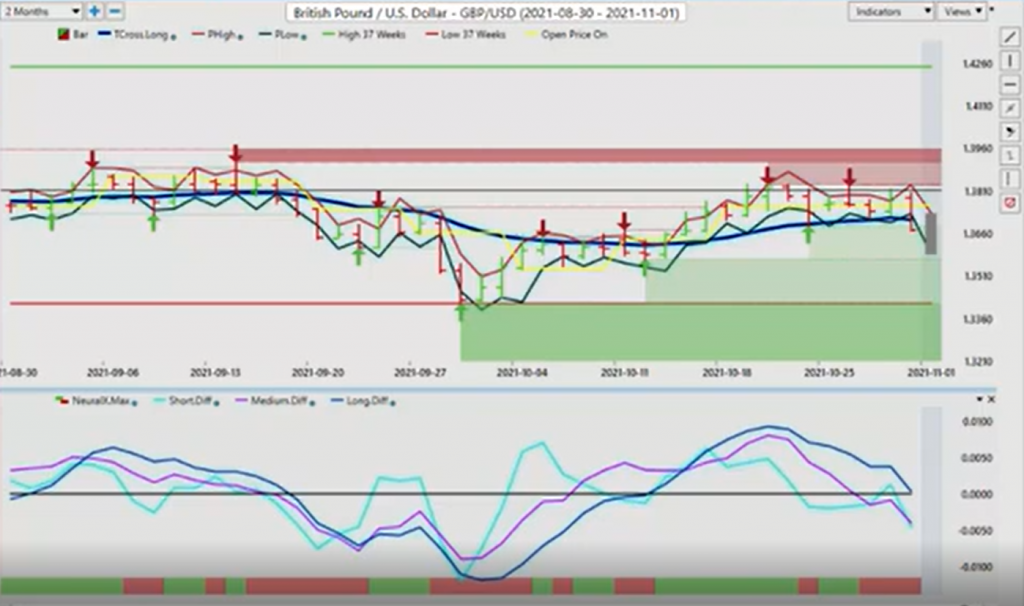
Now, with the British pound, there’s going to be no shortage of volatility this week. A lot of people believe that the UK, or the Bank of England is going to start talking about hiking here. I believe they might be also. So we could see a reversal on the pound. Be very careful. But for now, for at least Friday, we have closed below the T cross long 1.3709. But you can see the main resistance when we’re doing complete analysis, using those verified zones, the T cross long, the Neural Index, the predicted differences, all of them combined with that weekly opening price, then we get a better picture.
So when we look at the close from Friday, that’s 1.3673. The yearly opening price is 1.3644. If we start breaking down below here, then the pound’s going to be in real trouble. But I think the Bank of England is going to help the British pound out. So we would be focusing more down in the support level around 1.3569. I believe we will sell-off down to that level prior to the Bank of England, then we’ll see where the pound goes based around their statement. But again, watch that level very, very closely at that T cross long of 1.3709.
U.S. Dollar versus Japanese Yen
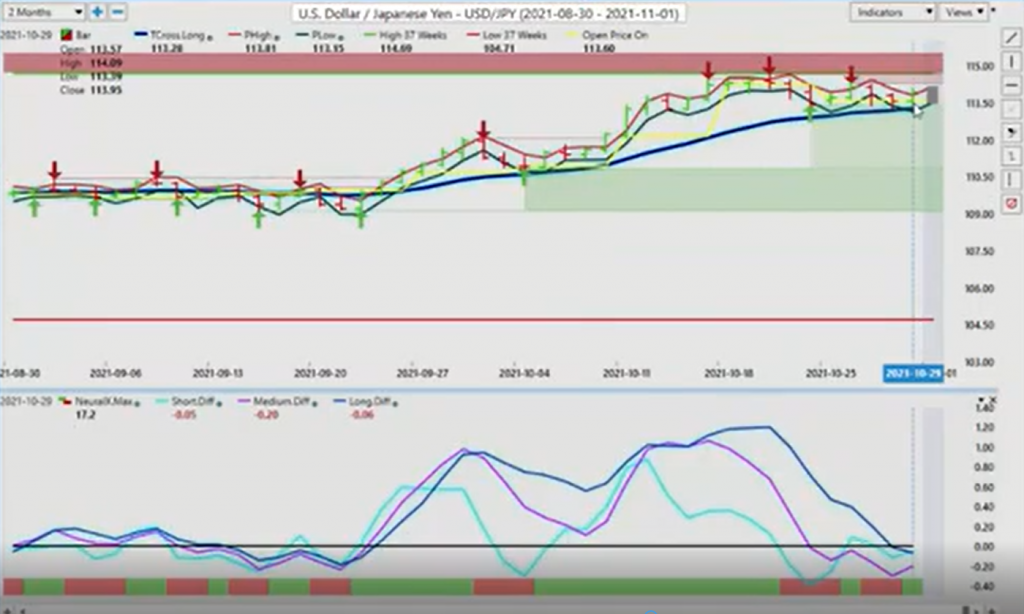
Now, when we look at the Dollar/Yen, the Dollar/Yen also coming roaring back as the market is anticipating a bigger sell-off. You can see that the VantagePoint software told us that that’s not what’s going on here. We have stalled two days in a row exactly on the T cross long. That’s at 113.28. That’s our focus point to start the week. When we look at our predicted low starting on Friday, or on Monday’s trading, excuse me, we’ve got 113.50. So the way we would look at a trade setup like this is we would say, okay, we’ve got our Neural Index is green, predicted medium-term trend is starting to rise back up, meaning it’s crossing, getting ready to cross back over to the upside. This would tell us that, okay, well, we’ve got a major support level. We’ve got the VP predicted low. This is a pretty reasonable area to start looking at longs. But we do this ahead of the market.
Again, when we do all of this before it happens, then we can have some level, significant level, I would argue, of predictability. So right now, that level is our focus point around 113.39. And the T cross long, that is 113.28. So all of our orders would be right in this area with stops below that particular level to see if this developing trend or reversal back to the upside is in progress. I believe it could be. In the week of the nonfarm payroll number, Dollar/Yen is certainly a pair you want to keep your eye on.
U.S. Dollar versus Canadian Dollar
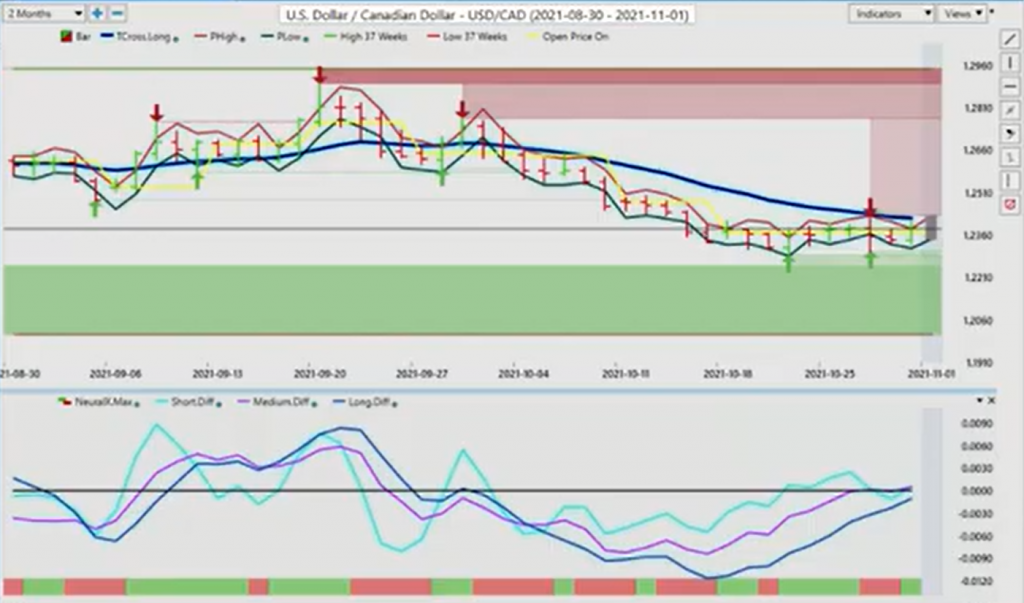
Now, with the US/CAD, the US/CAD is a funny animal this one. Energy prices are still very high. Equity markets are strong. This is what the CAD/Dollar feeds off of. The economic numbers out of Canada are a little bit mixed, but they’re okay. So right now, my concern with additional shorts here is that we continue to challenge the T cross long. We hit it right to the number on Wednesday and then fell right off. We went down again on Thursday. But you can see that that bar on Thursday, that the US/Canada wasn’t really affected by that big sell-off on the dollar on Thursday. It was actually flat. Then we look at Friday’s trading and it moved higher. So right now, we have a verified resistance high at 1.2431. And we have the VantagePoint predicted high at 1.2427. So if you still feel that the Canadian dollar is going to strengthen, which is a reasonable analysis, then this is where you would sell.
Now, if you are looking at this from the VP side, our predicted differences are rising. Our medium-term crossover, right here, that pink line is the strength of the medium-term crossover. And it’s just crossing right now. So if I click on my F7 in the software, what we can look at is we can say, okay, well, the blue line is right on top of the black line, but something is trying to form a signal here. It’s just struggling to do it. But if nothing else, it’s warning us that we could see pending US dollar strength and a bit, finally a bit of Canadian dollar weakness because it’s been, as you can see by the VantagePoint forecast it’s been very strong since September.
Now, if we’re looking at a potential buy signal, then we would focus down around the 1.23 level, which would be the verified support lows. We’ve got 1.2288, which is the really big support level, but we also have 1.23, which is a slightly higher low. So again, when we look at our blue line by itself, the long-term crossover, we’re looking for it to break free of this area. And if it can’t, then we are going lower. I believe there is a strong possibility that the US/CAD will move toward, will gravitate slowly towards the 1.20 level as we move towards year end. So again, there’s enough meat on the bone for buyers and sellers on this particular pair.
Australian Dollar versus U.S. Dollar
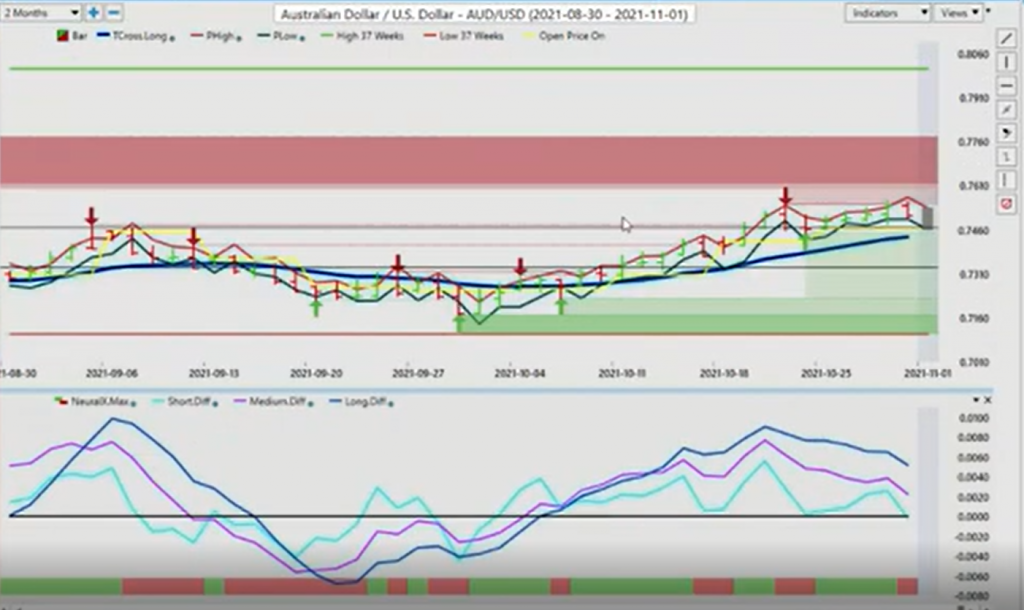
Now, with the main, the Asian currencies, the Aussie falls into this. Now, this is an interesting setup here because we’ve got a verified resistance high coming in at .7546. Even during that bout of dollar weakness on Thursday, the Aussie struggled to push above here, and then we sold off on Friday. I would view this as the real price on Friday. These predicted differences are falling. Our Neural Index has gone from green to red. This is pointing that if nothing else, we are going to have a corrective move lower to the T cross long.
That’s why using a setup like this can be far easier for some people because they can say, okay, well, I know exactly where my reversal point is going to be if we break down below .7437. The VantagePoint indicators are pointing lower, so I can sell down to this. And then I can consider buying it back at .7437. But either way, it would appear imminent that we’re either going to break down to that T cross long or if we can break free and clear. But these verified zones, they’re a very dark ominous cloud over the Aussie currency here. So shorts still carry a slight edge.
New Zealand Dollar versus U.S. Dollar
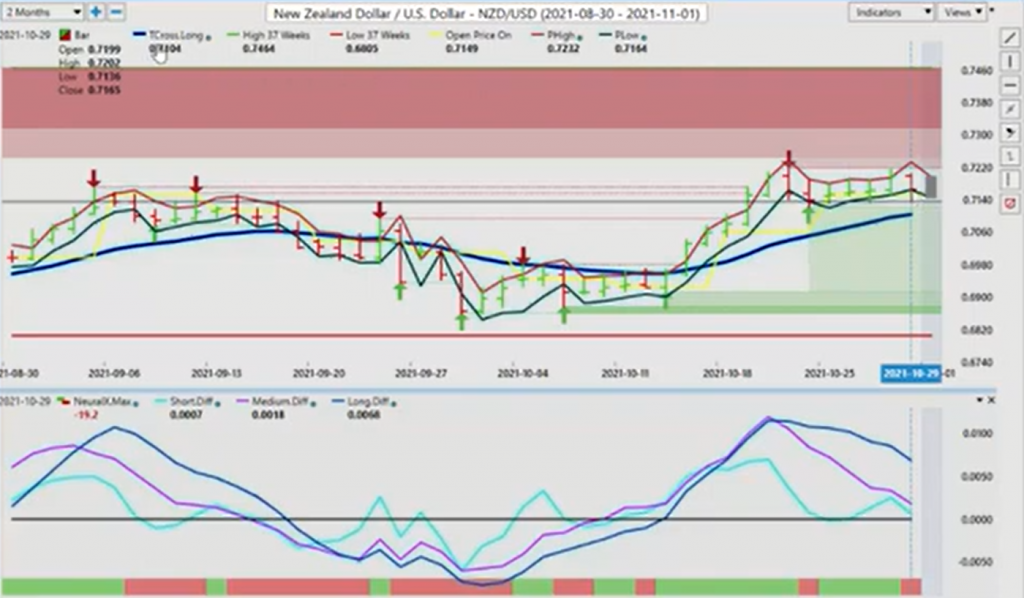
The same thing would apply to New Zealand here, guys. It’s very much a similar trade. But the New Zealand right now, our T cross long is .7104. We’re closing out the week here at .7165. So in my respectful opinion, based around, and again I will point out here the power of the MA diff, so what we would do is we would look at this and we would say, okay, we have the medium-term trend is weakening against the long-term trend, so we’re not focused only on one crossover. We’re looking at multiple crossovers. The short-term crossover is the blue line. The pink line is the medium term. And the blue line is the long-term crossover. So the short-term crossover goes first. Then the medium term crosses down. So this is looking like that New Zealand is getting ready to come under some selling pressure here because we’re unable to break above that verified high at .7218.
So we know exactly where our resistance is to start the week. We know exactly where our support is to start the week. And we have a clear indication from VantagePoint that the biased is lower. For equity traders that are watching this presentation, this could be a leading indicator that the S&P 500 is getting ready to correct lower, not necessarily a reversal here, but it’s potentially getting ready to correct lower. So a very, very volatile week ahead here, guys. But if we know our levels, then we can all be successful.
So with that said, this is the VantagePoint AI Market Outlook for the week of November 1, 2021


