


Welcome to the Artificial Intelligence Outlook for Forex trading.
VIDEO TRANSCRIPT
Hello, everyone. And welcome back. My name is Greg Firman. And this is the VantagePoint AI Market Outlook for the week of May 16, 2022.
U.S. Dollar Index
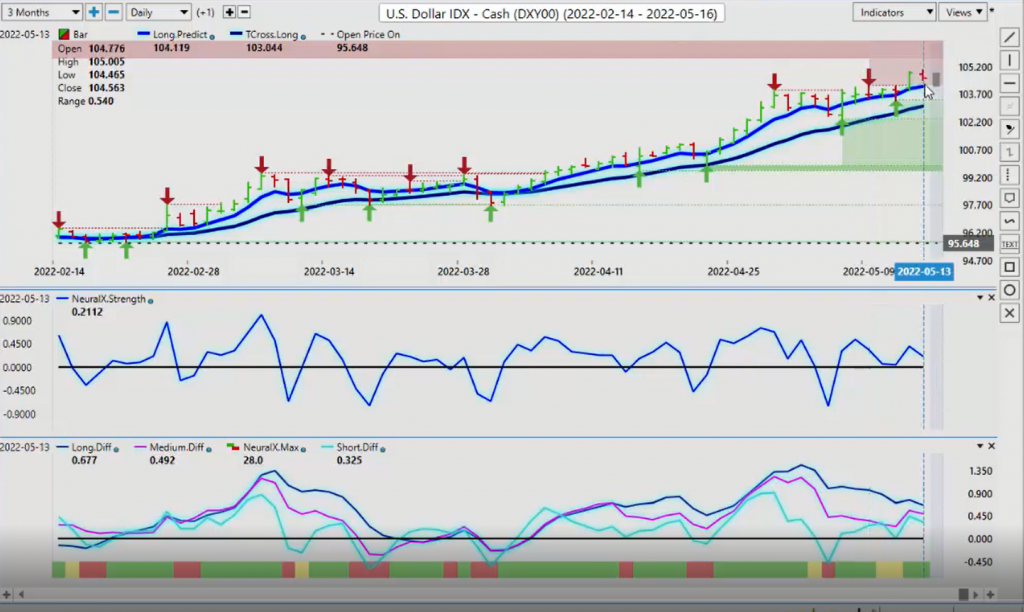
Now, to get started this week, we’re going to begin where we always do with that very important U.S. Dollar Index. Now, we’re going to look at things a little bit differently, but first and foremost, we’ll identify our key support levels for the dollar using the long predicted 104.11 and the T cross long at 103.04. As long as the market continues to hold above these levels, then the dollar would still show signs of additional strength. My optimism on that, however, remains heavily guarded for a number of reasons.
Our predicted difference here, our predicted short, medium, and long-term differences are falling. They’re pointing downward. We’ve got a reverse check mark on our Neural Index Strength. But again, the dollar is being pushed higher largely by Fed comments. But in my respectful opinion only, Jay Powell is not a hawk; he’s a dove. So again, at any time, the dollar could slip here because nothing goes straight up and nothing goes straight down, and that’s what the dollar’s been doing. Now, there’s a known seasonality with dollar buying that usually ends around May 16th, so we’ll see if that comes to fruition.
But what I’ll show you here is one of the ways I gauge, an alternative way to gauge U.S. dollar strength and weakness. Now, in this particular case, I’m using the MGA stock, the Magna stock, I believe a Canadian company. So when I look at the Magna stock and I look at it on a year-over-year basis, we can see that there’s an 87.68% inverse correlation that this particular stock has to the Dollar Index. So if I break that down and I look at this, I can say, well, hey, I’ve got a very strong verified support low on this particular stock that we came close to right here on Thursday and then immediately turned back up. Now we’ve closed above the T cross long at 59.89. So I would respectfully submit that I do have a buy signal on this stock. The MA diff is crossed and my Neural Index is up. Neural Index Strength is pointing higher. All of this is saying that if this stock goes higher and it’s 87% inversely correlated, that means the dollar is getting ready to move lower. That’s the way I would view that.
So again, just an additional trick that we can look at using the artificial intelligence to predict the markets, not talk about something that’s already happened, which a lot of indicators do. So again, looking at that Magna stock, it would be very interesting to see does that indirectly point that we could be having some strength coming in the stock market? Well, that seems to be a very difficult task at this particular time in the bear market that we’re in with stocks. But again, when we look at using those stocks to gauge the Dollar Index, there’s little, if no systems out there that do that.
So again, if you’re a forex trader or you’re a stock trader, keep an eye on that Magna stock to see if it continues to advance because if it does, there’s an 87.5% chance the dollar will move lower. If that does come to fruition, the first thing we would see is a breakdown below 104.11. We would then be looking to come down and retest, which we haven’t done for a few weeks here, down at the T cross long at 103.4. If we close below 103.4, then the dollar is likely getting ready to take a significant pause in this grossly overextended rally.
Bitcoin
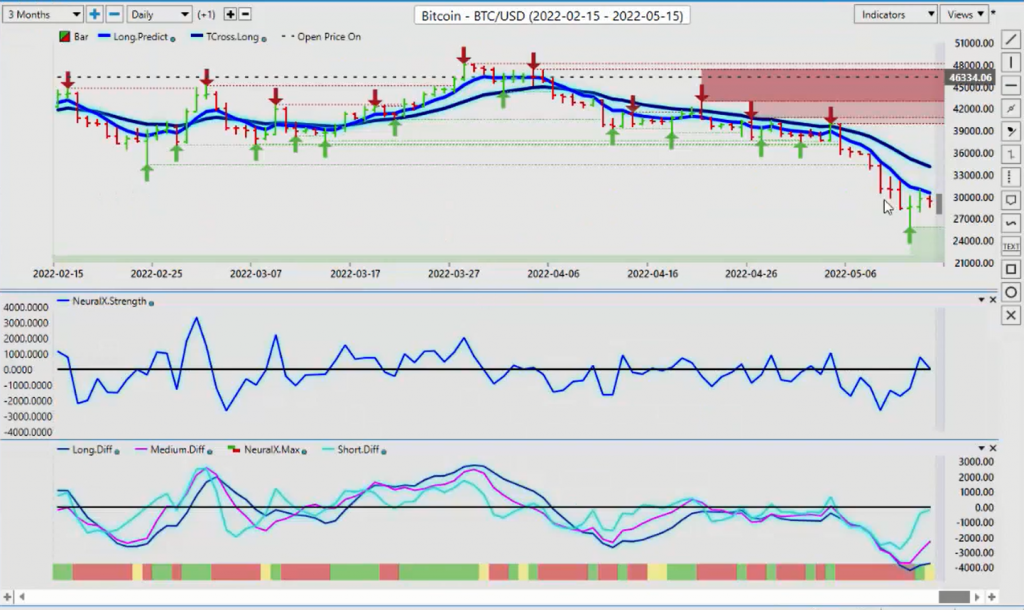
Now, I want to make sure I hit Bitcoin this week, guys. I apologize. I must have missed it last week. Everybody makes mistakes including me. So Bitcoin appears to be pausing out down here. Now this is very, very similar, guys. When we hear all the things we’re talking about with Bitcoin this, Bitcoin that, we’re basically, I think I do need to point it out because these talking heads on CNBC and Bloomberg, this is exactly where we were last year with Bitcoin, guys. So yes, it’s bearish on the year, but Bitcoin follows the NASDAQ and the S&P 500. It just moves faster.
But once again, when we look at this from last year, 29,500 from basically July of last year all the way up into, I would argue into November. This is one of my favorite times to buy Bitcoin. But I also buy Bitcoin usually pretty heavily around this. So if we use this in a form of a seasonal pattern, we can see that Bitcoin is weak. But wasn’t it weak last year at exactly the same time up until about July? So we’ll probably see more downside with Bitcoin, but if we get any kind of reversal on stocks, Bitcoin will immediately follow.
Now, the medium-term predicted difference and the long-term predicted difference are starting to rise. The Neural Index is going from red to green to yellow. So something is going on here, guys. Keep a very close eye on this. But for this week, we’re going to use our low of 25,919 as our support level. And I would respectfully submit, we have a good chance of retesting the T cross long at 34,061 if, and only if we can clear the long predicted at 30,467.
Crude Oil
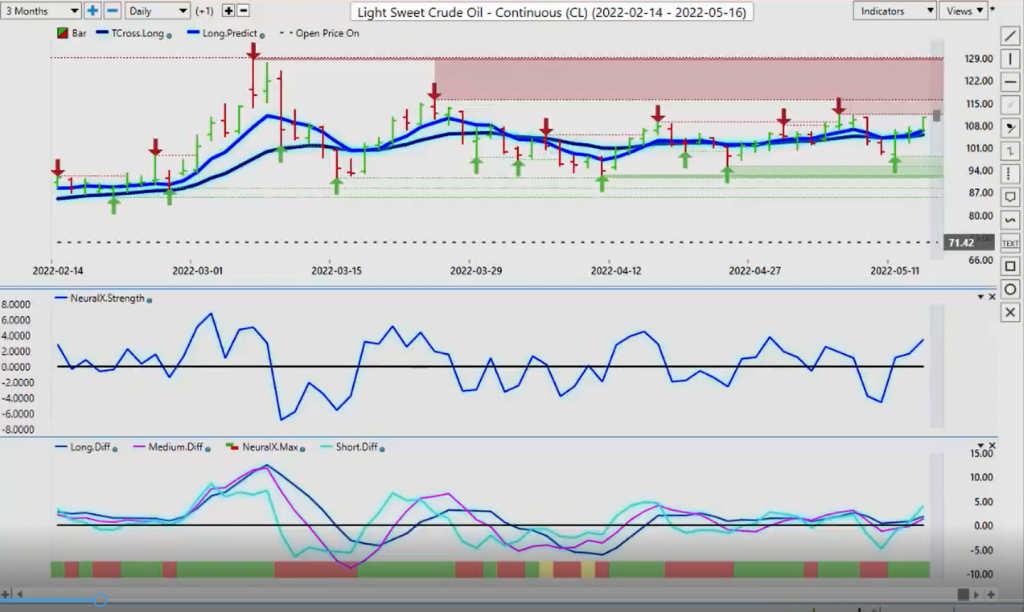
Now, with light sweet crude oil, once again, very, very toppy, not a lot of buyers up here. I think globally, we have all just about had enough of these oil companies. In Canada now, believe it or not, here, guys, we’re over $2 a liter. Craziness. Diesel at 2.60 a liter in Canada. So again, I think the masses are about to revolt here personally. And there’s going to be some inquest into these oil companies, see what’s going on. Governments are going to be forced to remove some of the taxes maybe.
But again, we still do have our Neural Index Strength above the zero line. Predicted differences are recovering. But we must, must clear 111. And even if we do clear 111, we have formable resistance up here at the high of 116, where again, it’s very difficult when you look at the start of COVID back in March of 2020, oil hitting 30, 15, $10 a barrel. We’ve gone from $10 a barrel all the way up to where we are now. So again, I think as the global supply chains start to contract a little bit, or we start to improve these, I should say, these supply chains, we should see oil back off here a bit.
But again, we still have buyers and VantagePoint is still forecasting, even though I don’t agree. VantagePoint has been correct. If somebody told me six months ago that oil was going to be at $120 a barrel, I would’ve said you’re crazy. That’s just not happening. But it did. And it continues to see buyers.
S&P 500 Index
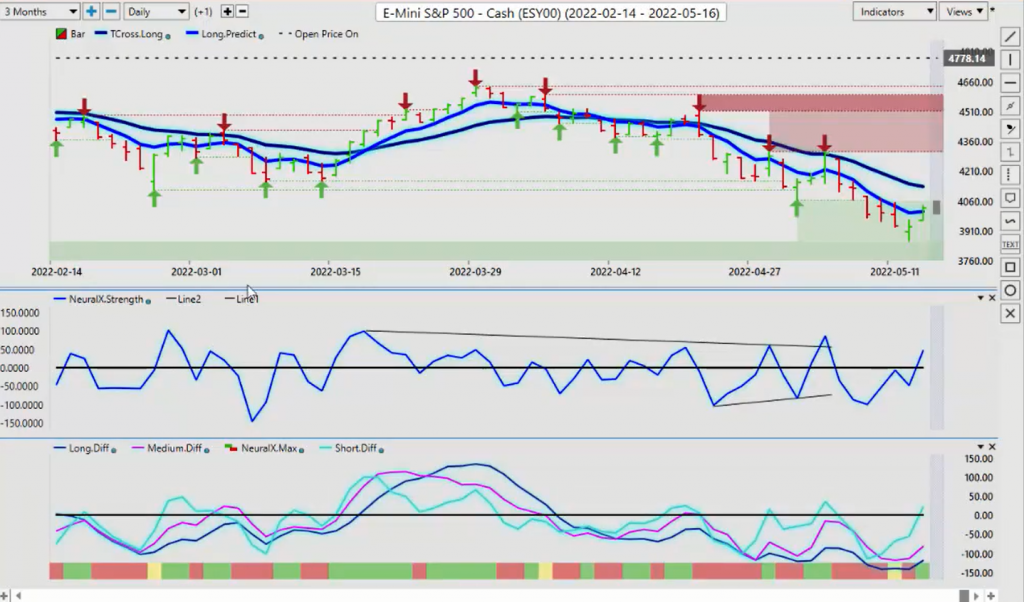
Now, with the S&P 500, we can see a very similar pattern here with the S&P 500 that, again, we see on Bitcoin. So when we’re looking at it right now, we could have some good support forming at 38, 38, 3,858, excuse me. So again, if we look at this, we’re going to go back and this is a very quick, easy way to check for seasonal patterns, right? So we can see that actually, well, just like Bitcoin, low and behold, we’re not really that far off of last year’s price are we? So obviously, there’s a seasonality, a potential seasonality at play at this particular low. So for this particular week, I would keep a very, very close eye on the 4,061 mark. If at the end of next week, we can close above that level, then, hey, maybe we’ve got a recovery. Maybe not a new up trend here, guys, let me be clear about that, because this is not the same type of year.
And one of the ways that I will gauge the stock market is the real estate market. The real estate investment trusts, all those kind of things, and they’re not doing well. The real estate market in Canada basically stalling out here. I would argue maybe even going flat a bit. So a very, very hot, hot real estate market. Well, that’s changed considerably in a matter of weeks here with these interest rates. So we’ll continue to monitor this. But again, we can see that on May 19, 2021, we were at a low of 4,061 and we’re really not that far off where we were last year. And that was basically the end of the move down. And then it started to go up.
So we’ll watch these, but the main thing here, guys, like I always say, know your levels. If you know your levels, then we can see that there’s a crack in the dam on the downside right there. Closing above the long predicted, that brings 4132 into play potentially here. So if the stock market has a big sell-off on Monday, what I’ve talked about at the seminars, what I’ve talked about in the VantagePoint Live Training Room, Monday is very often a fake price. So if you have a big move down on stocks on Monday, you may want to look at potential longs here because there may be something to it.
Euro versus U.S. Dollar
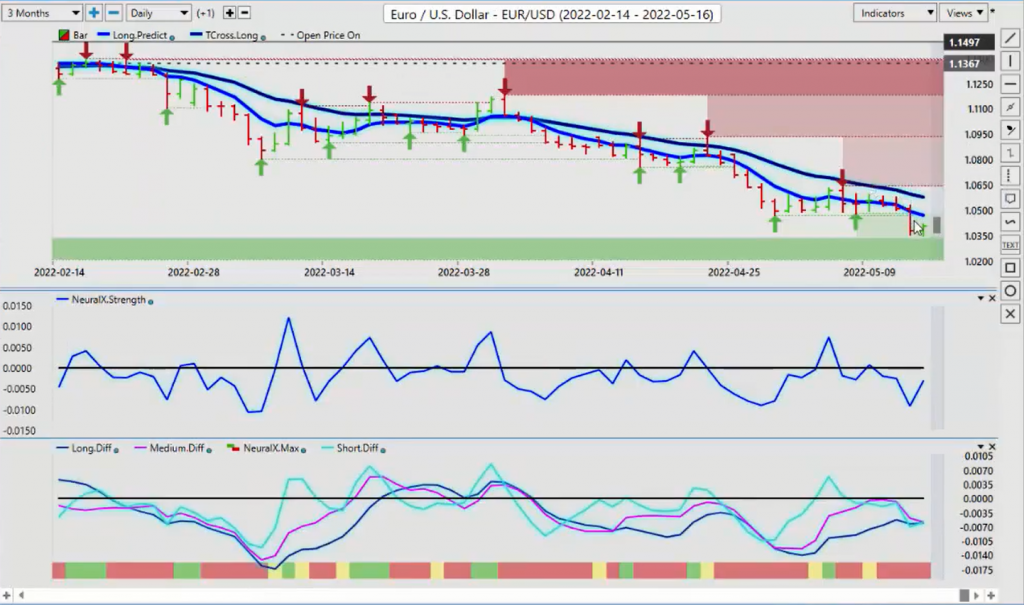
Now going into our main forex pairs, starting with the Euro/U.S. pair, the Euro took a beating here, but only in one day of the trading week here. There is very significant support below 1.04 here, guys, 1.0340, 1.0320. I suspect that the longs are gearing up potentially. If that seasonality in the Dollar Index is true and the dollar starts to lose steam in the month of May, then the Euro will see some kind of strength.
So again, a big sell-off on Thursday. Thursday is a profit-taking day, guys. It’s not a true price. And you can see on Friday, we turn around and recover somewhat. Still, a very bearish close. I would not disagree with that at all. But again, when we look at the indicators, the Neural Index here is red. But the Neural Index Strength is pointing straight up. So again, if we can get that Neural Index Strength above the zero line, we get our Neural Index turning green. But once again, we’ll look at those main pivot points because again, this is an outlook guys, not a recap of something that already happened. These are key levels going into next week’s trading. 1.0474, that’s the first level. If the Euro is going to turn bullish at some part in the month of May, at some time in the month of May, we first must clear that level. Then we would target 1.0581.
Now, for people that don’t want to fight the trend here and stay short, then you would sell into those levels, or the alternative is we can put limit buy orders just above 1.0581, or for that matter, just above the VantagePoint long predicted. Now, if we combine that at 1.0456, we’ve got our long predicted at 1.0474, then very easily we can pinpoint where we would enter a short on Monday. But again, be very, very cautious based on what I’ve said right now because there is still that possibility of a reversal higher because, again, the dollar trade is very, very crowded. Okay.
U.S. Dollar versus Swiss Franc
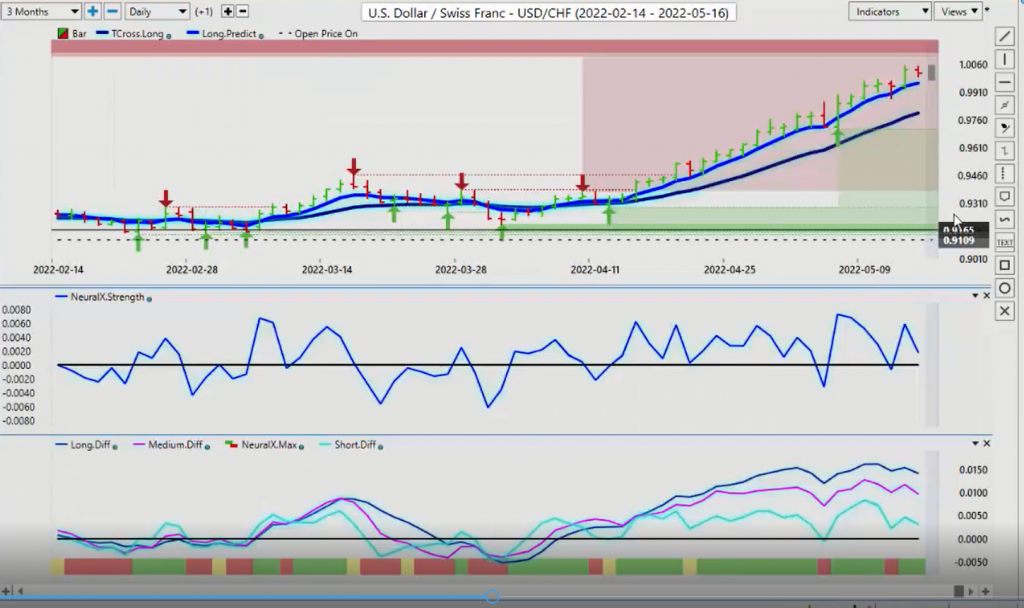
Now, when we look at the pound/dollar, we can also look at the U.S./Swiss franc, but the two pairs that I’m tending to stay away from is dollar/yen and U.S./ Swiss franc because it’s turned into a carry trade, a one-way carry trade. And a one-way carry trade, I’ve been in these markets 25, 30 years, when they come unwound, they come unwound very, very quickly. So be cautious with this.
I’m not saying it’s going lower. I’m just giving a warning that if there is any talk from the Fed that they are not hiking 50 basis points and they may only hike .25 or maybe they won’t hike at all in the months ahead, then this long trade on dollar/yen and U.S./Swiss they come unwound very, very quickly. And as you can see, our predicted differences are pointing down. Our Neural Index Strength is pointing down. So a corrective move lower on some dollar weakness, potentially down into the .9956 or .9795 area is likely. But again, with that carry trade in play, meaning sub-zero interest rates with the Swiss franc and higher interest rates with the U.S., then it clearly favors the U.S.
British Pound versus U.S. Dollar
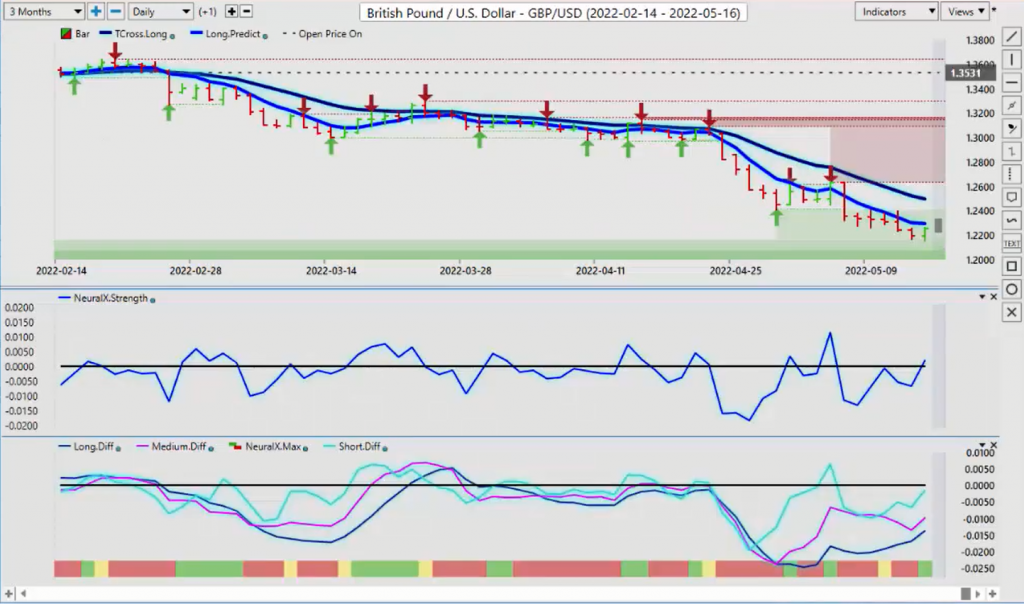
Now, the monthly pattern on the pound/dollar, I get a lot of questions about this. And the monthly seasonal pattern, the seasonal tools that I use, they forewarn me that there’s basically 80% bearish. In the month of May over the last five years, the pound/dollar has dropped 2, 3, 4% many times over the last five years. So again, this is not an uncommon thing.
So right now, we’re looking for a potential turnaround on the pound. I don’t believe we will see that until the 1.26, 1.2060 level. But we do have some support down here also right around where we’re closing, around this 1.2130. So again, a quick check, very quick way to look at a pattern here. You can see that the pound/dollar predominantly doesn’t do overly well until we get over into this area here. But once again, it is showing that there is some pending strength.
But once again, there’s a lot of strikes against the pound right now. They’re talking a potential recession now. A lot of problems are surfacing here. So my view is that we still could see further downside around the 4% mark on the month. That would take us down to about 1.2060. But again, watch and see if we can close and clear 1.2294. That would open the door to the T cross long at 1.2497. The indicators, the predicted differences are rising. We’ve got a positive Neural Index and our Neural Index Strength is clearing the zero line. So it is showing the potential for some strength.
U.S. Dollar versus Japanese Yen
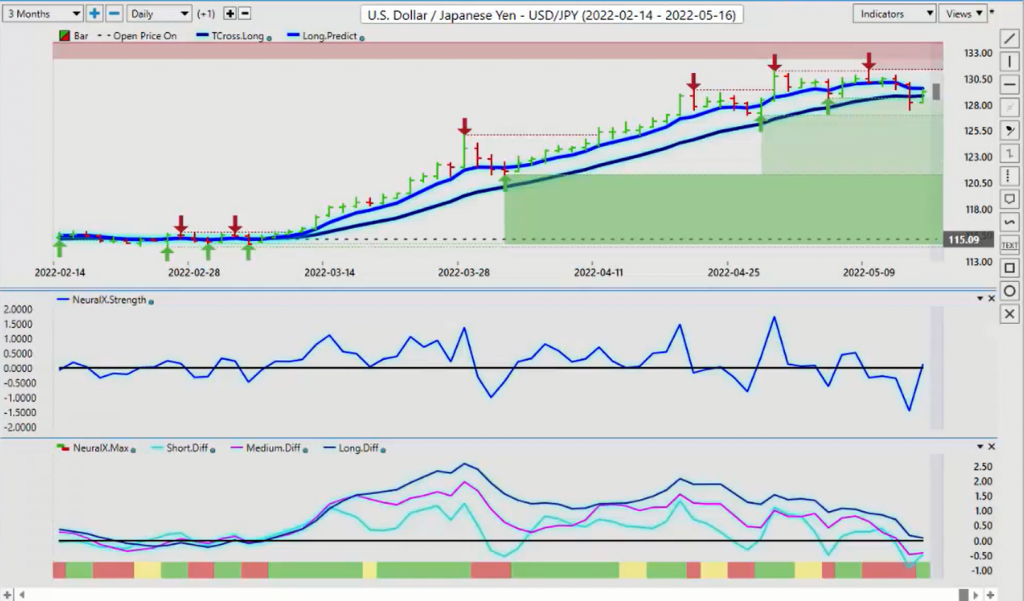
Now, when we look at the… Again, going into the dollar/yen, understanding that the dollar/yen is essentially nothing more than, it’s the same trade as the U.S./Swiss franc. But if you’re going to go along here, guys, I would be leaning towards U.S./Swiss franc. This is grossly overvalued at these levels. And I don’t anticipate that we would stay up here because if we ask ourselves one question, how many times has central bank intervention actually worked? I can’t even think of one to be perfectly honest. And indirectly, the Bank of Japan did kind of interfere when they said that they were going to protect the 100 level. And that sent the dollar/yen higher, up to around the 1.07, 1.08 area. Then you have the Fed coming in and the Fed getting all hawkish. Next thing you know, we’re at 1.30 on the dollar/yen. I haven’t seen these levels in many, many years, guys.
So once again, any kind of dollar weakness will show up here. But we’re struggling on that T cross long at 1.2885. So what I would respectfully submit here is that if we lose 1.2885 and we close below that level for two days in a row, this upside in the dollar/yen is getting ready to take a pause, and we are likely to pull back into these lower support zones, probably at least down into the 1.20 area. So keep an eye out for a possibly a very, very good short here. But again, you’re fighting those interest rates. But the Fed, one dovish comment from Jay Powell and next thing you know this thing is in free fall. So be very cautious with it.
U.S. Dollar versus Canadian Dollar
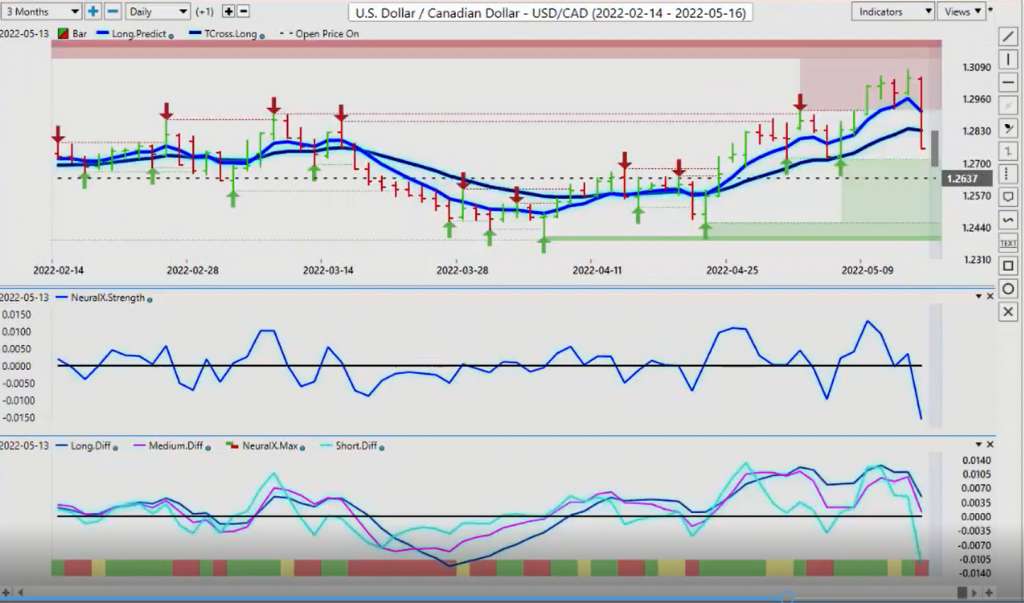
Now, with the U.S. Canadian pair, once again, a massive reversal, which I talked about on the Weekly Outlook here. This pair, it drives people nuts. Now, first and foremost, I want to point out that I use Barchart data and TradersOnly also, but that price, as far as I know, is wrong, that closing price at 1.2759. So I will submit a ticket to VantagePoint and to Barchart because it’s not just the TradersOnly, the Barchart data is wrong too. Unless something happened here after the bell, but my live trading platforms, excuse me, they do not show a closing price of 1.2759. So anybody using the VP software or Barchart data, because again, this is not isolated just to VantagePoint. So be careful, that’s not the true price. We did not break down below the T cross long. That did not happen here, guys. Okay? 1.2832 is the T cross long. 1.2909, that is where we actually closed, at least that’s what my platforms say. So 1.2909.
But again, what I do want to point out is this Monday, Tuesday, Wednesday reversal. U.S./Canada starts the week bullish and you can see that it’s a setup. It’s a total setup every single week. There is massive resistance at the 1.3059 level. Be very cautious buying anywhere near that level. That’s your monthly percentage. What it usually does in the month of May is around 1.62%, or that would equate based around the monthly opening price to about 1.3059. So be careful up there. There’s good two-way trading on this pair. Both longs and shorts worked all week. In my respectful opinion, shorts carry a slight edge here. But because that bar is off that… There was a big move down on Friday, don’t get me wrong. But in my respectful opinion, it stopped based at around the 1.29 area. It didn’t go below 1.29. So I will see what happens. I’ll get a ticket on that with Barchart, see if we can get that cleaned up.
Australian Dollar versus U.S. Dollar
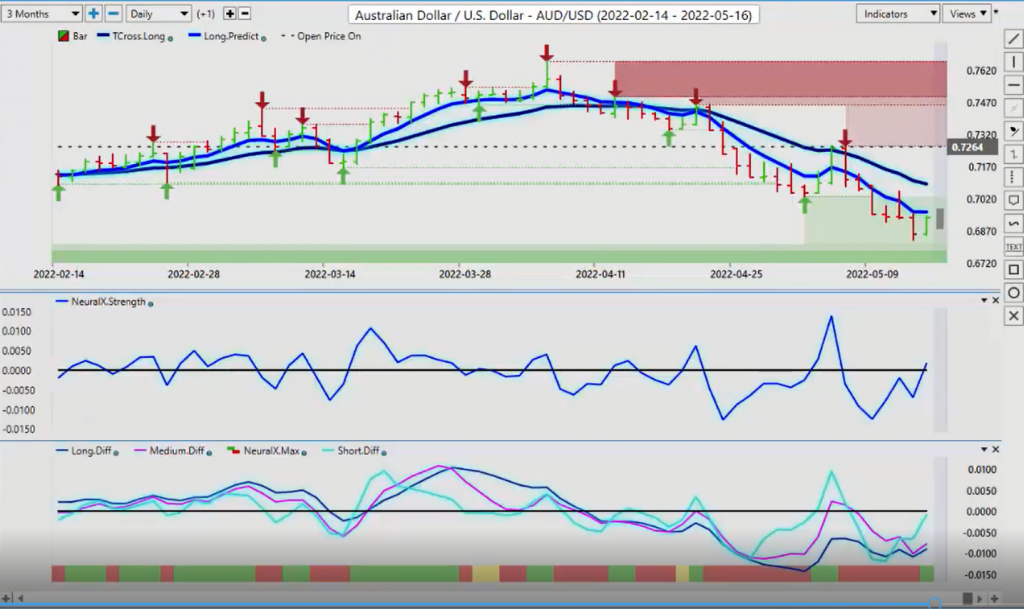
Now, with the Aussie going into next week, if the Canadian dollar breaks, truly breaks down below the T cross long, then the Aussie is going to break higher. The New Zealand is going to break higher. What we’re looking for is some strength in the stock market. If the stock, if we get into a little bit of a risk-on environment, that’ll help the Kiwi. That’s going to help the Aussie. And it’s going to help the CAD. All three of them are trading in relation to the S&P 500, and Bitcoin for that matter.
So right now, we can see we’ve got a low on the Aussie. That’s coming in at about .6869. We’ve made our move to the downside for the month, so now we have to see if we can start retracing back towards the yearly opening price. But again, the first level we have to overtake .6959. Then we’re going to target the .7090 area. That’s providing that there is no more problems, or little problems with Russia, Ukraine. We get a slightly more dovish Fed, that also in turn will help the Kiwi.
New Zealand Dollar versus U.S. Dollar
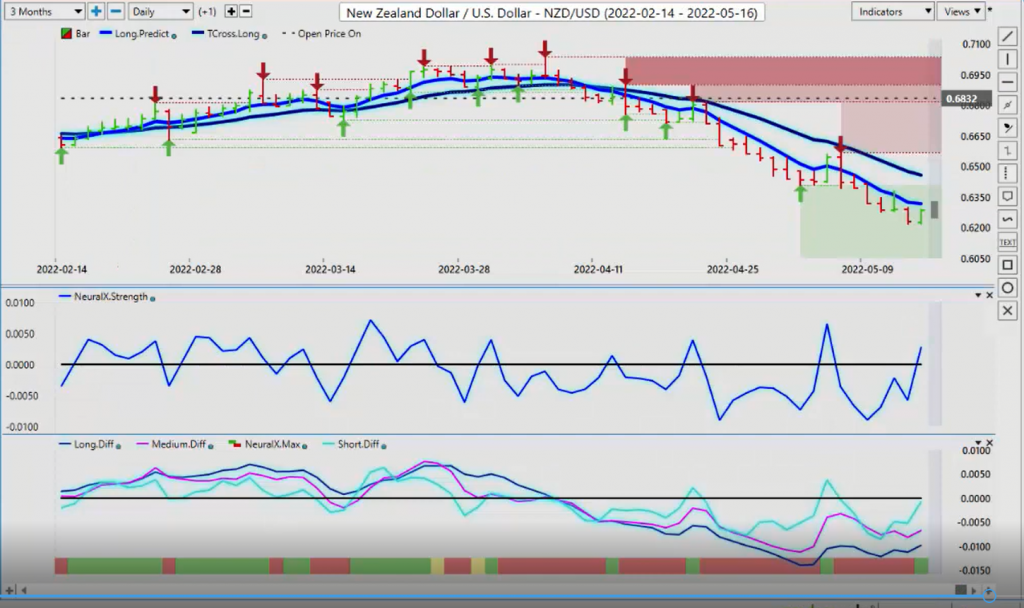
Now, if you don’t want to trade Aussie/U.S. long or short or New Zealand/U.S. long or short, then go to Aussie/New Zealand. That’s a good cross bear that’s had some very good action this month, actually. VantagePoint’s forecasted it quite well. You can see back here as we started into the month of May, we had a very bullish move on this particular pair, substantial move, actually. So right now, we’re sitting here holding, bouncing off of that T cross long. But if we break down below the T cross long on this particular pair, then it will be Aussie/U.S. that is a little slower to move higher and it will actually be New Zealand/U.S. that goes up. That’s how these cross pairs work. So we have some very interesting setups to begin the week, but with those setups absolutely we will have some opportunity.
So with that said, this is the VantagePoint AI Market Outlook for the week of May 16, 202…


