


Welcome to the Artificial Intelligence Outlook for Forex trading.
VIDEO TRANSCRIPT
Hello, everyone. Welcome back. My name is Greg Firman, and this is the Vantage Point AI Market Outlook for the week of March the seventh, 2022. Now to get started this week, the indicators we’re going to be using in our trade setup, I’ll bring this up so everybody can see, we’re using bars, not candle. We have our long-term crossover, our long-term predicted difference, medium-term predicted difference, our neural index. Neural index strength, a very interesting indicator. Our point in time set to the yearly opening price. Our short-term predicted difference in our triple EMA cross. And of course, I’ve modified the triple EMA cross to deal with the current market volatility by removing the short and the medium-term and focusing along the T cross long. We also will be using the very popular verified support and resistance zones.
U.S. Dollar Index
So when we get started here this week, the dollar making a very strong rally. Now, again, this is part of a very strong seasonality that usually lasts until about the end of March, beginning of April. So again, the dollar could be, to some degree, on borrowed time here. We do have the ECB coming out with interest rates. We’ll talk about that in a minute, but the main thing we want to do is follow the predicted moving average. Now, as you can see, I’ve modified these, and I’m using the T cross long, the yearly opening price, and the long predicted. Now the dollar index riding along the long predicted this entire week, not even getting down to the T cross long. So again, an excellent entry point here is using that predicted moving average by itself, we have the neural indexes positive, but more importantly, we have the neural index strength going back here, pointing up, crossing above the zero line. But the slope of this neural index strength is very, very important, but again, pointing higher.
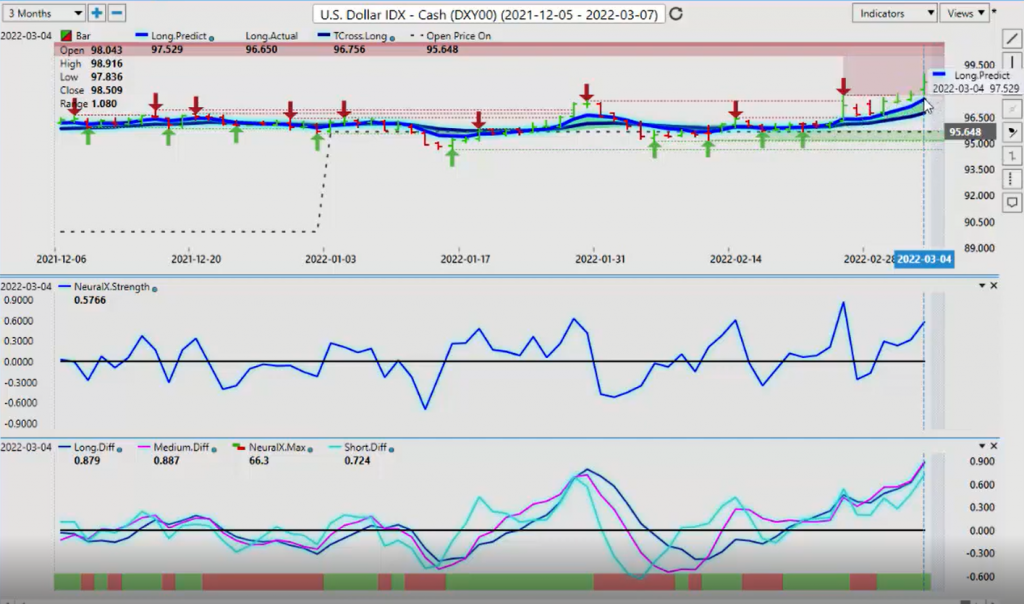
Now, in most cases, whether the payroll number is good or bad here, guys, in most cases, the dollar a little bit softer, but we’re still dealing with a lot of risk aversion here or risk off. So the dollar likely to continue these gains. We’ve cleared a very strong verified resistance high that was at 9773. So if this rally has any real legs, we would be looking to hold above that level. As you can see, our Vantage Point long predicted at 9752, and then again, our T cross long at 9675, but our yearly opening price, 9564, we have ultimately remained above this for the better part of the year. This channel, again, that we’ve been running in, we’re finally breaking above that.
My concern here though, is that we broke above that on a Friday. In most cases, the market will reverse the following week.
Gold
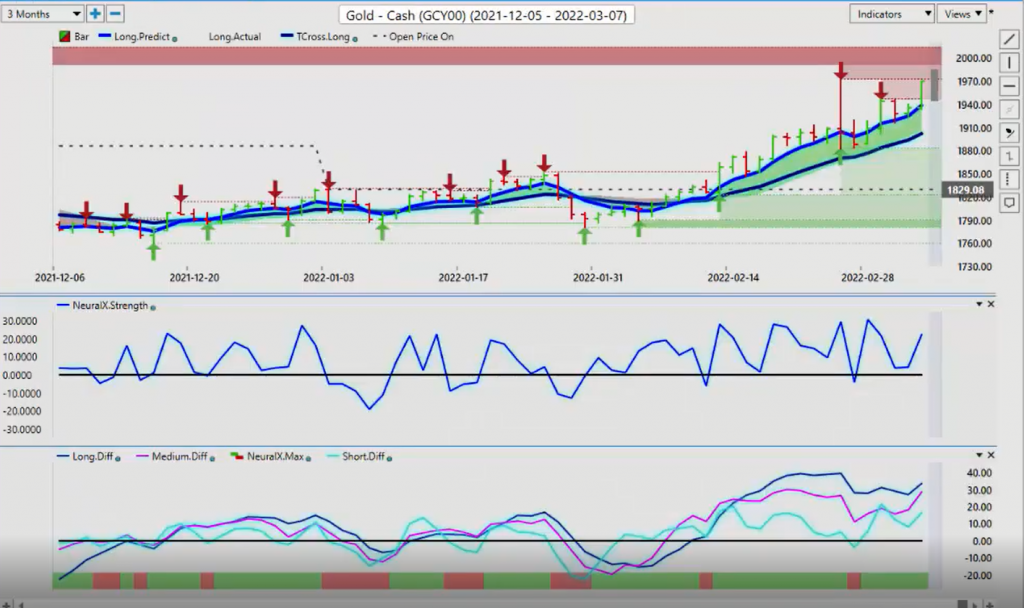
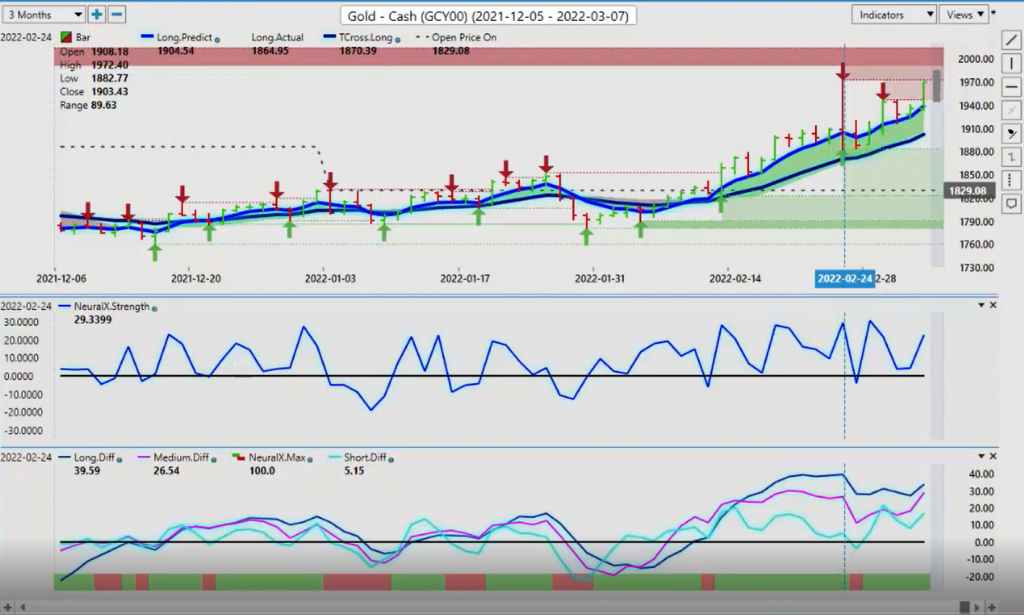
Now, when we look at a cross reference to the dollar and gold, they are both clearly moving up and down together. So when we look at gold, we’ve had a large spike up for obvious reasons with what’s going on with Russia and the Ukraine, but we have not had any real follow through from 1972, the 1972 levels. So this is the level we want to keep our eye on. We have an additional verified zone here coming in at 1946, but in my respectful opinion, this is the one we have to keep an eye on. Now, if things calm down, there’s some sort of an agreement between Russia and the Ukraine and this doesn’t accelerate or intensify, then gold is on borrowed time. It’s just a matter of time before it sells off, but I don’t believe that will happen in any large amount, as long as we have this conflict.
So again, it is dictating the price of gold to some, and obviously it’s dictating the price of oil, but again, if this thing is going to move, then we do need to move above this verified high at 1972, I believe there’s a very strong possibility that we can do that, but we also want to keep an eye on our support lows, because again, when most people are trying to pick tops and bottoms in the market, one is usually very clear. So we do have a bottom here in gold, the yearly opening price at 1829. We then follow that up with our T cross long at 1902, and then our long predicted, which is more of a intra day or day-to-day level where we can enter the markets. That’s at 1939. So again, we’re holding above all of these levels. When we break down below the long predicted, we have our T cross long below that for that additional support. So again, we’re not looking at picking tops here, guys. We’re identifying what we can see, which is the three lower bottoms to the current price of gold.
S&P 500 Index
Now, when we look at the S&P 500, again, a pretty solid trading week based around last week’s 4X weekly outlook, or excuse me, Vantage Point AI Market Outlook. What I had stated, just to follow that up, is that we closed week ago this Friday. We closed at the high of 4384, and we have done nothing but sell off since then. We’ve got some people buying down here, but again, what I had stated is we keep an eye on the T cross long. We sell into this level until we can’t do it anymore. Longs are very, very dangerous to say the least, as I had stated. Now again, when you’ve got these so-called market gurus and everybody else talking about picking bottoms and its bullish, it’s a tough argument here, guys. The yearly opening price, or price on open is 4771. We have not been positive on the S&P 500 this entire year. We’ve dropped, I think, about 13%. We’re tracing back up to about eight or 9% that we’re still down on.
It’s been a very long time that I personally have not seen the S&P 500 get above the yearly opening price in the month of January. So again, as you can see this, to make this clear so there’s no confusion, the level I’ve identified last week was right along this T cross long. Every single day, this represented a short trade using just the predicted moving average by itself. That’s one of the reasons that I removed some of the confusion here, so we could focus on these key levels. Now, the other thing we can look at is potential straddle plays, that if we lose that Vantage Point, T cross long, that level, which I will identify for everybody, because we have an awful lot of stock index traders, that we look at this, the T cross long is moving down. We’re now at 4377. But as you follow the money for at least 2022, you can see that we’re struggling along the yearly opening price. We come down, we trace back up to the Vantage Point T cross long, we struggle along this area, and then we make another new low.
Now this is where often people will confuse this, that we’ve got a bottom in place, where in actual fact, we don’t have a bottom in place at the current time. With the risk risk aversion hitting the markets, the S&P 500 could significantly drop even further. But again, the key thing we want to make sure we’re doing is identifying the level of where the market is going to turn and not be bothered picking tops and bottoms. The top clearly in place here, as I’ve out outlined, but the bottom is not in place yet, in my respectful opinion. So if we come back and we look at the structure of this, I would argue that if you’re looking at bottoms or a potential bottom, that would be down around the 4079 mark. Obviously, looking at the structure of this pattern, it is attempting to do just that.
Now the seasonality with stocks, I will bring that into play. This is perfectly normal for the S&P 500 to be selling off at this time, but usually the S&P 500 and most of your global indexes put a bottom in around the March the 24th, March the 25th area. So we could be getting close to a bottom, but clearly this past week, and we are not in a bottom, and it’s excellent selling opportunities. Myself, I’m taking 60 to 80 full points a day tagging my limit orders right around this area. Now I will say, this is another classic bull trap right there.
Now this was induced by the fed. I, in my personal trading career, of never seen a fed announce a rate hike decision while testifying before Congress. Very dirty trick that he pulled, but make no mistake, in my respectful opinion only, he did that for one reason. He knows that these stocks are in trouble, and he’s trying to push that back up by removing any chatter about a 50 basis points hike. He’s saying he is not doing that, but he is definitely going to hike quarter basis point. That’s a dirty trick, in my opinion. But if we look at things for Monday, again, we have our resistance points. We’ve got a verified resistance high that’s coming in at 4484. So again, we can put buy orders just above 4484 and stay short while this verified zone and the Vantage Point T cross long continue to hold. But as you can see, the color of the verified zones get very dark red in color as the market starts to approach that yearly opening price.
Bitcoin
Now with Bitcoin, Bitcoin remains firm here, but again, we’re getting all tangled up in these verified resistance zones. That resistance on Bitcoin here is 45,734. But again, when we look at the seasonality of Bitcoin, it is normally weak during this period also, but towards the end of March, we start to see buying pickup in Bitcoin. So we’re staying firm within the overall channel. We are bearish on the year below the yearly opening price. We retested it very close to that level, again, last week, excuse me. We came back down, but again, we’re looking at this channel in Bitcoin to hold.
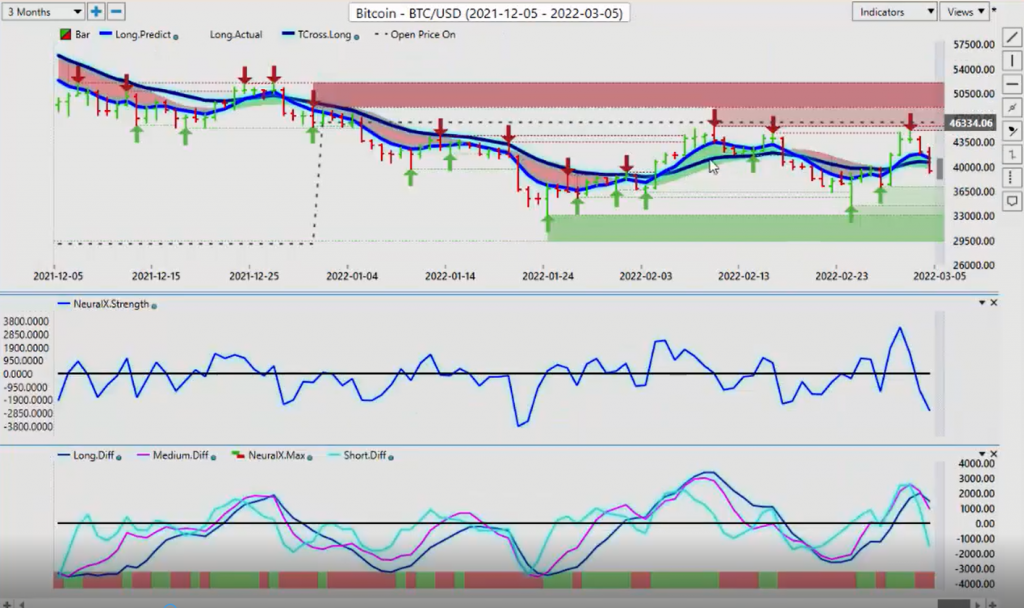
Then ultimately, we’re looking for a break above 45,734, but for next week, we’ve got our neural index down. Our neural index strength is pointing straight down and we have an MA diff cross. So all things point to further weakness in Bitcoin. But again, that’s perfectly normal at this time of year, just like the S&P 500. It’s perfectly normal. February and March are the worst months to buy the S&P 500, and Bitcoin is no different. So if and when the S&P 500 and the global indexes turn around, Bitcoin is likely to follow that. So there will be, I think, some pretty good opportunity coming up.
Crude Oil
Now light sweet crude oil, I will certainly give kudos to Vantage Point on this one. Their original buy on oil came all the way back here in December the 27th, when these modified predicted moving averages. So I’m using the long predicted and the T cross long. So again, that has shown oil rising, but obviously when the Russia-Ukraine war comes to an end, so will the oil prices at these levels. So hopefully that will be soon here guys, because we’re all really feeling it at the pumps, especially in Canada. We’ve hit several places in Canada, Ontario where we’ve hit $2 a liter, unprecedented levels. A lot of that is carbon tax, but the fact of the matter is it’s still that these high oil prices are hurting everyone.
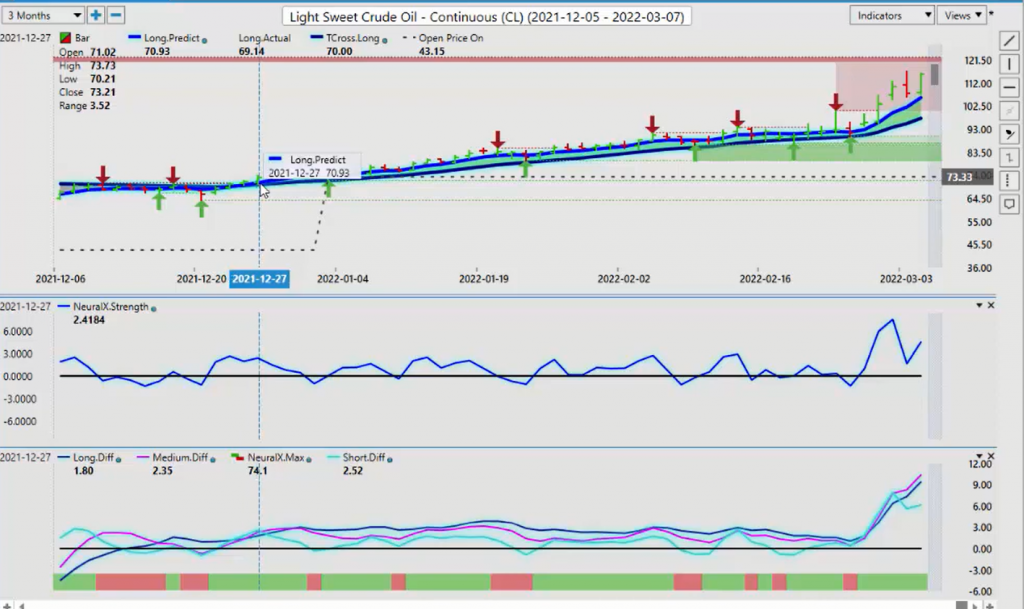
So we do have some resistance up here, but we really have to go a long way back to find it. The verified zones will seek out in the market where these levels are, but as you can see, I have to go back almost 10 years to find this kind of pricing on oil. That didn’t last long, by the way, when we got up to these levels up around the 120 a barrel, I think Goldman Sachs at that time was calling for 180 a barrel. Ultimately we went down to almost zero. So just a side note there, be careful when you’re listening to forecasts from companies like them. Because again, they don’t always have our best interest at heart, right? So we’re getting a good strong recovery here, but right now, I would say we are heading towards that $10 a barrel mark.
Now, as we come into this again, we’ve looked at the major global markets here. We’ve looked at the dollar index, I’m using the S&P 500 to gauge the global equity markets, which are obviously had a very tough week, again, last week as predicted. We’re looking at Bitcoin, and again, when we branch out now into the currency market, it’s very important that we look at some of the main payers.
Euro versus U.S. Dollar
Now, the Euro is obviously the number one traded for X pair. The Euro, again, as predicted, this is a known seasonality, guys, where the Euro is not strong at all usually right up until… It goes up and down, but it’s predominantly very, very bearish here anyway. So this is being really… What word am I looking for here? The price is being further distorted with the Ukraine-Russian war, but this is normally a down period for the Euro anyway until about the end of the month. Around the March 25th area, the seasonality will kick in where we may see some buying.
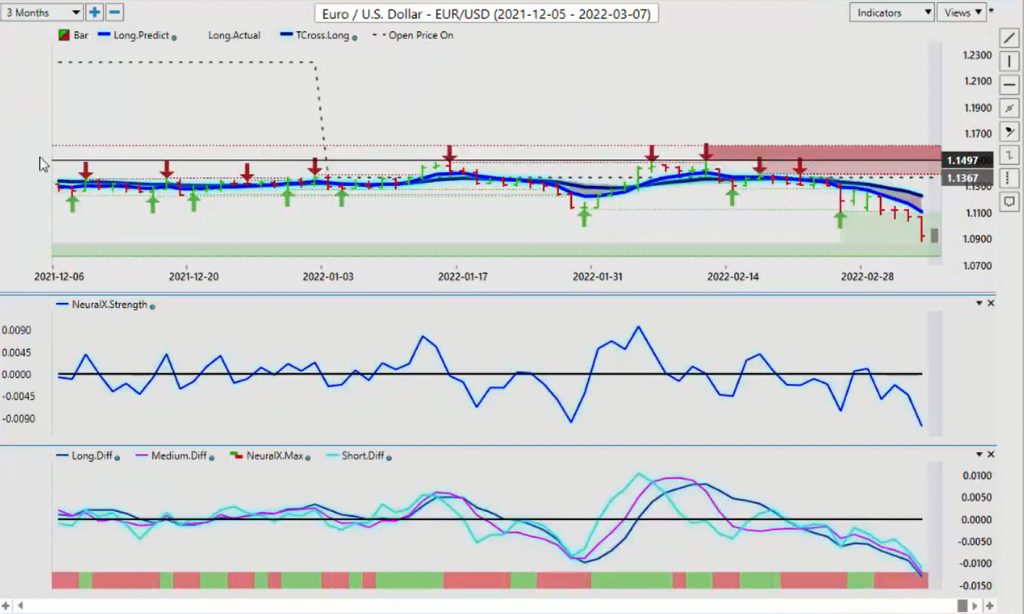
Now, the event risk that you want to keep your eye out coming up this week is, of course, any kind of surprises from the ECB. I think the market will be watching and listening very closely, because we had that surprise comment from [Lagaurd 00:13:40] last month, where she was actually talking about hiking rates later this year. That came completely at her left field, caught everyone on guard. The Euro had a big rally, but the rally fizzled out within a matter of days, because realistically, the US is far ahead of them on rate hikes. That hurts the Euro. Now you’ve got the conflict in Europe. It doesn’t benefit the Euro or the pound in any way as equities collapse. So again, we can see we’ve lost a very significant verified support low that was at 11107. And then we can assess here that price accelerated from that level.
Now, what I find very interesting about this too is, again, even during that period where we had the neural index was green, the neural index strength was showing something very different pointing down, and it continues to accelerate and point down. Now, we could see a bottom. We could be getting close to a bottom in the Euro, but again, I, for one, am not a fan of picking tops and bottoms, especially when the top is crystal clear, just like the S&P 500, it’s crystal clear that it’s not bullish. It’s quite bearish actually, until it breaks through, as I stated certain levels. So if we look at the Euro now, we have to go back a few years, but remember, when we go back a few years, that doesn’t make the Euro look much better here, guys, because what had happened here is the Euro got the bulk of this move when the Federal Reserve did that emergency rate cut on March the 15th, but the Euro was in big trouble prior to that.
So when we look at the low, at that time, it was 10636. So these are pre-COVID. This is where the Euro was pre-COVID. Okay. So when they keep saying, “Well, the Euro can’t go any lower, it’s going to go higher.” Just remember this is where it was prior to COVID. So it would certainly suggest there is a strong possibility that we can move down towards this 106 level, because that just brings us back to where we were. The ECB may or may not be hiking rates, but the US is. Powell has clearly stated he is supporting the hike and he is hiking. So again, this remains bearish for the Euro, but I would imagine there will be some kind of retracement here.
So what we do with our Vantage Point software is we look at those levels. The long predicted is 11107, our T cross long, 11225, but our yearly opening price, 11367. In my respectful opinion, this was never bullish to begin with. We’ve been in this channel almost the entire year. You can see going, or at least the last three months, and that channel is now broken. So again, be careful about picking tops and bottoms in this type of market when, especially like the S&P 500, the top is so clearly identified, right?
U.S. Dollar versus Swiss Franc
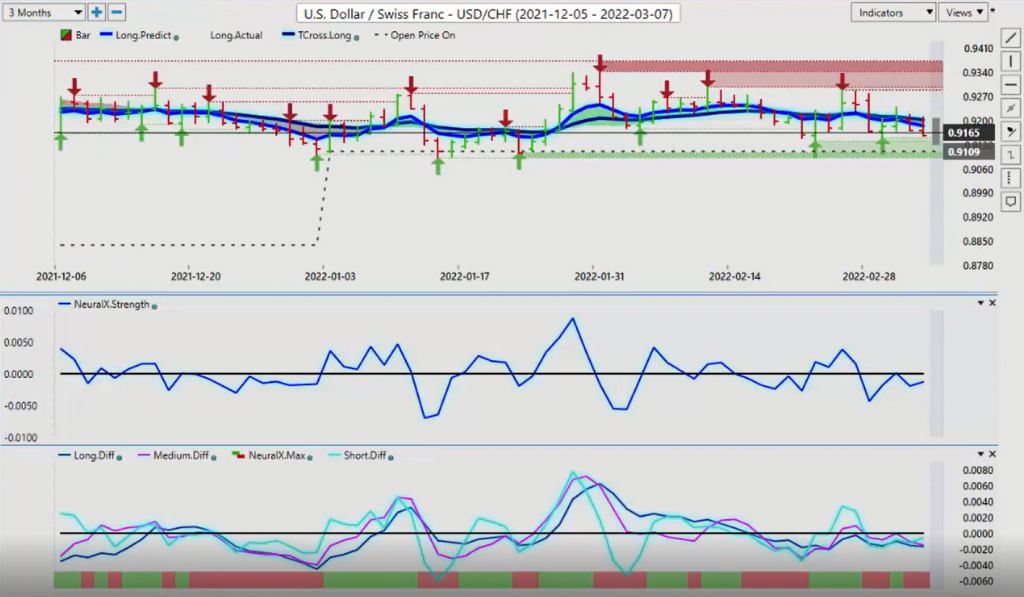
Now the US Swiss Franc, when we’re looking at places of value to continue to buy dollars, US Swiss Franc, even though it’s a risk aversion, the Swiss Franc is a risk aversion currency. It still presents good buying opportunity be here, but we’ve got to get over these VP levels. The T cross long is 9203. And then we have our long predicted at 9186. So I believe for Monday’s trading, we’ve got a low here of 9133. I believe that’s a very good entry point for longs, because again, we identify at this time of year, the PR primary trend.
The primary trend in US Swiss Franc is up because it’s above the yearly opening price. It’s some degree a non indicator, because it’s not something we can debate, whether it’s waves, accumulation, distribution, all these different wild and wacky names that they come up with for indicators. It’s a simple price-based analysis where, okay, we’re positive on the year. So again, until we break down below that yearly opening price, then this would actually be somewhat of a premium long trade down here. The seasonality on the this particular pair, it’s usually strong well into April. So again, a decent buying opportunity.
We’ve got our predicted differences are still bearish, but our neural index strength, as you can see, is trying to point back to the upside. It’s slightly sloping up, but we would like to get both of these on board, but again, watch your verified zones and watch your yearly opening price. That price on open currently is 9109. So again, and that number is a little off a little bit compared to mine. I think it’s a little bit lower than that actually, but at any rate, in my respectful opinion, when we’re looking at places of value to buy dollars, this is definitely one of them.
British Pound versus U.S. Dollar
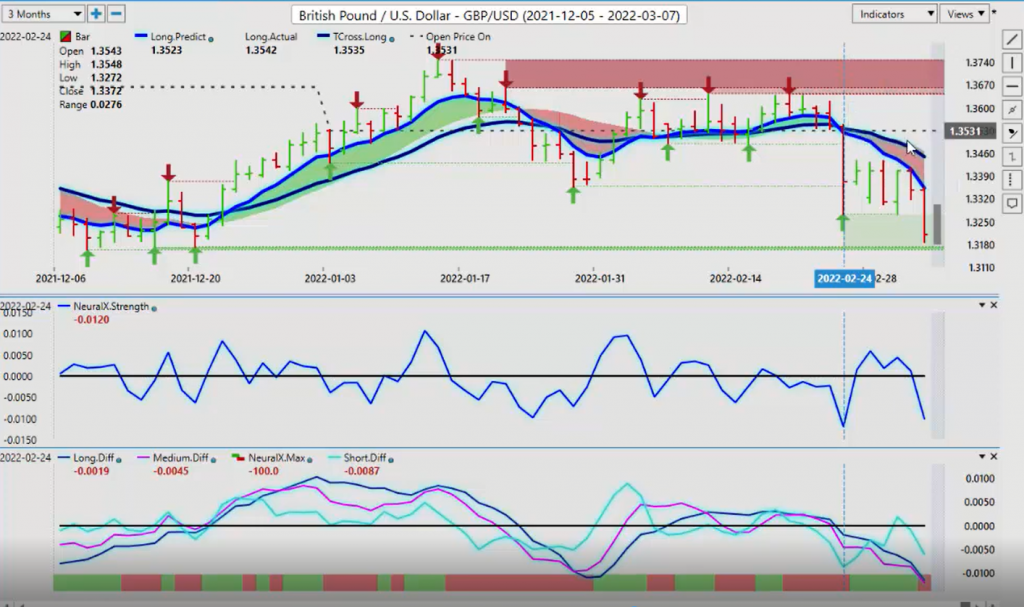
Now with the British pound, again, the British pound, as I had stated before, we’ll follow the S&P 500. In this past week’s presentation, I was identifying levels to get short on this. I did not support longs, obviously longs were disastrous last week. So again, we have crossed over. This is a rare thing that you can watch with your Vantage Point software, is we have our yearly opening price, and we actually have a crossover with these modified predicted moving averages that I’ve constructed here. That crossover took place right on the yearly opening price. That was coming in at 13531. We’ve had a few retracements this week, and just immediate selling, but we actually lost that big level of 13272, where I won’t lie, I was buying down at that verified zone, which I often do. Then I’ll ride it up for the daily range use the Vantage Point predicted high and predicted low.
But for Monday’s trading, there is the possibility we’re getting close to a bottom here. Now that predicted low is 13182. So when we match that to the verified support low at 13173, in my respectful opinion only, guys, this is potentially a make or break week for the pound. If we lose that particular level, then there’s a problem. Again, one of the reasons I did not support longs last week, there’s also a strong seasonality with the British pound that it’s weak until the end of the month. So I believe that there will be fantastic buying opportunity on the British pound. I just don’t think we’re there yet.
Now for somebody that wants to jump the gun and take a shot at this, that would be the recommended level on the VP low. The only thing that I’ll warn everybody is that on last Sunday night, and this video is being done, you can see on my computer, 10:00 AM Sunday morning, there was about a hundred pip gap on the British pound, US dollar straight down, right off the open. I can’t rule that out again this week. So we could take out that level, and then we could see a retracement. But again, watch this level 13173 like a hawk.
U.S. Dollar versus Japanese Yen
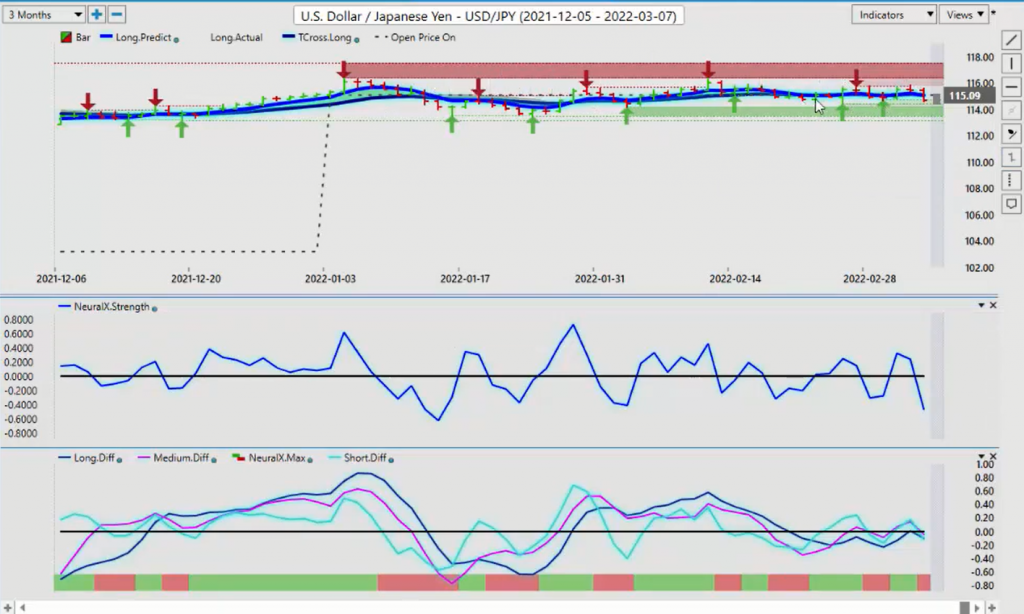
Now, when we look at again, when we bring up our US-Japan pair, I’ve largely avoided trading this pair, because it really is just moving along in this channel for the entire calendar year, wandering around slightly above the yearly opening price, slightly below it. So it’s not the most attractive pair, but if things really start to turn bad in the Ukraine area, then obviously, this would be pressured to the downside. So again, we’ll watch this very closely, but for now, the only real recommendation that I can have here is continue to play this channel that we’ve been stuck in, the low 11349. We’ve got a high point up here about 11530, maybe slightly… No, not slightly. More than that. Excuse me. 11634.
So again, this is what the market is giving us, 11634, and about out the 11350 area. We lose 11350 along these verified zones. I could go back a little bit further here and say 11314, which I think I should. We break down below that, guys, then this thing starts heading lower, but we also want to watch the top side. I believe we still have a shot this year of getting up around 11750 on this particular pair. Now, when we look at some of your main equity-based currencies, this is again, something that I personally have not seen, the US-Canadian pair, unable to make any real gains with oil prices at these particular levels. So when we look at the US-Canadian pair, you can see that, once again, that yearly opening price is a trade inside of itself, guys. That price on open for the year is 12637. You can see how they pushed this down on the Wednesday during the Powell testimony, when he talked about the interest rates and the stocks took a big move up above 4400, but immediately collapsed the next day. You can see how that affected the US-Canadian pair. It immediately responded and moved higher on Friday all the way up almost to the 128 area.
U.S. Dollar versus Canadian Dollar
But the US-Canadian pair, the seasonality on this pair is that the Canadian dollar is usually weak at this time of the year. But even with these oil prices, it can’t seem to get any traction. But the way I would recommend playing this one is selling up towards the 12877 area and using the verified zones in the yearly opening price to buy lower. But remember, I’ve talked about this many times in the Vantage Point live trading room, that you have this reversal thing with Canada that happens from Monday to Tuesday. So if it rallies all the way up, big rally up on Monday, then 85% of the time, it crashes lower on Tuesday, and vice versa. So be careful with this pair, but that particular trade alone, people are starting to track it after I mentioned it. They’re showing some incredible results on that reversal play.
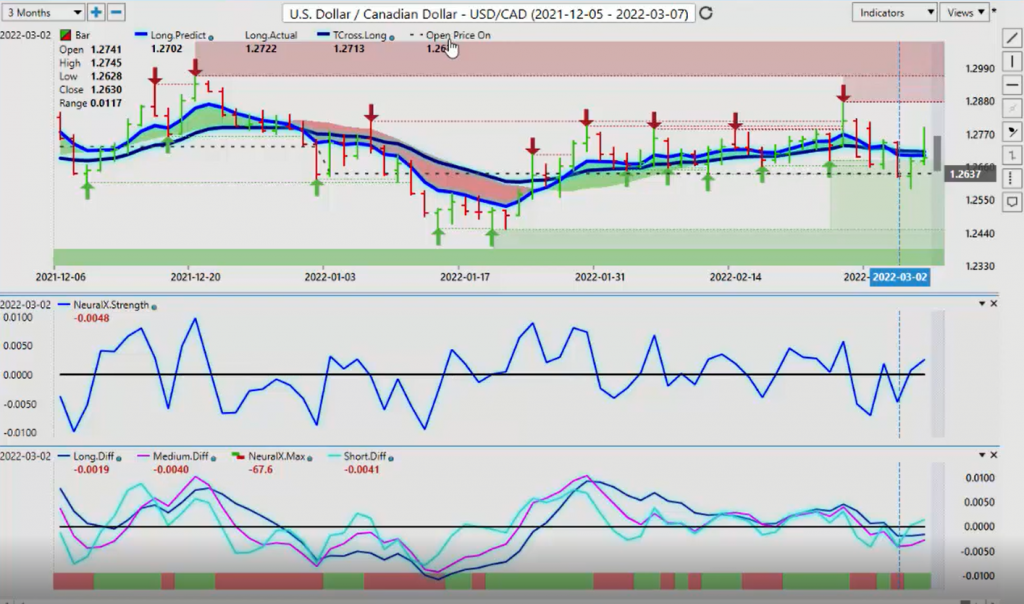
Now that reversal play is predicated on the fact that we’re not in a trending market, also. A trending market, you can blow through all kinds of different levels very quickly, but for now, I believe we are trapped between the 12877 level and the yearly opening price at 12637. A break of either two of these levels will, will trigger a trending move. Ultimately, I believe that is likely to be to the downside, strictly because of energy prices, oil prices, Bank of Canada has now hiked. So we’ve got that under our belt, but the US and Canada are both hiking. So slight edge to the US dollar for at least another three to four weeks. That’s the seasonality, guys.
Australian Dollar versus U.S. Dollar
So when we look at our Aussie and our New Zealand, now, these two are very, very interesting. The reason I would focus on what’s happening over here is the Canadian dollar is not, or at least right now, is not following the Aussie and the Kiwi. They’ve moved above their yearly opening price. The Vantage Point accurately, I might add, predicted that this move was going to go higher, but it would be considered corrective while under that yearly opening price. So this could indirectly point us to say, okay, the Aussie and the New Zealand are not risk aversion currencies. This much, I can tell you. They normally go up and down with the S&P 500. Somebody is putting money into the Aussie and into the New Zealand currency. There could be a number of different reasons for that, but this is something I personally haven’t seen before.
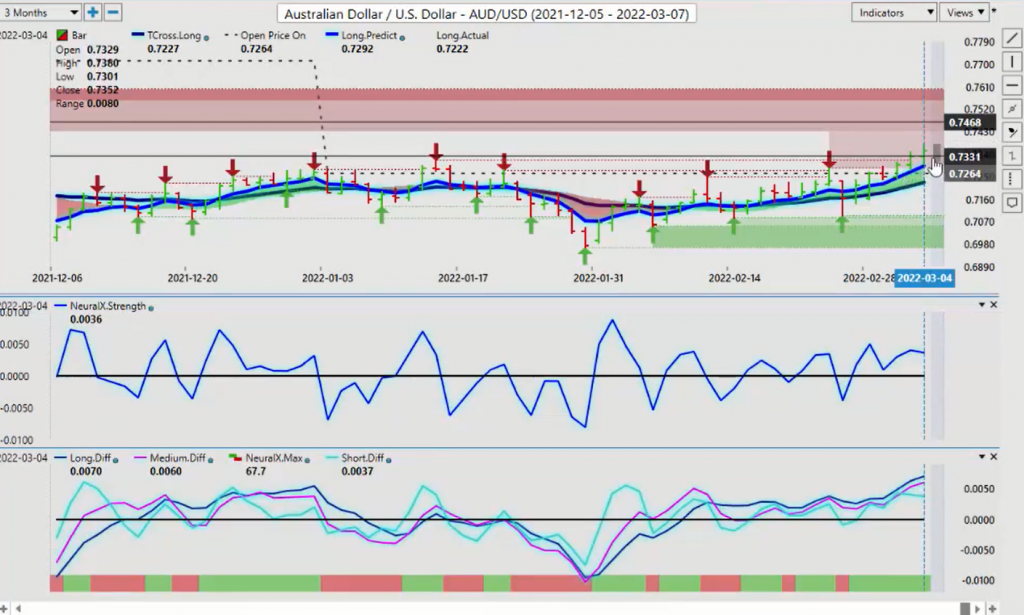
So I would attribute that to interest rates. But again, when you’re looking at trading payers like great Britain-New Zealand, Great Britain-Australia, Euro-New Zealand, Euro-Australia, you never want to buy those pairs when you see this kind of strength, because remember, there is no such thing as Euro-New Zealand. Euro-New Zealand is made up of Euro-US and new and New Zealand-US. So Euro-US is well down. New Zealand-US is well up. So if you translate that over, that equals a sell on Euro-New Zealand, a sell on Great Britain-New Zealand, Great Britain-Australia.
New Zealand Dollar versus U.S. Dollar
So for now, I’ll continue to monitor this, but for this coming week, that price on open, the yearly opening at 7264, we have our T cross long at 7237. Again, we can identify a bottom, but the top is in progress, very much so. When we look at the New Zealand currency, I’m seeing the exact same thing. We are trying to clear that yearly opening price. Now, again, if we can’t get above this, if one of them is… Excuse me, if one of them was going to go higher, my money would always be on Aussie versus the New Zealand. But again, this very well could be a bull trap up here on both the Aussie and the New Zealand.
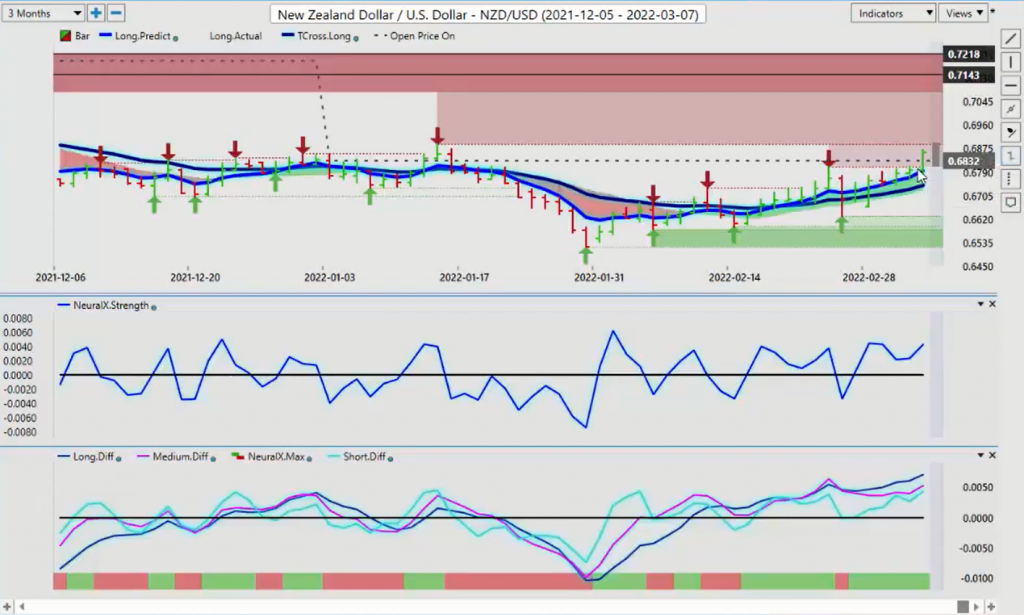
The reason I’m saying that is, for all intents and purposes, why would they rally after a fantastic non-farm payroll number out of the US and a clearly bearish S&P 500? So either the S&P 500 is getting ready to move higher soon, or this is a false move on both Aussie-US and New Zealand-US. So the New Zealand level is coming in, price on open, the yearly opening price. 6832. We follow it down to the long predicted at 6795 and our T cross long, our last line of defense here, guys, 6741.
So with that said, this is the Vantage Point AI Market Outlook for the week of March the seventh, 2022.


