Welcome to the Artificial Intelligence Outlook for Forex trading.
VIDEO TRANSCRIPT
U.S. Dollar Index
Okay. Hello, everyone. Welcome back. My name is Greg Firman, and this is the VantagePoint AI Market Outlook for the week of July the 18th, 2022. Now, to get started this week, we’re going to begin with the U.S. dollar index. But again, I’m going to try and assist traders in understanding these choppy, volatile markets. But in short, essentially, all markets are basically down. Bond markets, equity markets, commodity markets, and the dollar is causing the bulk of this move against these other markets. So in my respectful opinion only, this is not sustainable. Interest rates, again, we could debate this up and down, but what we’ll do is focus on price here in this week’s session looking into next week’s trading so you have some idea what to expect.
Now, when we look at Monday’s trade, again, just coming off the VantagePoint seminar in Tampa, a really good time down there, meeting a lot of nice people, we can see that again, the bulk of the dollar gains occurred in one or two of the trading days, both of which are reversal days, Monday and Thursday, you can see that price was not sustainable after either one of those days. We had the U.S. CPI number, which is debatable in my, again, in my opinion, it was not a hot number when you look at the core number. The core number from March was 6%. This number was 5.9. Now the question remains, will the Fed respond to that and say, “Okay, well we believe that maybe inflation is starting to peak.” Very difficult to say. But again, that headline number I believe was around 9.1%, that’s month over month. Core numbers, guys, is what we look at.
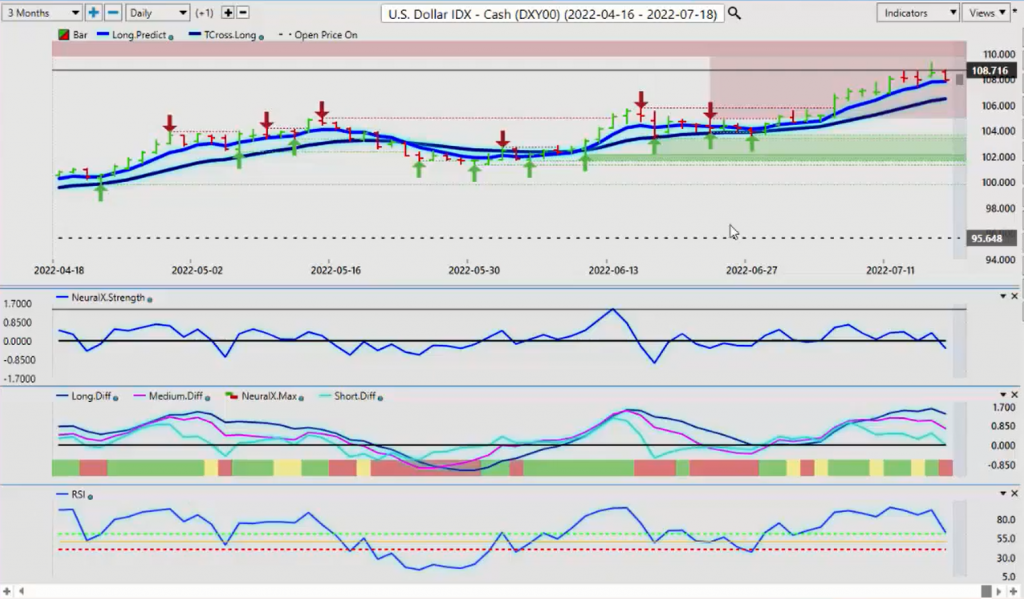
When the dollar made a big push up on Monday, you can see Tuesday was a reversal day, Wednesday, despite that very hot CPI number, we came back down again. But then we rebounded off of the long predicted at 107.80, only to fall again on Friday. Once again, the structure of these markets, I would directly advise you guys to stay out on Monday and stay out on Thursday. Monday will set the tone for the week. So when we look at the indicators going into next week’s trading, because this is an outlook, not a recap of something that’s already happened, when we look at the neural index strength and the neural index, they are both down. The neural index is not a long term indicator here, guys. It’s one to three days. Excuse me, that’s it. Don’t get confused that the neural index is a trend based indicator, it’s not. It’s basically a shorter term indicator giving us the market direction. Our MA Diff is crossed to the downside. Our predicted RSI is falling and we are not pushing any higher after that big move really on Monday and part of Tuesday.
As long as we can identify this, this would tell me, looking at monthly patterns, around the 15th of the month, the dollar usually does not do well between the 15th and the 30th. So again, when we look at this pattern, then we have a strong, seasonal pattern in the VantagePoint software that is suggesting the dollar is just about capped out here. Doesn’t mean it can’t go higher, but it does suggest we’re going to retrace potentially back into this 106.48, 106.48, 146.9 ,106.49, excuse me, to the downside. This is what we would watch for this coming week.
Bitcoin
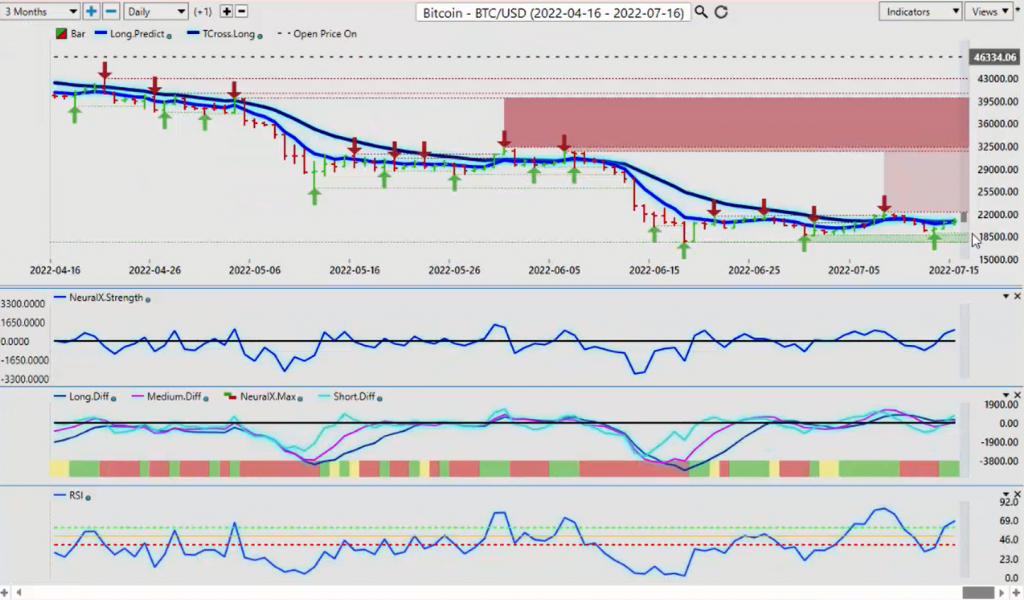
Now, when we look at its arch rival, the dollar’s arch rival, of course, is Bitcoin. I have been an advocate and will continue to be that the powers that be are not being truthful with us. The fact of the matter is that if you bought the U.S. dollar in 1982, you looked at your purchasing power today, you’re 30% less, meaning the dollar itself is down 30%. Again, if we look at Bitcoin from its inception, you’re still up thousands of percent here, guys. The annualized return, 230% annualized return. If you would buy equities on a dip, why would you not buy Bitcoin on a dip?
As I’ve stated also there are several strong seasonal patterns coming up. One is starting at around the end of July. And then my favorite is this one over here from September to mid-October. Once again, if we look at the price structure from last year, Bitcoin started to make its move around July the 22nd. That is a strong, seasonal pattern. That is all I will say. It doesn’t mean it can’t go down further. But once again, when we look at the indicators, they’re pointing higher, another signal that warns us, the dollar may not be as strong as what they’re telling us.
We’ve got our predicted RSI showing momentum, breaking above the 60 level. Our predicted differences, above the zero line. It’s incredibly important, guys, that we’re not using indicators in isolation. We need to combine them together and of course be very mindful of these verified zones. The verified high here, that’s coming in at 22,356. This is the level we must break above at the end of the day. This is the one that we, the level I’ll be watching. I do expect a retest of that level this week and if we can break through it, it could open the door to a bigger move towards the 31,000. But I don’t think we’re there just yet, probably towards the end of the month, as I’ve just shown you on that core seasonal pattern.
Gold
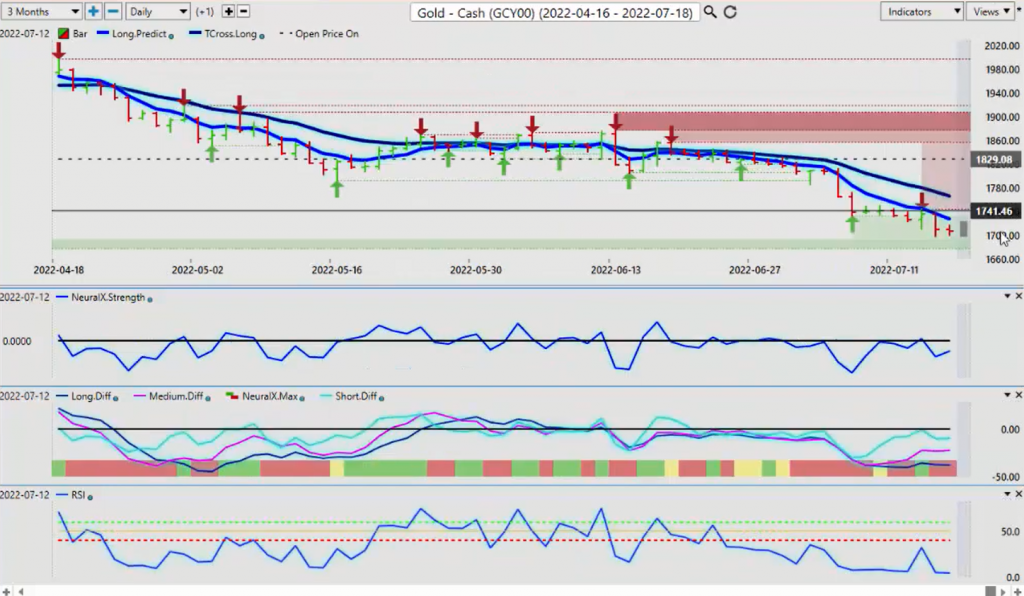
Now, when we look at gold, you can see gold. If we count back five days, once again, we made a push on Monday, we go down further on Tuesday. If we use our opening price or basically the high from Monday, Monday trade, guys, is setting the tone for the week, Monday and part of Tuesday, you can see the next three days gold hits into this basically around the high of Monday price, but it never recovered. We’ve gone into the VantagePoint, T cross long, hitting into that every single day. And you can see that line that I’ve drawn across here is intersecting on Wednesday with the VantagePoint long predicted at 17.45, which triggered a bigger move lower down. My view is that if we look at gold from a different perspective and we go to an actual monthly time frame and we go back here, say 3, 4, 5 years, or maybe, I don’t even think I would have to go back that far, but I will. Gold is basically playing in a range.
Essentially we’re approaching the lower end of that range right now at 16.77. I would find it very difficult to believe that gold is going to go too far below that. If we look at when the global markets have gone into a recession, 75 to 80% of the time, gold has gone higher. That’s a strong fundamental, guys. We’ve also got a seasonal pattern we’re dealing with, but if we go back to the 2021 low, we’re approaching that now. So if gold is going to be, is going to take a bounce, I respectfully submit it will be very, very soon. We’re sitting down around 16.98, we’ve closed at 17.07.
Again, the verified zones are applicable to the daily, the weekly and the monthly charts, but a lot of times traders will gravitate towards the five minute, the 15 minute, the one hour. Even the daily, doesn’t always tell us the bigger picture, but for now I would not be aggressively short until I have a sustained, confirmed break below this particular level of 16.77. And by sustained, I mean, at least 3, 4, 5 days, because again, if there was ever a bear trap, I would argue this is where it could be. Be very, very cautious with shorts on gold.
S&P 500 Index
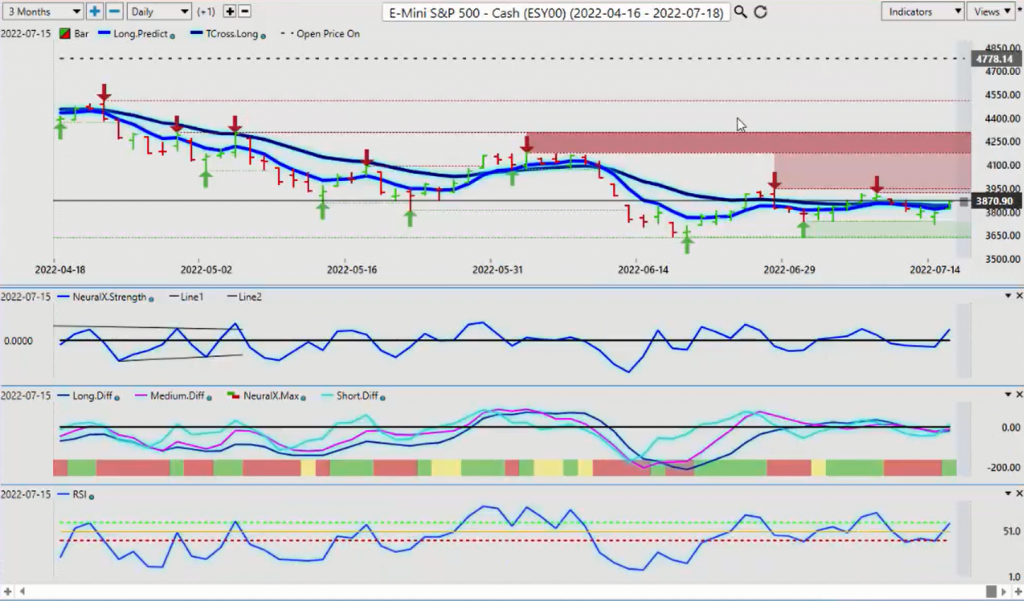
Now, when we look at, further identify what’s going on with the equity markets this week, once again, I will bring up the charts and give you guys a bit of a trading plan, so to speak, which a five point plan we’ve done it in the live trading room. I did it in the seminar recently in Tampa. I would argue that trades should not be entered on Monday. It’s just too choppy and too volatile. But when we look at Tuesday and Wednesday, we can see that prices holding here, we come back up to the Monday high, and then we move lower on Wednesday and lower again on Thursday on equities. And then we start our recovery process.
So to begin the week, it would appear, looking at that predicted RSI, running along the 40 level, that there is very few sellers down in this particular current low. We’ve got a bit of a double bottom there that’s coming in around 37, 37, 38. That will be our support for the week. And again, only in my respectful opinion, stops should be below 36, 36. If you need to go to a micro contract, that’s what I would recommend. But you’ve got to be very careful about getting chopped out if you’re attempting longs.
Now again, with the dollar dictating all of these other markets, the equity markets, the inverse correlation between the dollars, stocks, all of these other markets, guys, any little hiccup in the dollar will send people running into stocks, into gold, into bonds… Well, I don’t know about bonds, but that market’s pretty, it’s in rough shape to begin with, but there is a signal there based around these inner markets that the dollar could be getting ready to finally move a bit lower.
Crude Oil
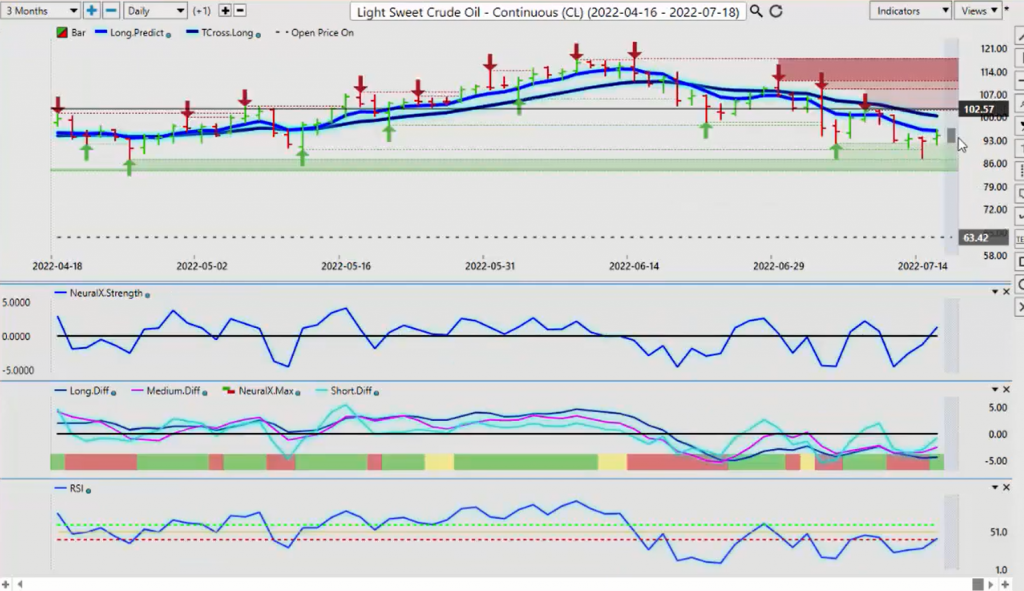
Now again, when we look at oil from last week, you can see that I’ve drawn a line on Monday’s bar to illustrate this. When we look at these moves, we come back up to the Monday high. On Wednesday we have a bigger move. Let me make sure I’m counting that right. 1, 2, 3, 4, 5. Yes, I am. Sorry. So a big move down on Tuesday this week, and then we rebound on Wednesday. We take another big hit again on Thursday, only to recover on Friday. Once again, if you look at these, the bars on Thursday and the bars on Monday, these are days that you want to just stand down. You’ve got profit taking occurring on Thursday. You’ve got fake price on Monday. Be very, very cautious or eliminate it altogether under the current circumstances. Now, I would argue that this is not an extraordinary event with what’s happening, that I’ve seen this Thursday reversal, Tuesday reversal for years. It’s nothing new to me. It’s been being amplified by what’s actually going on in the market.
Euro versus U.S. Dollar
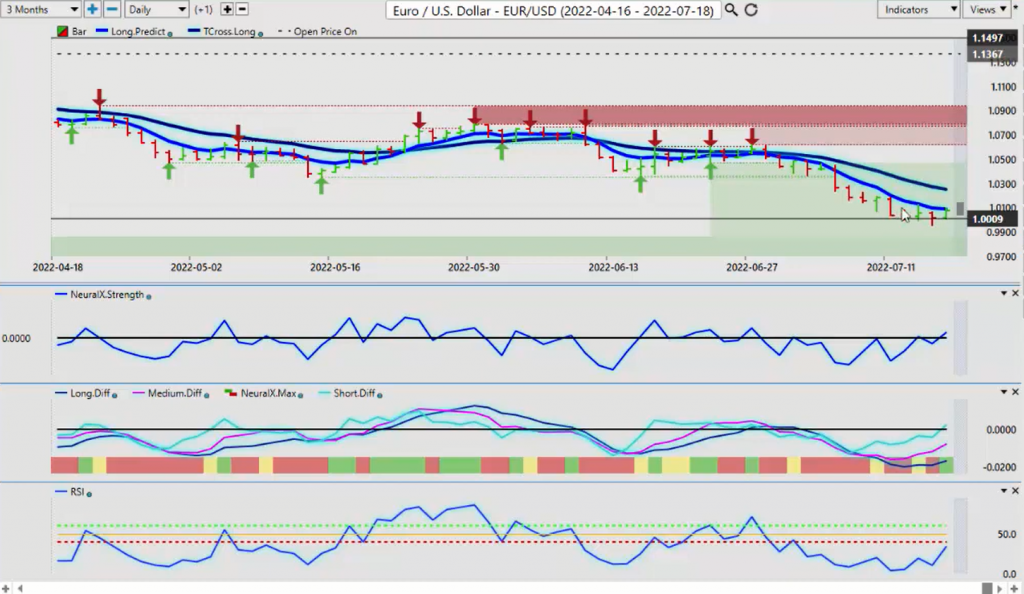
Now, when we look at some of our main four X pairs, once again, when we look structurally at the euro, it looks different than what they’re telling us. If we count back to the beginning of the week, and this is what you will do to start the new week, you will wait, let Monday, the Monday high and low set the tone for the week. And then we start bringing in our indicators. If I look at this closely, you can see the bulk of the euro losses occurred in one day, right? Then we had a little bit of a hiccup down here, but you can actually see this coming down and, believe it or not, longs actually did quite well. This green bar here on Wednesday was the CPI number.
I believe the bigger players are looking at that. They’re focusing, as I am, on the core numbers. I’m not getting, it’s like looking at the U-3 number on the unemployment versus the U-6. The U-6 is the broader measure of unemployment. Well, so is the core CPI. The core went lower. That’s a fact. It did not go above the 6%. It went to 5.9. I believe that the bigger players are now watching this. We’ve got the ECB this week. There could be a surprise, big hike coming from them, which would indirectly again support the euro. But right now you can see that on Wednesday, we are losing all momentum. On Thursday, they started playing games with us, running stops, et cetera, only to recover again on Friday.
But again, right now, the long predicted 1.0087. We must clear that level to get to the T cross long, which is at 102.49. I believe we have a shot at that. Obviously we have very few sellers on this pair below parody. Doesn’t mean it can’t go below that. Once again, the euro hit the 95 level many, many years ago, and there is reason, there’s an argument that it could be going lower again. But my optimism on that remains heavily guarded based around the very, very crowded long dollar trade. When we look at our predicted, our neural index strength, it’s pointing higher, our neural index is higher. MA Diff cross, the predicted moving averages are advancing. The RSI, it’s starting to show momentum building from heavily oversold. It suggests, if nothing else, we could have a test of the 102 level.
U.S. Dollar versus Swiss Franc
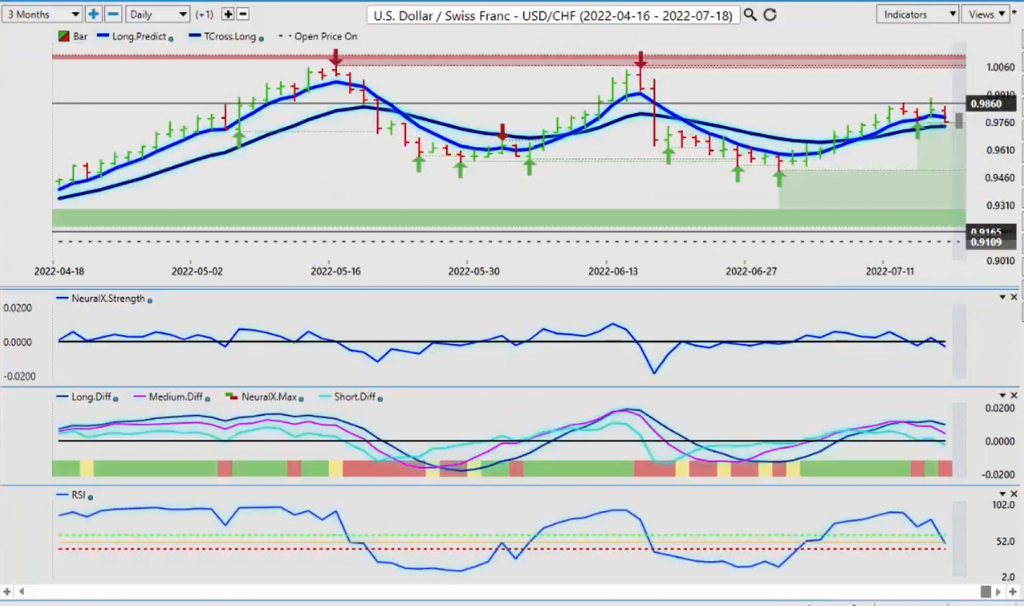
Now with the U.S. Swiss Franc, once again, a very good barometer for the dollar index. We can see on Monday, once again, we make a big push up on Monday, and then we get all tangled up on the high from Monday. We pop above it on Thursday, only to slip right back down on Friday. So once again, this is pointing towards dollar buyers are starting to dry up here. We’ve got an MA Diff crossing to the downside, pointing lower on this pair next week. The hike from the Swiss national bank has leveled the field a little bit. It’s still a carry trade, buying this pair, and not as bad as dollar yen, that’s the worst one. That’s where the dollar is making the bulk of its gains, against the dollar yen. But for now, what we would look at is to see if the T cross long is going to hold next week. 97.36, probably not the best place to be looking for a short. We need a sustained break.
We could see buyers coming in at 97.36. And if that’s the case, then you simply jump on the train. That’s the easiest way to say it. But the bulk of the indicators, again, not using these indicators in isolation, combining them together, and then applying strong price action theories where, we could debate this all day long, guys, as to the dollars strong, the dollars weak, the euros going below parody, yada, yada, yada. We can do all that, but price is telling us that’s not happening right now. There is no buyers on this pair up here after the Monday high, virtually none. We had a little again, a little pop and then right back down on Thursday, on Friday, excuse me.
So once again, I’ll reiterate through this presentation, a strong warning that I’ve given to my own direct clients. Stay out Monday, stay out Thursday, unless you’re a very long term trader and you can absorb this volatility. But again, they’re running stops on us on these days, or there’s huge indecision in the markets right now.
British Pound versus U.S. Dollar
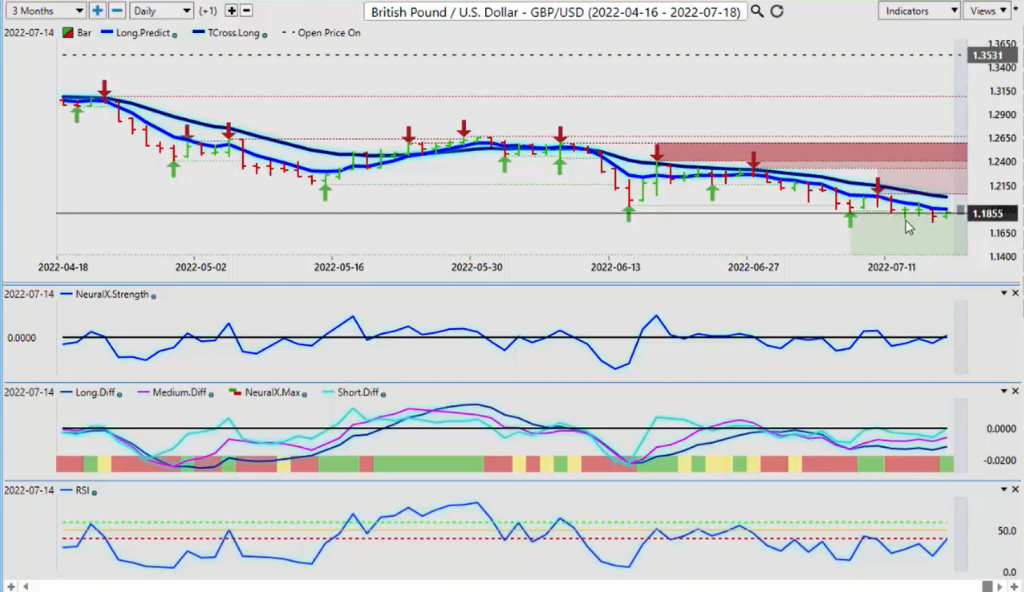
Now, when we look at the pound dollar, once again, potentially a place of value to sell U.S. dollars, meaning buying the pound. So if we count this back and we look at the, once again, if I take the low from Monday, I had a slight extension on Tuesday down, and then you could see we’re basically running out of sellers here. Now there’s a lot of chatter here, 1.16, 1.15 on the pound dollar. In my respectful opinion only, it’s growth. The pound is grossly undervalued and the U.S. dollar is grossly overvalued. If we base it on that, then soon we would look for the pound to turn, but there’s still political problems in the, you’ve got Brexit issues. There’s no guarantee of that. The trend is primarily down. I would not disagree with that, but again, if we’re in a period of known U.S. dollar weakness mid month, then again, we could see a pop and we’d be looking for a retracement back to the 1.20, 27 level.
If we fail there, we can dump out of longs. But if we get above it and we stay above it, then we could see a deeper corrective move higher is what I would be potentially looking for.
U.S. Dollar versus Japanese Yen
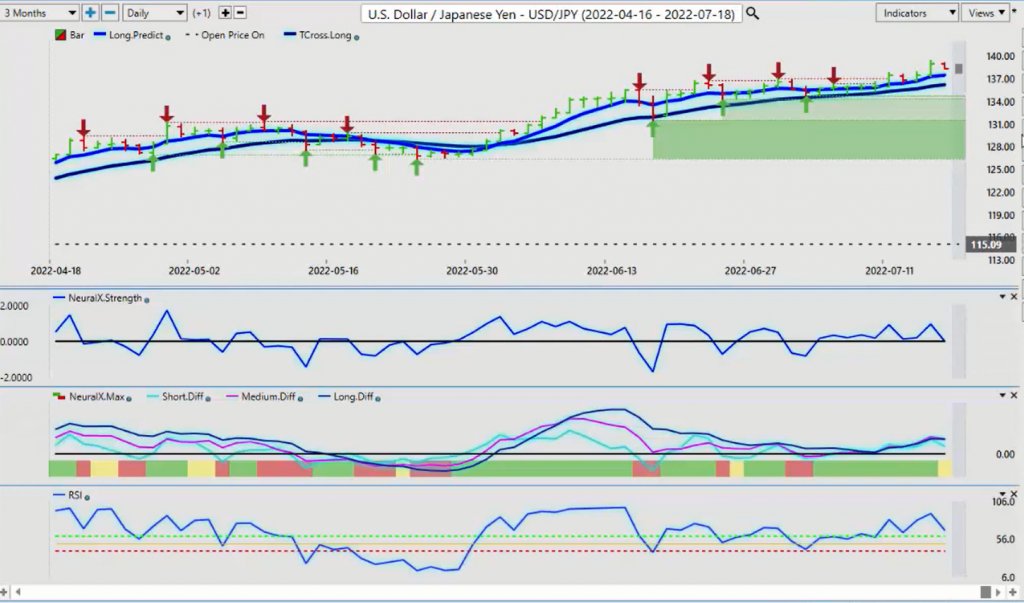
Now, the dollar yen is certainly not one of my favorite pairs. I believe the dollar is grossly overvalued against this particular payer. When we look at, again, applying our high from Monday’s trade, we look at this and say, “Okay, we’ve had three days. After Monday, we’ve got two good days of selling here.” Well, actually just one on this one. This trade didn’t, there was no short there on Wednesday, but then on Thursday we popped above the weekly high range, only to lose those gains again on Friday. The indicators here on dollar yen are extremely mixed. The neural index is frustrated with this pair, as I am, as many traders. The dollar yen at $1.40, that is grossly overvalued, but it still continues to go higher.
When this one turns and it starts moving lower, it’s going to be very, very ugly. I don’t know when that’s going to be at the particular time, the carry trade, as long as the Fed is in the camp of hiking, then the carry trade is on full display in this particular pair, meaning the U.S. hikes rates, Japan does not. The interest rate differential between the two countries continues to widen and that equals dollar strength. But the other pairs, the Aussie, the New Zealand, maybe now even the euro, and Canada, the Canadian dollar, they’re all hiking here, guys, which I’ll talk about here in a second, but the dollar yen, be very cautious with this pair.
U.S. Dollar versus Canadian Dollar
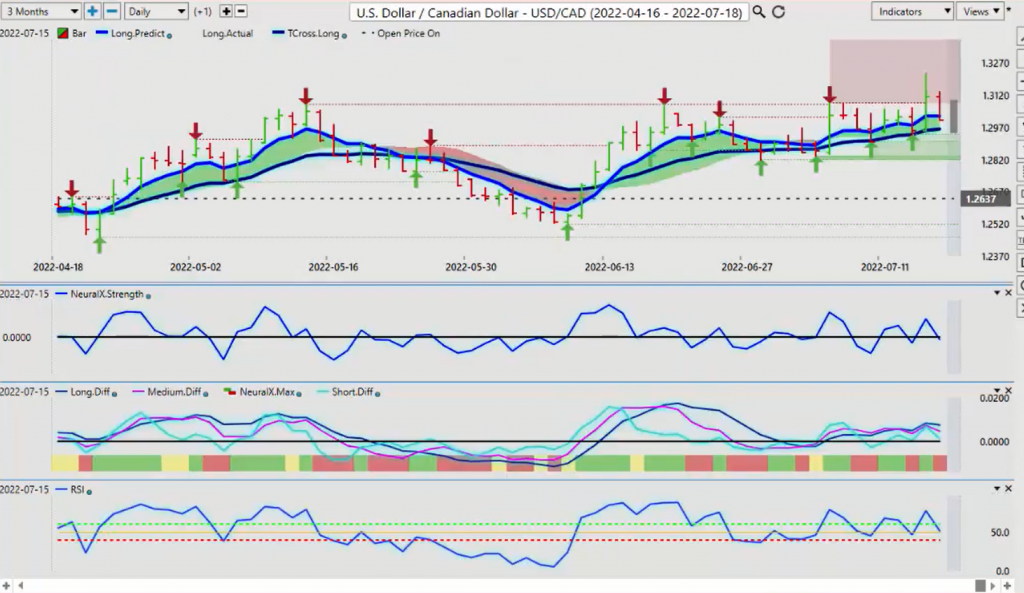
Now with the U.S. Canada this past week, when we look at this once again, if you start your trading week by doing this, we’ve got 1, 2, 3, 4, 5. Then I put my line right there on the high of Monday. Okay? And this is where we have to debate whether this is truly what it appears to be. U.S. Canada makes a big push to the upside in Monday trading. Then on Tuesday, we’ve got our reversal, down it goes. Then on Wednesday, we had a big move low, big move down off the exact same level. These are three days in a row with three shorts. Now, the Bank of Canada hiked one full percent. They could be getting out ahead of the U.S. Fed. But the fact of the matter is that had no bearing on price. We had a big spike up, all the way to 1.32 on Thursday. They flushed out all the, most of your shorts. But the fact of the matter is when the equity markets and the oil markets, like sweet crude oil, when they plummeted, they pulled the CAD down with it.
Do interest rates really matter that much? The answer would be no. The inner market correlations, when the S&P sold off, oil sold off, the Canadian dollar immediately tanked, but you can see where we tanked right on the T cross long. This is the sticking point for next week, 1.2958. You can see that all of those gains where it pushed the U.S. Canadian pair up, when oil and stocks recovered on Friday, U.S. Canada fell back within the overall range between 1.3080 and the lower end of this particular. The bottom we have on this range right now is coming in about 1.2837. This is the range we’re still dealing with. The indicators here, again, grossly mixed here. We study price. We begin the week. We let the market push higher or lower on U.S. Canada. We set our levels and then we apply our indicators and away we go. That is the way we would want to do this.
Australian Dollar versus U.S. Dollar
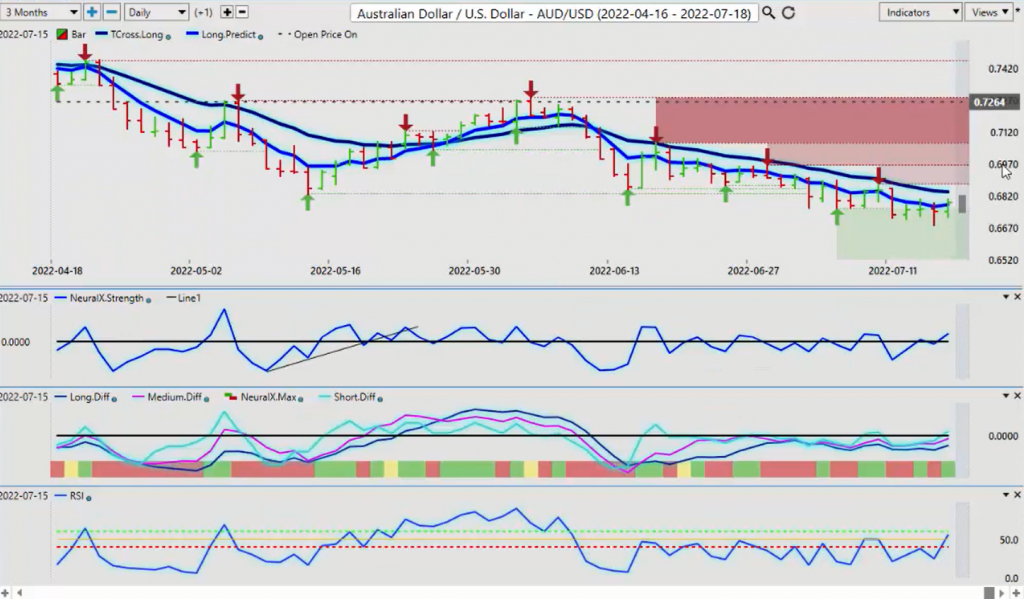
We would apply the same thing to the Aussie because when you look at it from the perspective that I’m talking about here, counting back 2, 4, 5, there’s our big push down on Monday. The bulk of the Aussie losses indisputably occurred in one single day. Then you have multiple buying opportunities every day thereafter, even with that very choppy Thursday trading. The indicators right now are pointing higher. Neural index strength, predicted differences, all of these indicators are warning that the Aussie is going to turn around. But for you guys as traders, what you have to understand is we need, well, not necessarily oil with the Aussie, but we need stocks going higher. If we get more of a risk on environment, the Aussie will benefit from that. Watch the S&P 500 very, very closely.
New Zealand Dollar versus U.S. Dollar
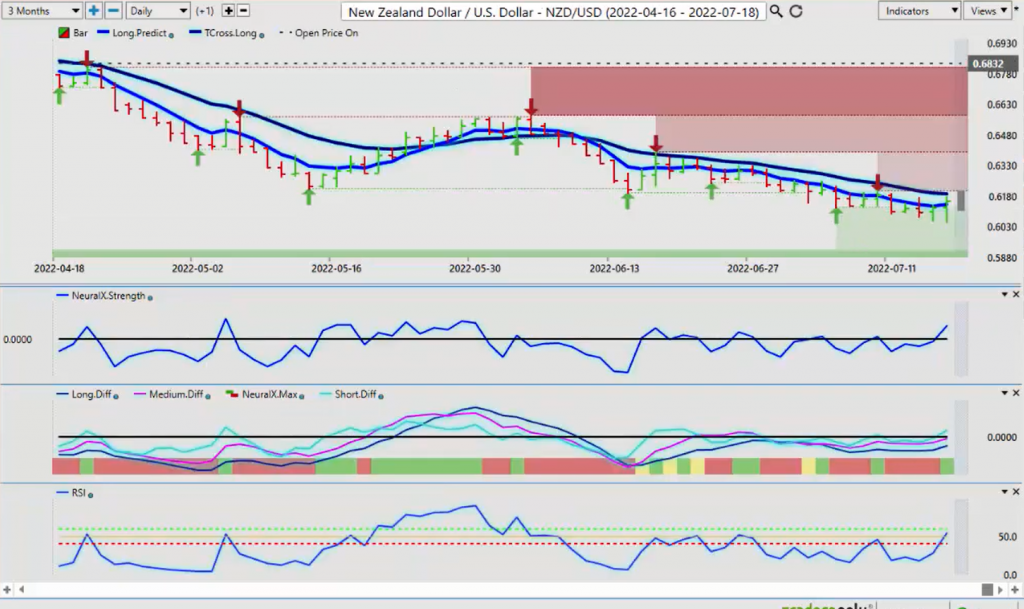
Also with New Zealand. If I take the New Zealand currency and I simply apply this, you can see the bulk of the losses occurred on Monday, and then we flatline the rest of the week. But when you identify that low price, and then, and only then, do we start applying the indicators because we need to study price here with these markets. They are trying to, they’re throwing everything but the kitchen sink at you guys to fake you out on everything. Bull trap, bear trap, we’re getting caught in them. Just remember the two days where you’re going to avoid will be Monday and Thursday. Because again, if it’s not a true price, then it’s very difficult to predict it. If you have panic in the market getting out of positions, trying to get into positions, it’s creating this volatility.
But I would argue indisputable the people that are really causing this volatility are the Fed, all the central banks. If they’d simply butt out of this, then supply and demand will take over. But until… I do not expect that to happen in my lifetime. They will continue to create the success of volatility that is driving most of us crazy. With that said, this is the VantagePoint AI Market Outlook for the week of July the 18th, 2022.